 Open Access Article
Creative Commons Attribution 3.0 Unported Licence
 nanocrystals (0 ≤ x ≤ 1): growth, size control and shell formation on β-NaCeF4:Tb core particles†
Jannis
Wehmeier
 and
Markus
Haase
 *
*
Inorganic Chemistry I, Universität Osnabrück, Osnabrück, Germany. E-mail: markus.haase@uos.de
First published on 4th November 2020
Abstract
 is an interesting shell material for β-NaREF4 particles of the lighter lanthanides (RE = Ce, Pr, Nd), as variation of its strontium content x allows to vary its lattice parameters and match those of the core material. It crystallizes in the hexagonal gagarinite structure (NaCaYF6) which is closely related to the hexagonal structure of β-NaREF4, known from the upconversion host lattices β-NaYF4 and β-NaGdF4. Here, we studied the formation of
  nanocrystals over the entire range 0 ≤ x ≤ 1. Heating of a solution of the metal oleates in oleic acid/octadecene in the presence of NH4F results in the formation of small (≈3 nm) particles as the first product. For x ≤ 0.2, these particles mainly consist of the hexagonal gagarinite phase whereas for x > 0.2 most particles crystallize in a cubic lattice resembling the structure of α-NaGdF4. Further heating at 320 °C leads to dissolution of the cubic phase and formation of larger particles of the hexagonal phase. Both the time required for complete dissolution as well as the final size of the
  particles systematically grows with increasing strontium content x, showing that high values of x decrease the number of hexagonal seeds formed. The lattice parameters of the hexagonal phase are found to increase linearly with x and become, for high values of x, similar to those of the hexagonal phase of NaCeF4, NaPrF4, and NaNdF4. Small particles of the cubic phase of NaGdSrF6 are shown to be suitable precursors to form a gagarinite shell on β-NaCeF4:25% Tb particles.
1 Introduction
Doped and undoped NaGdF4 nanocrystals are widely investigated owing to their interesting magnetic and optical properties. Applications of these nanocrystals have been proposed in the fields of magnetic resonance imaging (MRI),1–7 multimodal labeling and imaging,8–17 drug delivery,18–22 photovoltaics23–27 and security inks.28–30 Usually, the particles are prepared in the hexagonal phase, known as the β-NaGdF4 phase, which is the thermodynamically most stable phase of the bulk material at low temperatures. The exact crystal structure of the hexagonal phase of NaGdF4 (RE = rare earth) is a matter of a long-lasting debate and has been assigned to the space groups P63/m or P![[6 with combining macron]](https://www.rsc.org/images/entities/char_0036_0304.gif) .31 Recently, large single crystals of β-NaGdF4 could be successfully grown by the Czochralski method and the structures of these crystals have been shown to belong to P63/m.32 The structure of β-NaGdF4 is therefore directly related to the structure of the naturally occurring mineral Gagarinite, NaCaYF6,33 which crystallizes in the same space group.34–39 In fact, if one half of the Ca2+ ions in gagarinite is replaced by sodium ions and the other half by Y3+ ions, the hexagonal phase of NaYF4 is obtained which can also be written as Na(Na0.5Y0.5)YF6 or Na1.5Y1.5F6. Partial replacement is also possible leading to compositions given by
.31 Recently, large single crystals of β-NaGdF4 could be successfully grown by the Czochralski method and the structures of these crystals have been shown to belong to P63/m.32 The structure of β-NaGdF4 is therefore directly related to the structure of the naturally occurring mineral Gagarinite, NaCaYF6,33 which crystallizes in the same space group.34–39 In fact, if one half of the Ca2+ ions in gagarinite is replaced by sodium ions and the other half by Y3+ ions, the hexagonal phase of NaYF4 is obtained which can also be written as Na(Na0.5Y0.5)YF6 or Na1.5Y1.5F6. Partial replacement is also possible leading to compositions given by  , where x, the degree of substitution, ranges from x = 0 for β-NaYF4 to x = 1 for gagarinite. The doping of NaREF4 nanocrystals with Ca2+ ions has in fact already been investigated by several groups, in most cases however, without reference to the gagarinite structure.40–57 Successful incorporation of Sr2+ ions in the lattice of β-NaREF4 nanocrystals has also been reported, but only with comparatively low amounts of Sr2+ (x ≤ 0.33).41,58,59
The cubic high temperature phase of (bulk) NaYF4, known as α-NaYF4, crystallizes in the space group Fm3m. The structure is easily derived from the structure of CaF2 by randomly substituting half of the Ca2+ ions by Na+ ions and the other half by Y3+ ions.60 Partial substitution of the calcium ions therefore results in compositions given by Na1−xCa2xGd1−xF4 where 0 ≤ x ≤ 1. Since the latter compositions may alternatively be written as  with 0 ≤ x ≤ 3, the hexagonal and the cubic phase can be described with the same chemical formula. When large single crystals of CaF2 are doped with RE3+ ions, high dopant concentration of up to 40% RE3+ can be achieved although co-doping with Na+ ions is often omitted.61 In this case, charge compensation is provided by additional fluoride ions, yielding compositions given by Ca1−xRExF2+x. The crystal structure of such rare earth doped CaF2 and SrF2 crystals has been thoroughly investigated, because single crystals of the materials represent an important class of solid state laser materials.62 It has been shown that the rare earth ions form clusters in the crystal lattice and that cluster formation strongly affects the optical properties of the laser crystals.63 The cubic phase of NaYF4, on the other hand, is known to form solid solutions with varying compositions and is therefore better given by α-Na1−zYF4−z. According to the phase diagram of the NaF-YF3 bulk system, z ranges from 0 to 4/9.64,65
The two phases of NaREF4 also play an important role in the synthesis of β-NaREF4 particles with narrow size distribution. In the synthesis of β-NaYF4 nanocrystal, for instance, it is generally observed that a large number of small particles of the metastable cubic phase (α-NaYF4) are formed as the first product at early stages of the synthesis. In addition, a much smaller number of particles of the hexagonal phase (β-NaYF4) nucleate, either together with the α-NaYF4 particles or during further heating. In the following stages of the synthesis taking place at high temperature, the α-NaYF4 particles dissolve and the material released is consumed by the β-NaYF4 particles which grow in size. This transfer of material from the α-NaYF4 to the β-NaYF4 particles shows that the metastable cubic phase must have a higher solubility in oleic acid/octadecene solution than the hexagonal phase. The narrow size distribution of the final β-NaYF4 particles indicates that their growth took place under the condition of monomer supersaturation. The α-NaYF4 particles are the origin of the monomer supersaturation, as β-NaYF4 particles grown in the absence of α-NaYF4 particles form a broad size distribution.66 Obviously, the large number of better soluble α-NaYF4 particles generates a monomer concentration so high that the less soluble β-NaYF4 particles grow with focusing of their size distribution.67,68 In a similar way, β-NaGdF4 and other β-NaREF4 particles with narrow size distribution can be prepared by using particles of the cubic phase as precursor.
In the work presented here we studied the synthesis of  particles, also starting from small
  particles as precursor. Different compositions x were investigated including the highest value x = 1 which corresponds to the gagarinite structure, and we found the strontium amount x to have a central role in the nucleation and growth of the nanoparticles. While high strontium concentrations prohibit the direct formation of pure β-phase NaSrGdF6 (x = 1), a composition close to the gagarinite structure (x = 0.979) was achieved by a core/shell approach. Additionally,
  particles were found to be a suitable precursor material to form a shell of gagarinite on β-NaREF4 core particles of the lighter lanthanides such as Tb3+ doped β-NaCeF4 nanoparticles.
2 Experimental
2.1 Chemicals and materials
Purified oleic acid (90%, Fisher), 1-octadecene (90%, Alfa Aesar), sodium oleate (82%, Sigma Aldrich), strontium acetate (99%, Sigma Aldrich) and ammonium fluoride (98%, Alfa Aesar) were used as received. Gd2O3 (99.9%, Intematix) was used to prepare anhydrous gadolinium acetate by the procedure described previously for other rare earth acetates.692.2 Synthesis of  nanocrystals
20 ml of oleic acid (OA) and 20 ml of 1-octadecene (ODE) were combined in a 100 ml three-neck round bottom flask and connected to a reflux condenser, heating mantle and temperature controller. At room temperature, 4x mmol strontium acetate (0.2 ≤ x ≤ 1), 6–2x mmol anhydrous gadolinium acetate and 14–2x mmol sodium acetate were added to the OA/ODE solvent. The stirred mixture was heated to 100 °C under vacuum and left at this temperature for one hour. The apparatus was refilled with nitrogen and the clear solution heated to 300 °C. Heating was stopped after 60 minutes and the mixture was allowed to cool to 100 °C. To remove the acetic acid released during the heating step at 300 °C, vacuum was applied again and the solution degassed for 30 minutes at 100 °C. Thereafter, 1.185 g (32 mmol) of dry NH4F powder were added at 100 °C under nitrogen counter flow. To remove air, the vessel was subjected three times to a short vacuum (5–10 s) and refilled with nitrogen. The stirred mixture was then heated to 200 °C. After 45 minutes at 200 °C, the temperature was raised to 320 °C and the solution kept at this temperature for different times ranging from 5 minutes to 12 hours. From time to time, 5 ml samples were drawn at 320 °C with a syringe. The samples were immediately quenched in twice the volume of ethanol, resulting in precipitation of the particles. After centrifugation, the precipitate was re-suspended in 15 ml of hexane and again centrifuged to separate the hexane solution containing the particles from the NaF byproduct. The particles were again precipitated with 30 ml of ethanol, separated by centrifugation and dried over night in air.
2.3 Synthesis of NaCeF4:Tb nanocrystals
NaCeF4:Tb nanocrystals were prepared by following a literature procedure for NaCeF4.70 In brief, 3 mmol of cerium oleate, 1 mmol of terbium oleate, and 10 mmol of sodium oleate in a 100 ml three-neck round bottom flask were combined with 10 ml of oleic acid, 10 ml of oleyl amine, and 20 ml of 1-octadecene (ODE). The metal oleates were dissolved and the solvent degassed by stirring the mixture at 100 °C for one hour under vacuum. After switching to nitrogen atmosphere, 815 mg (22 mmol) of dry NH4F powder were added at 100 °C. To remove air, the flask was subjected three times to a short vacuum (5–10 s) and refilled with nitrogen. The stirred mixture was then heated for 60 minutes at 290 °C. After cooling to room temperature, the nanocrystals were precipitated by adding 50 ml of ethanol and purified as described above for the nanocrystals.
2.4 Synthesis of core/shell nanocrystals with a shell of Gd, Sr-gagarinite (NaSrGdF6)
For the synthesis of core/shell particles, 20 ml of oleic acid (OA) and 20 ml of 1-octadecene (ODE) were added to 4 mmol of strontium acetate, 4 mmol of anhydrous gadolinium acetate and 12 mmol of sodium acetate in a 100 ml three-neck round bottom flask. The mixture was first degassed for one hour by heating at 100 °C under vacuum, thereafter refilled with nitrogen and heated at 300 °C for 90 minutes. After cooling to 100 °C vacuum was applied again and the solution degassed for 30 minutes at 100 °C to remove the acetic acid released at 300 °C. Thereafter, the apparatus was again switched to nitrogen atmosphere and either 0.57 mmol of particles or 0.86 mmol of NaCeF4:Tb particles were added at 100 °C together with 0.889 g (24 mmol) of dry NH4F powder. To remove air, the vessel was subjected three times to a short vacuum (5–10 s) and refilled with nitrogen. The stirred mixture was then heated to 200 °C under nitrogen atmosphere. After 45 minutes at 200 °C, the temperature was raised to 320 °C and the solution heated at this temperature for 45 minutes. After cooling to room temperature, the core/shell nanocrystals were precipitated by adding 50 ml of ethanol and purified as described above for the
  nanocrystals.
2.5 Particle characterization
For transmission electron microscopy, a JEOL JEM 2100 TEM was used. The TEM was operated at 200 kV and equipped with a LaB6 cathode. Particle size histograms were derived from TEM images using the software Pebbles. X-ray powder diffraction (XRD) data were recorded with a Panalytical Empyrean diffractometer using Bragg–Brentano geometry, Cu K-α radiation and a step size of 0.039° 2θ. Profex and Fullprof software were used for Rietveld analysis of the XRD data and to determine the phase composition, respectively. The atomic composition of the nanoparticles was analysed with an Axios X-ray fluorescence spectrometer (Panalytical). Luminescence spectra of nanoparticle powders were measured with a Fluorolog-3 spectrofluorometer (Horiba).3 Results and discussion
 nanocrystals were prepared at temperatures above 200 °C by the reaction of solid ammonium fluoride with a solution of sodium oletate, gadolinium oleate, strontium oletate in oleic acid/1-octadecene:
 | (1) |
Different molar ratios of strontium to gadolinium and sodium were employed in the synthesis and the NaF byproduct was removed during work-up (see Experimental section for details). X-ray powder diffraction shows that particles of the hexagonal phase (β-phase) of  are formed at 200 °C for values of x ≤ 0.25. These particles have a very small size of only 2–3 nm. For x ≥ 0.25, the samples heated at 200 °C consist predominantly of very small particles of the cubic phase (α-phase)
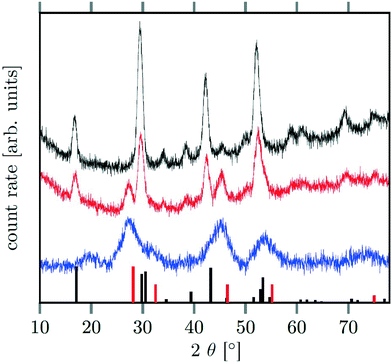
  (Fig. 1).
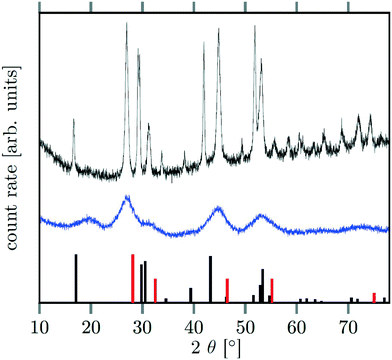
When the temperature is increased to 320 °C, the particles of the cubic phase dissolve and larger particles of the hexagonal phase are formed. The XRD data in Fig. 1 and 2 also show that the dissolution time strongly depends on x, i.e., the amount of strontium in the synthesis: when only small amounts of strontium are used (x = 0.5), complete conversion to the hexagonal phase is observed already after 6 minutes at 320 °C. For x = 1, on the contrary, 60% of the particles remained in the cubic phase even after 12 hours of heating at 320 °C. In fact, complete conversion to the α-phase was only observed for 0 ≤ x < 0.8.
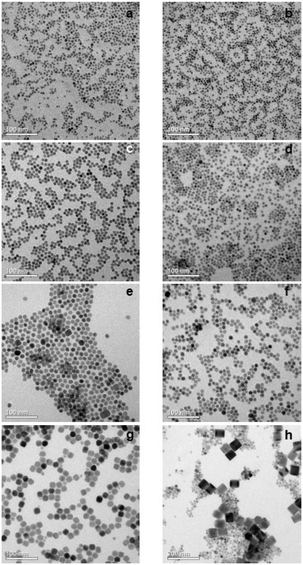
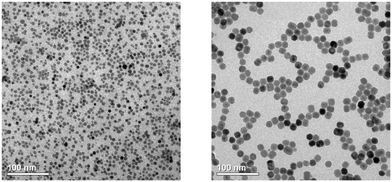
TEM images and particle size histograms of the resulting particles are shown in Fig. 3 and S1,† respectively. The figures show that narrow, monomodal size distributions are obtained for 0 ≤ x ≤ 0.75 and bimodal size distributions for x = 0.8 and x = 1. For x = 1, the TEM image and the size histogram display a large number of small particles. These particles consist of the cubic phase, as confirmed by the XRD data of the sample (Fig. 2) showing that the peaks of the cubic phase are broader than those of the hexagonal phase. For x = 0.8 the number of small particles is very low and the sample mainly consists of larger particles of the hexagonal phase. The mean size of the particles of the hexagonal phase is 57 nm for x = 1, 23 nm for x = 0.8 and between 7 nm and 14 nm for x ≤ 0.75. In all cases, the particles of the hexagonal phase display narrow size distributions, indicating that the particles have grown under the condition of monomer supersaturation.
The observation that the α-phase particles dissolve whereas the β-phase particles grow in size, in fact indicates that the solubility of the α-phase is higher. In mixtures containing a large number of α-phase particles but a small number of β-phase particles, the high solubility of the α-phase particles can therefore be expected to produce a higher monomer concentration in solution than the β-phase particles would do in the absence of α-phase particles. The β-phase particles in the mixture therefor grow under monomer supersaturation, causing their narrow size distribution.
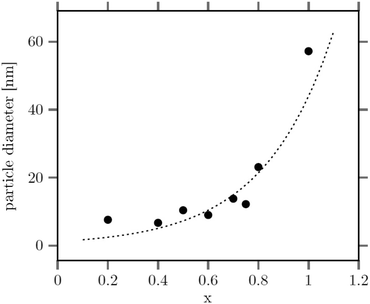
The large mean size of the hexagonal particles for x ≥ 0.8 already shows that a high strontium content decreases the number of β-phase seeds nucleating in solution. In Fig. 4 the observed final particle size is plotted against the strontium content used in the synthesis. The figure shows that the size increases systematically with the strontium content given by the degree of substitution x. Obviously, the strontium ions suppress the nucleation of β-phase seeds and favor the formation of the cubic phase. This is not unexpected, since the cubic phase of bulk SrF2 is the thermodynamically most stable phase at low temperature whereas the cubic phase of bulk NaGdF4 is only metastable. Wang et al. in fact observed that doping of α-NaYF4:Eu particles with Sr reduces their mean particle size, indicating that the strontium ions facilitate the nucleation of α-phase seeds. In our samples, the decrease of the number of the β-phase seeds not only results in larger sizes of the final particles but also in a strong increase of the time required to convert all particles to the hexagonal phase. This is shown in Fig. 5 where the time required to dissolve the α-phase particles is plotted against the strontium content x. The strong increase of the conversion time is probably not only caused by the decreasing number of β-phase seeds but also by a lower solubility of the α-phase particles with increasing strontium content. For any given strontium content x, however, the α-phase particles must be significantly better soluble than the corresponding β-phase particles with the same strontium content, because narrow size distributions are observed for all β-phase particles, independent of x (Fig. 3).
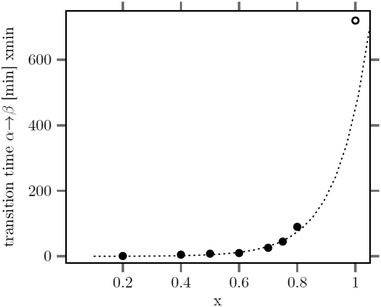 | ||
| Fig. 5 Time of heating at 320 °C required to dissolve all particles of the cubic phase versus their strontium content x. For x = 1, even 720 min at 320 °C are not sufficient for complete dissolution. | ||
The strontium content x of the data points used in Fig. 4 and 5 were calculated from ratio of strontium to acetate (Sr/Gd) employed in the synthesis. From the chemical formula  it follows that this molar ratio is connected to the value of x by x = 3(Sr/Gd)/[2 + (Sr/Gd)]. To compare these values with the actual composition of the final particles, the sodium, strontium and gadolinium content of the particles was determined by X-ray fluorescence analysis (XRA). Fig. 6 displays the measured molar ratios of strontium to gadolinium, given as x values, as well as the molar ratios of sodium to gadolinium. The figure shows that the x values calculated from the XRA data agree well with those derived from the ratio of strontium to gadolinium employed in the synthesis. The ratio of sodium to gadolinium shows some scattering but is close to one in all samples, independent of the amount of strontium used. The first result proves that the strontium is completely incorporated into the particles whereas the second result shows that the different charge of the Sr2+ ions is compensated in our case by replacing sodium and gadolinium ions in the crystal lattice in equal numbers. This is expected from the compositions discussed in our introduction but in contradiction to results reported by others where charge compensation by fluoride ions was observed. A possible explanation for this discrepancy could be the different concentrations of fluoride ions used in the two experimental procedures or the different alkaline earth and rare earth sources.
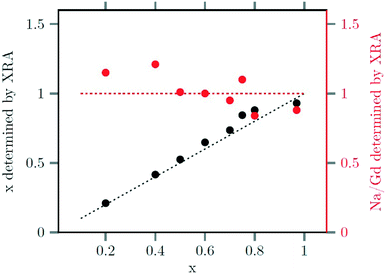 | ||
| Fig. 6 Strontium content x (black) and sodium/gadolinium ratio (red) of the final nanoparticles, as determined by XRF, plotted against the strontium content x used to the synthesis. | ||
The successful incorporation of the Sr2+ ions can also be verified by Rietveld analysis of the X-ray powder diffraction data, since the radius of Sr2+ ions (132 pm) is larger than the radius of sodium ions (116 pm) and the radius of Gd3+ ions (108 pm). This is in contrast to the analogue Ca, Gd-gagarinite, where the ionic radius of Ca2+ (114 pm) is very close to the average of the ionic radii of Na+ and Gd3+ (112 pm), i.e., the ions partially substituted by Ca2+. The larger radius of Sr2+ results in an increase of the unit cell shifting the reflex positions to smaller 2θ values. In Fig. 7, the lattice parameters a and c of the hexagonal unit cell are plotted against the Sr2+ content of the nanocrystals, given by the degree of substitution x. A linear dependence is observed up to x ≤ 0.8 in accord with Vegard's law stating that the lattice parameters of a solid solution A1−xBx vary linearly with x in first approximation. For x = 1, however, the increase of the lattice parameters is lower than expected. Note, that in this case complete dissolution of the cubic α-phase could not be achieved even after 12 hours of heating at 320 °C (Fig. 2). Moreover, the large particle sizes observed for x ≥ 0.8 show that only a small number of seeds nucleate in this case. To increase the number of seeds available during the conversion, we heated the 3 nm α-NaGdSrF6 particles (i.e., particles with x = 1) in the presence of 10 nm β-Na1.125Sr0.75Gd1.125F6 particles (i.e., x = 0.75) as additional seeds.
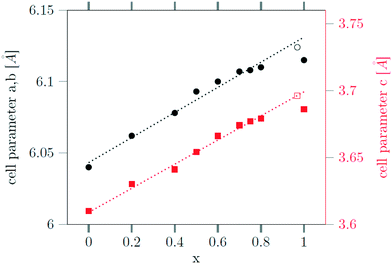 | ||
Fig. 7 Dependence of the lattice constants a (black) and c (red) of the hexagonal gagarinite phase on the strontium content x of the  nanoparticles. nanoparticles. | ||
Seeds with x = 0.75 were chosen because this value of x corresponds to the most strontium rich composition for which complete conversion to the β-phase was achieved. Since we combined the α-NaSrGdF6 particles and the β-Na1.125Sr0.75Gd1.125F6 seeds in molar ratio of 7 to 1, the nominal composition of the β-phase particles produced in this core/shell type synthesis is expected to be x = 0.97  . The XRD data of samples drawn at different reaction times (Fig. 8) show that this method results in a high degree of conversion to the β-phase. Rietveld analysis of the XRD data shows that heating at 320 °C for 90 minutes, 200 minutes and 720 minutes alters the phase composition from the initial molar ratio of 7 to 1 to a molar ratio of 0.19 to 1, 0.12 to 1, and 0.05 to 1, respectively. Thus, 200 minutes of heating at 320 °C dissolves already more than 98% of the initial amount of α-phase material. The degree of conversion to the β-phase is therefore significantly higher than in the absence of seed particles where 12 hours of heating at 320 °C dissolves only 40% of the α-phase material (Fig. 2). Since the remaining α-phase particles are significantly smaller than the β-phase particles, however, the number of α-phase particles is still comparatively high and the resulting size distribution is again clearly bimodal as shown by the TEM image and the particle size histogram in Fig. S3 and S5.† The phase compositions derived from the histograms, however, are in accord with the Rietveld analysis, when the different volumes of the particles are taken into account (Fig. S3†). The Rietveld analysis furthermore shows that the unit cell parameters of the hexagonal phase produced in this core/shell type experiment are the largest of all β-phase materials prepared in this work (Fig. 7, open symbol). This indicates that the
  particles contain, on average, a high amount of strontium in the crystal lattice, probably close to the expected composition of x = 0.97. Fig. 7 shows that the large unit cell parameters of these particles are in fact much better in accord with the linear dependence of the unit cell parameters observed for lower values of x. The figure also shows that the unit cell parameters of these particles are significantly larger than those of the 40 nm particles prepared in the absence of seed particles. Obviously, the 40 nm particles contain less Sr2+ than the particles prepared by the core/shell type synthesis, i.e., they are partially depleted of Sr2+. The Sr2+ not contained in the 40 nm particles must therefore be part of the cubic phase which did not dissolve despite 12 hours of heating at 320 °C. Such enrichment of Sr2+ in the cubic phase is in fact possible, as the cubic phase can contain significantly more Sr2+ than the hexagonal phase. This follows from the different compositional ranges of the two phases: as already mentioned in the introduction, both phases are given by
  , but for the cubic phase 0 ≤ x ≤ 3 whereas for the hexagonal 0 ≤ x ≤ 1. Thus, if α-phase particles with x = 1 are heated at 320 °C with the aim to prepare (Sr, Gd)-gagarinite particles with x = 1, a mixture may form which consists of hexagonal phase
  particles with x ≤ 1 and cubic phase
  particles with x ≥ 1. The slow conversion observed for x = 1 probably indicates that the solubility of
  particles with a high strontium content of x ≥ 1 is very low.
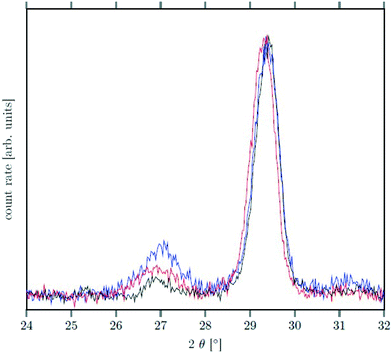 | ||
| Fig. 8 XRD data of NaSrGdF6@β-Na1.125Sr0.75Gd1.125F6 core/shell particles after heating at 320 °C for 90 min (black), 200 min (red) and 720 min (blue). The peak at ≈27° belonging to the α-phase is much less intense than the signal of the β-phase at ≈29.5° (compare also with Fig. 2). | ||
The lattice parameters of the β-phase particles with the highest strontium content are a = 6.124 Å and c = 3.696 Å. These values are very similar to the unit cell parameters of β-NaLaF4 (a = 6.18 Å, c = 3.83 Å), β-NaCeF4 (a = 6.153 Å, c = 3.785 Å), β-NaPrF4 (a = 6.13 Å, c = 3.75 Å), and β-NaNdF4 (a = 6.109 Å, c = 3.716 Å). This indicates that the 3 nm α-NaSrGdF6 particles might be a suitable shell precursor for β-NaREF4 core particles of the lighter lanthanides, provided that the β-NaREF4 core particles have sufficiently low solubility to obtain narrow size distribution. This is interesting, because the cubic phase of NaLaF4 decomposes to LaF3 upon heating in oleic acid/octadecene.70 Small α-NaLaF4 particles can therefore not be used as shell precursor, although β-NaLaF4 would be the most straightforward choice of shell material for core particles composed of β-NaCeF4, β-NaPrF4, β-NaNdF4 or NaLaF4:RE. In the next step, we therefore studied the use our 3 nm α-NaSrGdF6 particles as precursor to grow a shell on 8 nm β-NaCeF4: 25% Tb core particles. Again, the shell precursor and the core particles were combined in a molar ratio of 7 to 1. The TEM images in Fig. 9 show particles with a rather narrow size distribution and a size that has increased from 8 nm to 18 nm, i.e., approximately by the expected factor of two.
We observe that the β-NaCeF4: 25% Tb core particles consume the monomer released by the shell precursor much faster than the β-Na1.125Sr0.75Gd1.125F6 seeds: already after 45 minutes all α-NaSrGdF6 particles have dissolved compared to >200 min required to dissolve >98% of these particles in the second case. This is also in accord with the narrower size distribution of the resulting NaCeF4: 25% Tb@NaSrGdF6 core/shell particles (Fig. S4†). As expected for a core/shell structure, the resulting NaCeF4: 25% Tb@NaSrGdF6 particles consist only of the hexagonal phase and display improved luminescence properties compared to the NaCeF4: 25% Tb coreparticles.
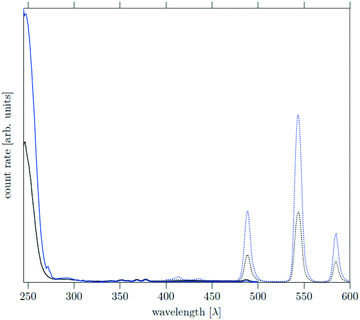
The core as well as the core/shell particles display a strong absorption band in the UV region due to the optically allowed 4f–5d transitions of cerium. Similar to other Ce, Tb co-doped materials, excitation of the cerium ions at 246 nm results in energy transfer from cerium to terbium accompanied by strong quenching of the Ce3+ emission between 400 nm and 450 nm. Relaxation of the excited terbium ions leads to strong emission bands at 490 nm, 545 nm and 585 nm which correspond to the 5D4–7FJ transitions (J = 4, 5, 6) of Tb3+. The emission spectra in Fig. 10 show that the core and core/shell particles display the same emission bands, but the emission of the core/shell particles is approximately 2.5 times more intense. This shows that the shell reduces energy transfer to and quenching of the luminescence at the particle surface.
As expected, the increase is less pronounced than in the case of NIR emitting dopants, since the UV-vis transitions of Ce3+ and Tb3+ are less easily quenched via vibrational modes of the surface ligands than the NIR transitions of lanthanide ions like Yb, Er, Tm or Ho.
4 Conclusions
In conclusion, we studied the formation and the growth of nanocrystals for 0 ≤ x ≤ 1. All particles were prepared by the reaction of ammonium fluoride with a solution of the metal oleates in oleic acid/octadecene. For x ≤ 0.2, the reaction yields small (≈3 nm) particles of the hexagonal phase
  already at 200 °C, whereas for larger values of x mainly small particles of the cubic phase
  are formed. In these cases, further heating at 320 °C dissolves the particles of the cubic phase and form larger particles of the hexagonal gagarinite phase. The final size of the
  particles as well as the time required for the conversion to the hexagonal phase strongly increases with increasing strontium content x, indicating that the presence of strontium hampers the formation of β-phase seeds. Full conversion is only observed for
  particles with x ≤ 0.75. Particles with x > 0.75 can be prepared, however, via a core/shell type synthesis method: heating of
  particles with x = 0.75 together with a large amount of small α-NaGdSrF6 particles (x = 1) at 320 °C results in almost complete dissolution of the α-phase particles and the growth of large
  particles with an average x-value close to one. The substitution of Na+ and Gd3+ ions by Sr2+ ions increases the lattice parameters of the hexagonal phase. We observe a nearly linear increase of the lattice parameters of
  with x. For high values of x, the lattice parameters are similar to those of the hexagonal NaREF4 phase of the lighter lanthanides (RE = Ce, Pr, Nd) and we could show that small α-NaGdSrF6 particles (x = 1) can in fact be used as precursor to form a gagarinite shell on Tb3+ doped β-NaCeF4 particles.
Conflicts of interest
There are no conflicts to declare.Acknowledgements
The authors thank Henning Eickmeier for TEM images and Marianne Gather for XRF measurements.References
- F. Chen, W. Bu, S. Zhang, J. Liu, W. Fan, L. Zhou, W. Peng and J. Shi, Adv. Funct. Mater., 2013, 23, 298–307 CrossRef CAS.
- Y. Deng, H. Wang, W. Gu, S. Li, N. Xiao, C. Shao, Q. Xu and L. Ye, J. Mater. Chem. B, 2014, 2, 1521–1529 RSC.
- H. Guo, Z. Li, H. Qian, Y. Hu and I. N. Muhammad, Nanotechnology, 2010, 21, 125602 CrossRef.
- Y. Hou, R. Qiao, F. Fang, X. Wang, C. Dong, K. Liu, C. Liu, Z. Liu, H. Lei, F. Wang and M. Gao, ACS Nano, 2013, 7, 330–338 CrossRef CAS.
- N. J. J. Johnson, W. Oakden, G. J. Stanisz, R. S. Prosser and F. C. J. M. van Veggel, Chem. Mater., 2011, 23, 3714–3722 CrossRef CAS.
- R. Naccache, P. Chevallier, J. Lagueux, Y. Gossuin, S. Laurent, L. Vander Elst, C. Chilian, J. A. Capobianco and M.-A. Fortin, Adv. Healthcare Mater., 2013, 2, 1478–1488 CrossRef CAS.
- H. Xing, S. Zhang, W. Bu, X. Zheng, L. Wang, Q. Xiao, D. Ni, J. Zhang, L. Zhou, W. Peng, K. Zhao, Y. Hua and J. Shi, Adv. Mater., 2014, 26, 3867–3872 CrossRef CAS.
- G. Chen, T. Y. Ohulchanskyy, S. Liu, W.-C. Law, F. Wu, M. T. Swihart, H. Agren and P. N. Prasad, ACS Nano, 2012, 6, 2969–2977 CrossRef CAS.
- H. Groult, J. Ruiz-Cabello, J. Pellico, A. V. Lechuga-Vieco, R. Bhavesh, M. Zamai, E. Almarza, I. Martin-Padura, E. Cantelar, M. P. Martinez-Alcazar and F. Herranz, Bioconjugate Chem., 2015, 26, 153–160 CrossRef CAS.
- F. Li, C. Li, X. Liu, Y. Chen, T. Bai, L. Wang, Z. Shi and S. Feng, Chem. – Eur. J., 2012, 18, 11641–11646 CrossRef CAS.
- C. Liu, Z. Gao, J. Zeng, Y. Hou, F. Fang, Y. Li, R. Qiao, L. Shen, H. Lei, W. Yang and M. Gao, ACS Nano, 2013, 7, 7227–7240 CrossRef CAS.
- C. Liu, Y. Hou and M. Gao, Adv. Mater., 2014, 26, 6922–6932 CrossRef CAS.
- C. Liu, W. Ma, Z. Gao, J. Huang, Y. Hou, C. Xu, W. Yang and M. Gao, J. Mater. Chem. C, 2014, 2, 9637–9642 RSC.
- J. Ryu, H.-Y. Park, K. Kim, H. Kim, J. H. Yoo, M. Kang, K. Im, R. Grailhe and R. Song, J. Phys. Chem. C, 2010, 114, 21077–21082 CrossRef CAS.
- D. Vennerberg and Z. Lin, Sci. Adv. Mater., 2011, 3, 26–40 CrossRef.
- F. Wang, D. Banerjee, Y. Liu, X. Chen and X. Liu, Analyst, 2010, 135, 1839–1854 RSC.
- J. Zhou, N. Shirahata, H.-T. Sun, B. Ghosh, M. Ogawara, Y. Teng, S. Zhou, R. G. S. Chu, M. Fujii and J. Qiu, J. Phys. Chem. Lett., 2013, 4, 402–408 CrossRef CAS.
- Y. Dai, H. Xiao, J. Liu, Q. Yuan, P. Ma, D. Yang, C. Li, Z. Cheng, Z. Hou, P. Yang and J. Lin, J. Am. Chem. Soc., 2013, 135, 18920–18929 CrossRef CAS.
- L. Wang, J. Liu, Y. Dai, Q. Yang, Y. Zhang, P. Yang, Z. Cheng, H. Lian, C. Li, Z. Hou, P. Ma and J. Lin, Langmuir, 2014, 30, 13042–13051 CrossRef CAS.
- X. Wang, K. Liu, G. Yang, L. Cheng, L. He, Y. Liu, Y. Li, L. Guo and Z. Liu, Nanoscale, 2014, 6, 9198–9205 RSC.
- M. Yin, E. Ju, Z. Chen, Z. Li, J. Ren and X. Qu, Chem. – Eur. J., 2014, 20, 14012–14017 CrossRef CAS.
- K. Zarschler, L. Rocks, N. Licciardello, L. Boselli, E. Polo, K. P. Garcia, L. De Cola, H. Stephan and K. A. Dawson, Nanomedicine, 2016, 12, 1663–1701 CrossRef CAS.
- S. E. Lohse and C. J. Murphy, J. Am. Chem. Soc., 2012, 134, 15607–15620 CrossRef CAS.
- J. Shen, Z. Li, R. Cheng, Q. Luo, Y. Luo, Y. Chen, X. Chen, Z. Sun and S. Huang, ACS Appl. Mater. Interfaces, 2014, 6, 17454–17462 CrossRef CAS.
- B. M. van der Ende, L. Aarts and A. Meijerink, Phys. Chem. Chem. Phys., 2009, 11, 11081–11095 RSC.
- C. Yuan, G. Chen, L. Li, J. A. Damasco, Z. Ning, H. Xing, T. Zhang, L. Sun, H. Zeng, A. N. Cartwright, P. N. Prasad and H. Agren, ACS Appl. Mater. Interfaces, 2014, 6, 18018–18025 CrossRef CAS.
- K. Wang, J. Jiang, S. Wan and J. Zhai, Electrochim. Acta, 2015, 155, 357–363 CrossRef CAS.
- W. J. Kim, M. Nyk and P. N. Prasad, Nanotechnology, 2009, 20, 185301 CrossRef.
- Y. Lu, J. Zhao, R. Zhang, Y. Liu, D. Liu, E. M. Goldys, X. Yang, P. Xi, A. Sunna, J. Lu, Y. Shi, R. C. Leif, Y. Huo, J. Shen, J. A. Piper, J. P. Robinson and D. Jin, Nat. Photonics, 2013, 8, 32–36 CrossRef.
- J. M. Meruga, A. Baride, W. Cross, J. J. Kellar and P. S. May, J. Mater. Chem. C, 2014, 2, 2221–2227 RSC.
- K. W. Krämer, D. Biner, G. Frei, H. U. Güdel, M. P. Hehlen and S. R. Lüthi, Chem. Mater., 2004, 16, 1244–1251 CrossRef.
- M. M. Lage, R. L. Moreira, F. M. Matinaga and J.-Y. Gesland, Chem. Mater., 2005, 17, 4523–4529 CrossRef CAS.
- B. P. Sobolev, D. A. Mineev and V. P. Pashutin, Dokl. Akad. Nauk SSSR, 1963, 150, 791–794 CAS.
- A. Grzechnik, P. Bouvier, M. Mezouar, M. D. Mathews, A. K. Tyagi and J. Köhler, J. Solid State Chem., 2002, 165, 159–164 CrossRef CAS.
- J. H. Burns, Inorg. Chem., 1965, 4, 881–885 CrossRef CAS.
- O. V. Frank-Kamenetskaya, Crystallogr. Rep., 1994, 39, 923–928 Search PubMed.
- S. S. Perera, D. K. Amarasinghe, K. T. Dissanayake and F. A. Rabuffetti, Chem. Mater., 2017, 29, 6289–6297 CrossRef CAS.
- M. J. Sciberras, P. Leverett, P. A. Williams, D. E. Hibbs, A. C. Roberts and J. D. Grice, Can. Mineral., 2011, 49, 1111–1114 CrossRef CAS.
- A. A. Voronkov, Zhurnal Struktumoi Khlmii, 1962, 3, 691–696 CAS.
- X. Chen, D. Peng and F. Wang, Nanomaterials, 2013, 3, 583–591 CrossRef CAS.
- L. Lei, D. Chen, P. Huang, J. Xu, R. Zhang and Y. Wang, Nanoscale, 2013, 5, 11298–11305 RSC.
- S. Zhao, W. Liu, X. Xue, Y. Yang, Z. Zhao, Y. Wang and B. Zhou, RSC Adv., 2016, 6, 81542–81551 RSC.
- P. F. Zuo, S. L. Zhao, D. D. Song, B. Qiao, Z. Xu, J. J. Zhang, Q. X. Wu, P. J. Song and D. Gao, J. Nanosci. Nanotechnol., 2018, 18, 7584–7589 CrossRef CAS.
- J. Y. Dai, C. Yang, H. Zhang, G. Y. Feng and S. H. Zhou, RSC Adv., 2017, 7, 48238–48244 RSC.
- L. Lei, D. Q. Chen, J. Xu, R. Zhang and Y. S. Wang, Chem. – Asian J., 2014, 9, 728–733 CrossRef CAS.
- L. Lei, J. A. Xia, Y. Cheng, Y. S. Wang, G. X. Bai, H. Xia and S. Q. Xu, J. Mater. Chem. C, 2018, 6, 11587–11592 RSC.
- X. W. Liu, Z. G. Yi, X. Qin, H. Liu, W. Huang and X. G. Liu, Adv. Opt. Mater., 2019, 7, 6 Search PubMed.
- Q. Q. Shao, H. Zhang, J. Y. Dai, C. Yang, X. X. Chen, G. Y. Feng and S. H. Zhou, CrystEngComm, 2019, 21, 741–748 RSC.
- X. F. Wang, Y. Wang, J. H. Yu, Y. Y. Bu and X. H. Yan, Opt. Express, 2018, 26, 21950–21959 CrossRef CAS.
- Z. M. Xiong, Y. S. Yang and Y. F. Wang, RSC Adv., 2016, 6, 75664–75668 RSC.
- A. H. Zhou, F. Song, Y. D. Han, F. F. Song, D. D. Ju and X. Q. Wang, CrystEngComm, 2018, 20, 2029–2035 RSC.
- Y. Zhang, Z. Yu, J. Li, Y. Ao, J. Xue, Z. Zeng, X. Yang and T. T. Tan, ACS Nano, 2017, 11, 2846–2857 CrossRef CAS.
- Y. E. Serge Correales, C. Hazra, S. Ullah, L. R. Lima and S. J. L. Ribeiro, Nanoscale Adv., 2019, 1, 1936–1947 RSC.
- M. M. A. Abualrejal, K. Eid, R. Tian, L. Liu, H. Chen, A. M. Abdullah and Z. Wang, Chem. Sci., 2019, 10, 7591–7599 RSC.
- J. E. Choi, D. Kim and H. S. Jang, Chem. Commun., 2019, 55, 2261–2264 RSC.
- H. Tang, H. Zhou and X. Cheng, J. Lumin., 2020, 221, 117086 CrossRef CAS.
- J. X. Zhao, X. Chen, B. Chen, X. Luo, T. Y. Sun, W. W. Zhang, C. J. Wang, J. Lin, D. Su, S. Qiao and F. Wang, Adv. Funct. Mater., 2019, 29, 1903295 CrossRef CAS.
- Z. Huang, Y. Yang, L. Gong, M. Ma and C. Xu, Chem. Eng. J., 2016, 286, 602–609 CrossRef CAS.
- G. F. Wang and Q. Peng, J. Solid State Chem., 2011, 184, 59–63 CrossRef CAS.
- F. Hund, Z. Anorg. Chem., 1950, 261, 106–115 CrossRef CAS.
- M. Ito, C. Goutaudier, Y. Guyot, K. Lebbou, T. Fukuda and G. Boulon, J. Phys.: Condens. Matter, 2004, 16, 1501–1521 CrossRef CAS.
- M. Siebold, S. Bock, U. Schramm, B. Xu, J. L. Doualan, P. Camy and R. Moncorge, Appl. Phys. B: Lasers Opt., 2009, 97, 327–338 CrossRef CAS.
- P. J. Bendall, C. R. A. Catlow, J. Corish and P. W. M. Jacobs, J. Solid State Chem., 1984, 51, 159–169 CrossRef CAS.
- R. E. Thoma, Inorg. Chem., 1966, 5, 1222–1229 CrossRef CAS.
- P. P. Fedorov, Russ. J. Inorg. Chem., 1999, 44, 1703–1727 Search PubMed.
- T. Rinkel, J. Nordmann, A. N. Raj and M. Haase, Nanoscale, 2014, 6, 14523–14530 RSC.
- T. Rinkel, A. N. Raj, S. Dühnen and M. Haase, Am. Ethnol., 2016, 128, 1177–1181 Search PubMed.
- B. Voss and M. Haase, ACS Nano, 2013, 7, 11242–11254 CrossRef CAS.
- C. Homann, L. Krukewitt, F. Frenzel, B. Grauel, C. Wurth, U. Resch-Genger and M. Haase, Angew. Chem., Int. Ed., 2018, 57, 8765–8769 CrossRef CAS.
- A. Naduviledathu Raj, T. Rinkel and M. Haase, Chem. Mater., 2014, 26, 5689–5694 CrossRef CAS.
Footnote |
| † Electronic supplementary information (ESI) available. See DOI: 10.1039/d0ce01301c |
| This journal is © The Royal Society of Chemistry 2020 |

