 Open Access Article
Creative Commons Attribution 3.0 Unported Licence
Mutation of position 5 as a crystal engineering tool for a NIR-emitting DNA-stabilized Ag16 nanocluster†
Cecilia
Cerretani
 a,
Jiro
Kondo
 *b and
Tom
Vosch
 *a
*a
aDepartment of Chemistry, University of Copenhagen, Universitetsparken 5, Copenhagen 2100, Denmark. E-mail: tom@chem.ku.dk
bDepartment of Materials and Life Sciences, Sophia University, 7-1 Kioi-cho, Chiyoda-ku, 102-8554 Tokyo, Japan. E-mail: j.kondo@sophia.ac.jp
First published on 2nd November 2020
Abstract
Mutation of position 5 in a ten-base DNA sequence allowed us to probe its role in the photophysical and structural properties of a DNA-stabilized silver 16 nanocluster (DNA-Ag16NC). A comparison of the original T5 (thymine at position 5) compound with the new modifications: X5 (abasic site), C5 (cytosine), A5 (adenine) and G5 (guanine), was made. All mutants were able to create a similar Ag16NC as formed by the original T5, however diverse packing of the crystal asymmetric units in the crystalline state and minor differences in the spectroscopic properties were observed. We showed that certain nucleotides are essential for stabilizing the Ag16NC, while others are not critical and can be utilized for engineering the arrangement of the asymmetric units in the crystalline state. The latter opens up the possibility to extend the primary role of the DNA as a scaffold for encapsulating the AgNC to a secondary 3D crystal engineering tool.
Introduction
Despite their interesting fluorescence properties,1–7 only limited structural information is available for DNA-stabilized silver nanoclusters (DNA-AgNCs).8,9 DNA-AgNCs are usually composed of one or several DNA strands that encapsulate a precise number of silver atoms, ranging between 2 and 30.10–13 The spectroscopic properties of the DNA-AgNCs can be modified by changing the DNA nucleotide sequence. Screening of DNA sequences and machine-learning algorithms have assisted in recent years to discover a series of interesting DNA-AgNCs and started to unravel the intricate relationship of sequence versus the final photophysical properties of the encapsulated AgNC.14–17 We recently reported the crystal structure of a Ag16NC that can be stabilized by either two 5′-CACCTAGCGA-3′ strands (here referred to as T5)9 or two shortened versions without the terminal adenosine: 5′-CACCTAGCG-3′ (here referred to as T5–A10).18 An intriguing finding of these studies was that the thymine in position 5 is pointed outwards and does not interact with the Ag16NC. However, it seems to play a critical role in the crystallization process by facilitating interactions between neighboring DNA-Ag16NCs in the crystalline state. To investigate the role of the thymine in position 5 in more detail, we used DNA sequences where this thymine was exchanged with an adenine (A5), cytosine (C5), guanine (G5) and an abasic site (X5). The A5, X5, C5 formed similar near-infrared (NIR) emitting Ag16NCs, while the guanine mutant created two emitters that will be referred to as G5-NIR and G5-RED. Spectroscopic properties and structural information from single crystal X-ray diffraction were collected for A5, C5, X5 and G5-NIR. Structural and spectroscopic properties of the original T5 were published previously and used for comparison with the mutants here.9,19 To the best of our knowledge, this is the first time that site-specific mutation has been used to compare the effect on the spectroscopic and structural properties of a DNA-AgNC. The understanding gained here in this paper will hopefully allow us to modify the DNA sequences of other DNA-AgNCs in order to crystallize them and improve the structure/property relationship in this new class of emitters. We therefore identified nucleotides that are essential for stabilizing the AgNCs and others that promote crystal packing interactions.Results and discussion
Photophysical properties of the solution state
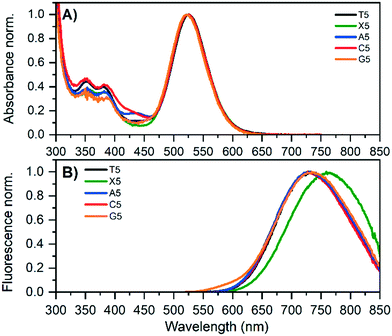
DNA-Ag16NCs using 5′-CACCRAGCGA-3′ (R = X, A, C, G) were synthesized (for details, see ESI†) and, after three days, HPLC-purified. HPLC chromatograms and details on the collected fractions can be found in Fig. S1–S4.†Fig. 1 shows the absorption and emission spectra of the original T5 and the four mutants; X5, A5, C5 and G5. The main AgNC-related absorption peak around 525 nm is similar for all five compounds. All compounds show also absorption features in the 300 to 450 nm range that are similar but slightly different for each mutant. While X5, A5 and C5 are stable, the G5 compound has limited stability and G5-NIR converts over time to the red emitter G5-RED (see below). For all compounds, position 5 is bent outwards (see below) and this nucleotide does not interact with the Ag16NC, indicating that this position has no significant effect on the main Ag16NC related optical transition. The emission spectra are very similar for T5, A5, C5 and G5-NIR. The only mutant with a slightly different emission spectrum is X5 which is red-shifted about 25 nm compared to T5. All absorption and emission maxima values can be found in Table 1. The 2D excitation versus emission plots for X5, A5 and C5 can be found in Fig. S5–S7.† The quantum yields of fluorescence are also given in Table 1 and range from 0.19 to 0.31 (see Fig. S8–S10† for details). The emission spectrum of G5 in Fig. 1B already indicates the presence of G5-RED by the additional blue tail on top of the G5-NIR emission.| Abs max (nm) | Em max (nm) | 〈τw〉 5 °C (ns) | 〈τw〉 25 °C (ns) | 〈τw〉 40 °C (ns) | V (nm3) | Q 25 °C | |
|---|---|---|---|---|---|---|---|
| a Data from Bogh et al.19 b Estimated from the excitation spectra. c Data from Bogh et al. and re-analyzed in the same way as the mutants presented here.19 d Due to the spectral overlap of G5-NIR and G5-RED, these values are 〈τ〉 values at 730 nm and 600 nm respectively. e Reference was cresyl violet in absolute ethanol (Q = 0.56).22 — indicates that data was not measured. | |||||||
| T5a | 525 | 736 | — | 3.27 | — | 10.32c | 0.26 |
| X5 | 524 | 761 | 3.07 | 2.42 | 1.93 | 10.27 | 0.19 |
| A5 | 528 | 739 | 3.10 | 2.54 | 2.21 | 10.28 | 0.25 |
| C5 | 530 | 735 | 3.82 | 3.35 | 2.87 | 10.30 | 0.31 |
| G5-NIR | 524b | 730 | 3.16d | 2.52d | 1.84d | 10.22 | — |
| G5-RED | 514b | 610 | 1.33d | 1.10d | 0.77d | — | — |
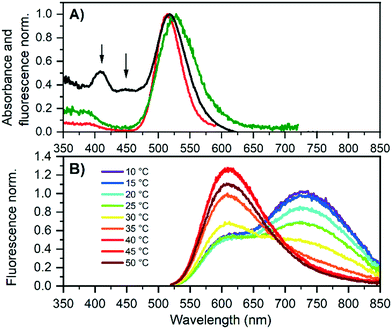
Next, G5 was studied in more detail to obtain the solution state properties of both emitters. Fig. 2A shows the absorption and excitation spectra of a HPLC-purified G5 sample that was 2 days old. The 600 nm excitation spectrum probes mainly G5-RED and has an excitation maximum at 514 nm, while the 730 nm excitation spectrum probes predominantly G5-NIR, whose excitation maximum is at 524 nm. Interestingly, the absorption spectrum of the aged G5 solution (Fig. 2A) shows additional absorption features at 400 and 450 nm that were not present in the fresh G5 solution, indicating that besides the formation of G5-RED, other species are formed as well. To investigate that G5-RED is formed from G5-NIR, we heated the solution to accelerate the conversion. Gradual heating from 10 °C to 50 °C promotes the conversion, as can be seen in the emission spectra in Fig. 2B. Cooling down the G5 sample from 50 °C to 10 °C did not reform G5-NIR, indicating that the conversion is irreversible (see Fig. S15†).
After characterizing the steady-state fluorescence properties, time-correlated single photon counting (TCSPC) measurements were performed. Table 1 shows the intensity-averaged decay times, weighted over the whole emission spectrum 〈τw〉 at different temperatures, and the hydrodynamic volumes, calculated from the time-resolved anisotropy experiments. The hydrodynamic volumes of the original T5 and the mutants (see Fig. S11–S13†) are similar in size, indicating that in solution the DNA-AgNCs are present as individual entities, and do not aggregate at the experimental solution concentrations. The largest difference between T5 and the mutants can be found in the fluorescence decay time. T5 and C5 have similar fluorescence decay times of 3.27 ns and 3.35 ns at 25 °C. X5, A5 and G5-NIR have significantly lower decay times of 2.42 ns, 2.54 ns and 2.52 ns, respectively. Plotting the quantum yield of fluorescence versus the fluorescence decay time (see Fig. S16†) results in a plot that can be fit linearly with a (0, 0) intersect. This could indicate that T5, X5, A5 and C5 have similar radiative rates and that the magnitude of the non-radiative decay pathways is dependent on the specific configuration at position 5. Since this position is pointed outwards and does not interact with the AgNC itself as explained below, we speculate that the local flexibility of this group could influence the rate of the non-radiative decay. As demonstrated previously for a number of other DNA-AgNCs,20,21 slow spectral relaxation on the time-scale of the fluorescence decay time occurs and leads to multi-exponential decay behavior at a specific wavelength (Fig. 3).
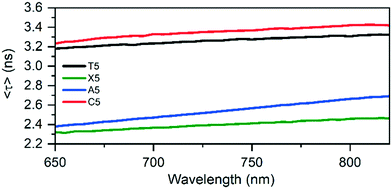 | ||
| Fig. 3 Average decay times of the original T5, X5, A5, and C5 mutants as a function of the emission wavelength at 25 °C. T5 data was taken from Bogh et al.19 | ||
Photophysical properties of the crystalline state
Crystals of the mutants were grown, as T5, by the hanging-drop vapor-diffusion method at 293 K. However, every modification required a different crystallization condition. The specific conditions are described in the Materials and methods section of the ESI.† For G5, only fresh solution containing mostly G5-NIR could be crystallized. Attempts to crystallize heat-treated G5 solution that contain mainly G5-RED (see Fig. 2B) were unsuccessful. Based on this and the crystal structure itself (see below), we can confidently conclude that only G5-NIR can be crystallized. Fig. 4 shows exemplary bright field and fluorescence images of A5 crystals, while Fig. S21–S24† show additional images of C5, X5, G5 and A5 crystals obtained with diverse crystallization conditions. Once the crystals were formed, fluorescence emission and decay time measurements were carried out to verify that the crystalline structure display similar photophysical properties as in solution. Emission maxima and 〈τw〉 of the crystals are listed in Table 2. All emission spectra of the crystalline state are blue-shifted compared to the solution case, which could be due to the crystal packing that reduces the DNA flexibility, and therefore limits the spectral relaxation. The magnitude of the blue-shift is likely dependent on the arrangement of the asymmetric units in the crystals.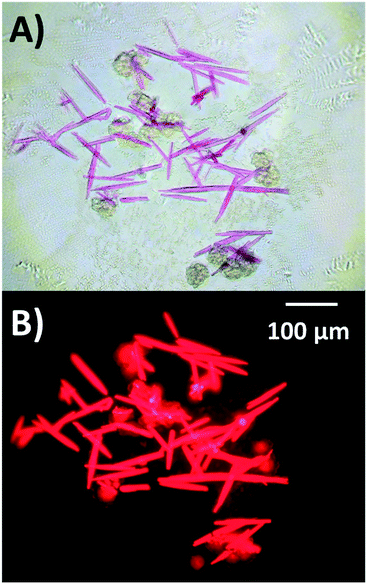 | ||
| Fig. 4 A) Bright field and B) fluorescence images of A5 crystals at 10× magnification. 1 μL of A5 solution was mixed with 1 μL of crystallization buffer composed of 10% PEG, 10 mM spermine, 50 mM 3-(N-morpholino)propanesulfonic acid (pH = 7) and 300 mM Ca(NO3)2. Additional images of all mutants can be found in the ESI† (Fig. S21–S24). | ||
| Em maxa (nm) | 〈τw〉RTa (ns) | |
|---|---|---|
| a All 〈τw〉 values (except for T5) and emission maxima are the average of five different crystals/crystal positions measurements. b Calculated from the data by Cerretani et al.9 c Single value measurement only, taken from Cerretani et al.9 | ||
| T5 | 711b | 2.26c |
| X5 | 715 | 1.68 |
| A5 | 671 | 2.26 |
| C5 | 703 | 2.64 |
| G5-NIR | 719 | 2.88 |
Crystal structure
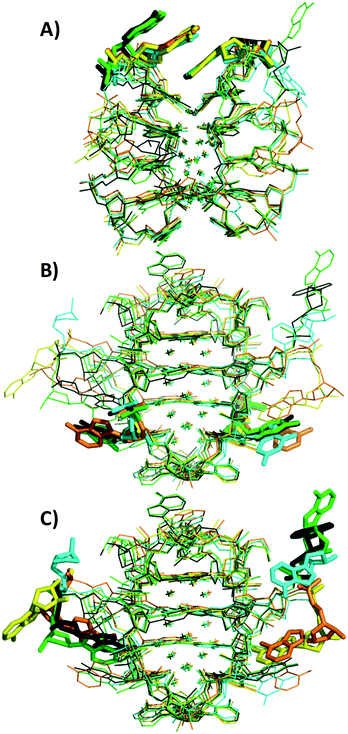
Crystal structures of A5, C5, G5-NIR and X5 can be found on the PDB website with accession codes 7BSE, 7BSF, 7BSG, and 7BSH, respectively. The structure of the subunits (subunit refers here to the Ag16NC stabilized by two stands of DNA, see Fig. 5) of the different mutants is similar to the original T5 (accession code 6JR4), where every Ag16NC is formed by 16 Ag atoms with occupancy of 1, and two additional Ag atoms with occupancy around 0.3. The latter Ag atoms are the only two that do not directly interact with any bases. This could explain the occupancy below 1, as the lack of direct bonding to a base introduces potential disorder. It could mean that the AgNC is in fact a Ag18NC, although this is still speculative at this point. Therefore, we continue to refer to the AgNC as Ag16NC.Every Ag16NC is stabilized by two DNA strands with a roughly similar conformation as T5, with the exception of the 3′ end A10 adenosines (see Fig. 5C) that differ significantly. As shown in Fig. 5B, position 5 always points outwards and there are no interactions between any of the position 5 nucleotides and the Ag atoms. In the G5-NIR structure, one G5 and one A10 base are disordered and cannot be seen in the structure. Individual views of each mutant can be found in Fig. S33–S37.† No Ag+-mediated interactions of the A10 bases were found in the mutants. This is in contrast to the original T5, where two A10 bases from neighboring unit cells formed a Ag+-mediated bond with an occupancy ∼0.3. Recently, we demonstrated for a T5 mutant without the terminal A10 (T5–A10, accession code 6M2P) that this Ag+-mediated bond between two A10 bases is not critical for the formation and stabilization of the crystal structure since T5–A10 and T5 form isomorphous crystals with almost identical unit cell parameters. Besides positions 10 and 5, some variations can also be seen in position 2 for one of the A2 bases. While A2s of the C5 mutant and the original T5 overlap, X5, G5 and A5 have a different position for one of the A2s (see Fig. 5A).
The X5 and C5 crystals share the same orthorhombic space group with one subunit in the asymmetric unit. The G5-NIR crystal is also orthorhombic with one subunit in the asymmetric unit, but has a different space group. On the other hand, A5 is tetragonal and contains two subunits in the asymmetric unit. All space groups of the mutants differ from the original T5 that was found to be monoclinic with two subunits in the asymmetric unit. Unlike A5 and G5-NIR, the crystal structures of X5 and C5 were refined to higher resolutions of 1.2 Å and 1.1 Å, which allowed to include the hydrogen atoms. Further details can be found in Tables S3 and S4.† Ca2+ ions could be observed between the subunits of the A5 structure but not between neighboring asymmetric units (see Fig. S38†), most likely due to the larger distance (making the ions disordered). A single Ca2+ is also present in the structure of the C5 mutant between two asymmetric units (see Fig. S39†). However, it is reasonable to assume that all mutant structures contain a certain number of Ca2+ ions to compensate the negative charge of the phosphate backbone, but they are disordered in the structure.
Regarding the crystal packing, many diverse π–π stacking interactions were found between nucleotide bases of different asymmetric units. These different π–π stacking seem to drive the final packing of the crystals. The G5-NIR crystal contains intermolecular G5–A10 and A2–A2 interactions between neighboring molecules, while for the X5 crystal, intermolecular A10–A2 interactions are found. The A5 crystal has intermolecular interactions between A6 and A10. Additionally, an interesting interaction between two A10s and two A5s: A10(1)–A5(2)–A5(1)–A10(2), where 1 and 2 within brackets indicate different asymmetric units, can be found. This interaction can be seen in Fig. 6A. In the C5 crystal, triple base interactions can be seen between A2(1)–C5(2)–A2(1) and A10(1)–C5(2)–A10(2), as shown in Fig. 6B and C. It seems that these positions (2, 5 and 10), although less critical to the AgNC stabilization, can play important roles in the crystal packing, and allow to manipulate the orientation of the AgNCs with respect to each other (see Fig. S38–S41† for an overview of the different asymmetric unit packing in the mutants). These base π–π stacking interactions can therefore become an important tool for creating specific crystal structures where the AgNCs can be positioned with designed orientations with respect to each other.
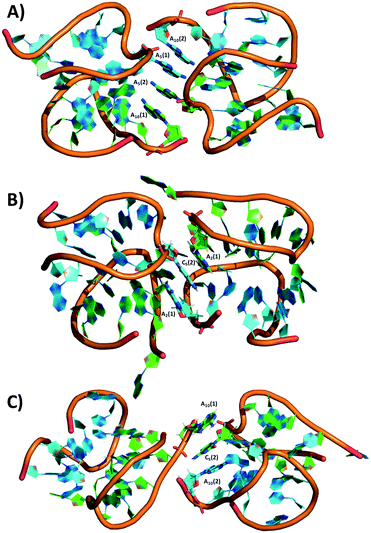 | ||
| Fig. 6 π–π stacking interactions in A) A5 and B, C) C5. Silver and calcium atoms are omitted for clarity. | ||
Recently, Copp et al. used machine learning tools in order to find stabilizing motifs able to produce specific emissive AgNCs.23 Our finding on the different mutants presented here, together with the T5–A10 findings,18 allowed to investigate this idea of a minimal motif needed to stabilize a specific AgNC. However, what matters is not necessarily the 5′–3′ arrangement of the oligonucleotides, but their 3D position. Additionally, for small DNA sequences, it seems common that two strands are involved in stabilizing the AgNC, adding an additional level of motif complexity. In our case, we propose a minimum pattern 5′-CACC/AGCG/-3′, responsible for stabilizing the Ag16NC, while positions 5 and 10 and partially position 2 (only one of the two strands) are of lesser importance. Cerretani et al. demonstrated recently that A10 can be removed with no significant consequences on the photophysical and structural properties.18 Besides using bases that do not interact with the AgNC to control crystal packing, it is also reasonable to assume that changing the crystallization conditions could be a way to force the asymmetric units in different packing geometries.
Conclusions
Mutation of position 5 enabled us to investigate its importance on the spectroscopic properties and crystal structure. Overall, mutating the 5 position with a cytosine (C5), guanine (G5), adenine (A5) or an abasic site (X5) still allowed us to create a NIR emitter and crystallize a similar Ag16NC as the original T5 compound. The only divergent behavior was for the G5 mutant that besides a G5-NIR also formed a G5-RED emitter. The G5-RED population could be enhanced by heating the G5-NIR solution. While we have shown here that the actual base at position 5 causes only minor changes to the photophysical properties of the Ag16NC emitter and even less to its structure, its backbone performs a critical role in providing the needed flexibility for the DNA to fold around the Ag16NC. Additionally, analyzing the crystal packing of the different mutants showed that positions 2, 5 and 10 can be used to drive the stacking of different asymmetric units in the crystal. We concluded that, based on the presented finding, a minimal pattern of 5′-CACC/AGCG/-3′ is needed to produce the Ag16NC with the two additional ∼0.3 occupancy Ag atoms. Our results provide also an approach to crystallize DNA-AgNCs that currently cannot be crystallized. Mutating non-critical nucleotides, not involved in direct binding to the AgNC, can induce π–π stacking interactions between different units and drive crystallization. Additionally, being able to potentially align AgNCs could create crystals with interesting polarization properties.Conflicts of interest
There are no conflicts to declare.Acknowledgements
C. C. and T. V. gratefully acknowledge financial support from the Villum Foundation (Project number VKR023115). J. K. was supported by Grant-in-Aid for Scientific Research (B) (No. 17H03033). We thank the Photon Factory (Tsukuba, Japan) for access to the synchrotron radiation facilities (No. 2019G539).Notes and references
- I. L. Volkov, Z. V. Reveguk, P. Y. Serdobintsev, R. R. Ramazanov and A. I. Kononov, Nucleic Acids Res., 2018, 46, 3543–3551 CrossRef CAS.
- I. L. Volkov, P. Y. Serdobintsev and A. I. Kononov, J. Phys. Chem. C, 2013, 117, 24079–24083 CrossRef CAS.
- J. M. Obliosca, C. Liu and H. C. Yeh, Nanoscale, 2013, 5, 8443–8461 RSC.
- P. R. Oneill, E. G. Gwinn and D. K. Fygenson, J. Phys. Chem. C, 2011, 115, 24061–24066 CrossRef CAS.
- S. H. Yau, N. Abeyasinghe, M. Orr, L. Upton, O. Varnavski, J. H. Werner, H. C. Yeh, J. Sharma, A. P. Shreve, J. S. Martinez and T. Goodson Iii, Nanoscale, 2012, 4, 4247–4254 RSC.
- H. C. Hsu, Y. X. Lin and C. W. Chang, Dyes Pigm., 2017, 146, 420–424 CrossRef CAS.
- J. T. Petty, J. Zheng, N. V. Hud and R. M. Dickson, J. Am. Chem. Soc., 2004, 126, 5207–5212 CrossRef CAS.
- D. J. E. Huard, A. Demissie, D. Kim, D. Lewis, R. M. Dickson, J. T. Petty and R. L. Lieberman, J. Am. Chem. Soc., 2019, 141, 11465–11470 CrossRef CAS.
- C. Cerretani, H. Kanazawa, T. Vosch and J. Kondo, Angew. Chem., Int. Ed., 2019, 58, 17153–17157 CrossRef CAS.
- D. Schultz and E. G. Gwinn, Chem. Commun., 2012, 48, 5748–5750 RSC.
- E. Gwinn, D. Schultz, S. M. Copp and S. Swasey, Nanomaterials, 2014, 5, 180–207 CrossRef.
- E. G. Gwinn, P. O'Neill, A. J. Guerrero, D. Bouwmeester and D. K. Fygenson, Adv. Mater., 2008, 20, 279–283 CrossRef CAS.
- Z.-G. Wang, Q. Liu, N. Li and B. Ding, Chem. Mater., 2016, 28, 8834–8841 CrossRef CAS.
- C. I. Richards, S. Choi, J. C. Hsiang, Y. Antoku, T. Vosch, A. Bongiorno, Y. L. Tzeng and R. M. Dickson, J. Am. Chem. Soc., 2008, 130, 5038–5039 CrossRef CAS.
- S. M. Copp, A. Gorovits, S. M. Swasey, S. Gudibandi, P. Bogdanov and E. G. Gwinn, ACS Nano, 2018, 12, 8240–8247 CrossRef CAS.
- S. M. Copp, D. Schultz, S. Swasey, J. Pavlovich, M. Debord, A. Chiu, K. Olsson and E. Gwinn, J. Phys. Chem. Lett., 2014, 5, 959–963 CrossRef CAS.
- S. M. Copp, S. M. Swasey, A. Gorovits, P. Bogdanov and E. G. Gwinn, Chem. Mater., 2020, 32, 430–437 CrossRef CAS.
- C. Cerretani, J. Kondo and T. Vosch, RSC Adv., 2020, 10, 23854–23860 RSC.
- S. A. Bogh, M. R. Carro-Temboury, C. Cerretani, S. M. Swasey, S. M. Copp, E. G. Gwinn and T. Vosch, Methods Appl. Fluoresc., 2018, 6, 024004 CrossRef.
- C. Cerretani, M. R. Carro-Temboury, S. Krause, S. A. Bogh and T. Vosch, Chem. Commun., 2017, 53, 12556–12559 RSC.
- S. A. Bogh, C. Cerretani, L. Kacenauskaite, M. R. Carro-Temboury and T. Vosch, ACS Omega, 2017, 2, 4657–4664 CrossRef CAS.
- A. M. Brouwer, Pure Appl. Chem., 2011, 83, 2213 CAS.
- S. M. Copp, P. Bogdanov, M. Debord, A. Singh and E. Gwinn, Adv. Mater., 2014, 26, 5839–5845 CrossRef CAS.
Footnote |
| † Electronic supplementary information (ESI) available: Materials and methods section, HPLC purification information, 2D emission vs. excitation plots, fluorescence quantum yield calculations, hydrodynamic volume calculations, additional emission spectra, decay curves, average decay times, TRES, bright-field and fluorescence images of the crystals, subunit and crystal packing views, crystal data and collection statistics. See DOI: 10.1039/d0ce01225d |
| This journal is © The Royal Society of Chemistry 2020 |

