 Open Access Article
Creative Commons Attribution 3.0 Unported Licence
From structure to crystallisation and pharmaceutical manufacturing: the CSD in CMAC workflows†‡
Lauren E.
Hatcher
 *ab,
Ayrton J.
Burgess
c,
Pollyanna
Payne
a and
Chick C.
Wilson
 ac
ac
aCMAC Future Manufacturing Hub, Department of Chemistry, University of Bath, Bath BA2 7AY, UK
bSchool of Chemistry, Cardiff University, Cardiff CF10 3AT, UK. E-mail: HatcherL1@cardiff.ac.uk
cDepartment of Chemistry, University of Bath, Bath BA2 7AY, UK
First published on 22nd September 2020
Abstract
Two workflows are presented that are relevant to the design and construction of end-to-end pharmaceutical manufacturing processes. The workflows target the very early stage crystallisation aspect of these processes – production of the primary crystalline solid form – and relate to establishing decision-driven approaches for the screening for multi-component forms, specifically co-crystals, and to the use of additives to control crystal and primary particle form, notably morphology. These workflows are shown to benefit from the use of the million-plus structures in the Cambridge structural database and the associated structural informatics and analysis tools and are placed into the context of the work of the CMAC Future Manufacturing Hub.
Introduction & context
The focus on optimised pharmaceuticals manufacturing
Crystallisation is an integral step in the processing of pharmaceutical products, whose optimisation is critical in this context,1,2 with more than 80% of market drugs being formulated in crystalline form. While the dominant attrition from initial candidate compounds to licensed and marketed drugs occurs in early stage synthesis, biological efficacy and early stage clinical testing, there is a significant element of “manufacturability” as a barrier to successful delivery of pharmaceutical products. Moreover, as the rate of discovery of “blockbuster” drug molecules decreases, there is an increased focus on improving the potential value of existing drugs or candidates, for example by improving formulation to enhance bioavailability, or by improving manufacturing processes to reduce costs and hence allow for more competitive product pricing and wider availability. Optimised and flexible manufacturing processes can also allow for effective formulation of reduced and tuneable dosage products, one aspect of the move towards personalised medicine approaches.As part of this effort, in the downstream parts of the pharmaceuticals manufacturing chain comprehensive screening is essential to characterize fully the solid forms of each drug and their related physical properties, in order to assess and potentially improve the safety and effectiveness of a treatment. Two aspects of improving primary (crystal) solid forms of target APIs are discussed here: multi-component materials (co-crystals) and additives. These are discussed largely in the context of the work being carried out by the UK CMAC consortium, the Future Manufacturing Hub in Continuous Manufacturing and Advanced Crystallisation3 and with specific reference to the way in which tools developed by the Cambridge Crystallographic Data Centre (CCDC§) are employed as an intrinsic element of the approaches accounted. The CMAC consortium tackles the issue of optimising pharmaceutical manufacturing by the adoption of end-to-end processes centred around continuous crystallisation methods.4 The potential drivers for adoption of continuous manufacturing in the pharmaceutical (and fine chemicals) sector are based around the opportunity to optimise product quality with enhanced cost effectiveness, sustainability, energy and environmental benefits.5,6 Adoption of continuous manufacturing approaches is also potentially well suited for future directions in production of small batch, targeted and personalised medicines. However, technical and economic challenges remain to be overcome to enable adoption of new continuous manufacturing processes, and a number of substantial efforts world-wide are targeting these challenges (for example, the Novartis-MIT Center for Continuous Manufacturing7). In addressing the technical challenges, CMAC has developed an approach based around the establishment of microfactories. These are effectively constructed in a modular fashion from process steps, the choice and optimisation of which are based on an underpinning set of workflows that can be implemented and linked to evaluate rapidly the feasibility of diverse potential approaches for the production of a given target molecule or family of molecules. These evaluation and design steps rely on a combination of experimental and digital approaches, to allow decision-making based on measured and predictive parameters.
The Cambridge structural database (CSD8), combining information available from the million structures and more, together with CSD tools for analysing these, can offer an important informatics-based element of a digitally-driven approach and to the establishment of experimentally-based workflows and associated decision making as part of process design. Embedded in structural chemistry principles, the CSD offers a unique capability for establishing and analysing structural trends in solid state pharmaceutical materials, hydrogen bond patterns, target, additive and co-former identification. The research presented recognises the importance of optimisation of primary particle attributes9 and moves towards embedding capabilities offered by the CSD in pharmaceutical and fine chemical manufacturing, by consideration of the possibilities offered by multi-component crystallisation methods, which allow for application in screening for new solid forms with optimised physical properties, influencing morphology of particles for downstream processing, investigating the effect of additives, and more.
Multi-component approaches
The key difference between MC and additive crystallisation routes is the intention for the incorporation of the second component into the API crystal structure: MC routes should only be considered when a change in crystal form (e.g. a co-crystal) is acceptable, while additive methods will be considered when the API must be delivered only in its pure form. This paper describes standardised workflows for MC material screening studies and analysis, and for developing additive crystallisation routes on API targets within CMAC. The MC workflow is used to design and execute a MC material screen for the non-steroidal anti-inflammatory drug (NSAID) flufenamic acid, enabling us to benchmark the workflow and assess its suitability for MC material discovery, while the application of the additive workflow in morphology modification is illustrated for the anti-tubercular drug isoniazid.
Experimental
Powder X-ray diffraction
Powder X-ray diffraction (PXRD) data were collected on lightly ground samples using a STOE STADI P powder diffractometer, equipped with a CuKα1 source, in transmission geometry. Data were collected at ambient temperature, between 5° and 50° in 2θ, using a Dectris Mythen 1K detector. The data were collected and analysed using the WinXPOW powder diffraction software suite (STOE; version 3.6.0.1).Single crystal X-ray diffraction
Single crystal X-ray diffraction (SCXRD) data were collected on a dual source Rigaku Oxford Diffraction Gemini A Ultra diffractometer, equipped with an Atlas CCD detector and an Oxford Cryosystems Cryojet-XL liquid nitrogen cooling device for temperature control. Data collection, indexing and integration were performed using the Rigaku Oxford Diffraction software CrysAlisPRO. Structures were solved by dual-space methods in SHELXT and refined by full matrix least squares on F2 in SHELXL. CH hydrogen atoms were placed geometrically and refined using a riding model, with isotropic displacement parameters fixed to Uiso = 1.2 × the Ueq of the parent atom. Heteroatom hydrogen atoms (OH and NH) were located from the Fourier electron density difference map and refined isotropically.Differential scanning calorimetry
Differential scanning calorimetry (DSC) measurements were performed on a TA instruments Q20 calorimeter equipped with a Thermal Advanced Cooling System 90 and dry nitrogen purge gas at a flow rate of 18 mL min−1. The experiments were controlled using the TA Instruments Advantage software, version 5.4.0. A lightly powdered, 5 mg sample was sealed into a Tzero aluminium pan and equilibrated at 20 °C, before being ramped to 180 °C at a heating rate of 10 °C min−1. The resulting data were analysed in the TA Instruments Universal Analysis software.Infrared spectroscopy
Fourier transform infrared spectroscopy (FTIR) measurements were performed on a Perkin Elmer FTIR spectrometer at room temperature, with spectra recorded on lightly ground powder samples between 800 and 4000 cm−1. Data collection and analysis were performed using the Perkin Elmer Spectrum software, version 10.400.0190.Workflow development
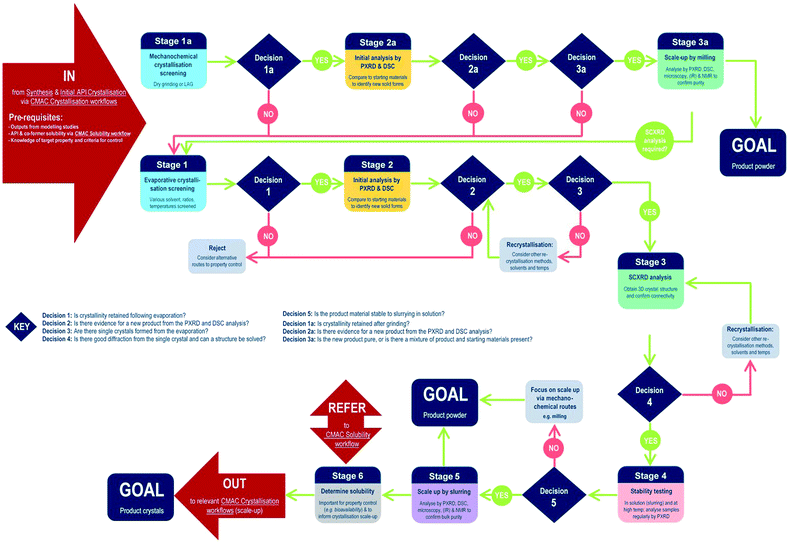
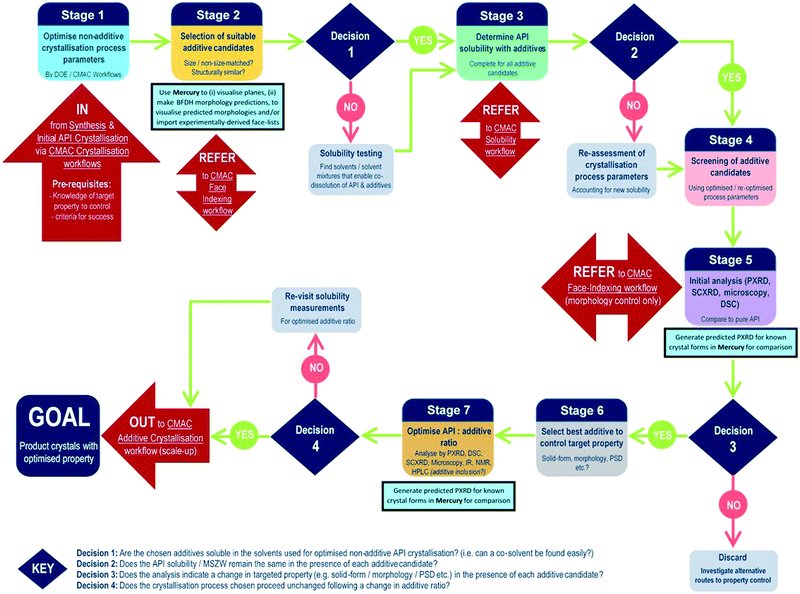
The development of each of the MC material and additive screening workflows are summarised briefly, within the context of the CMAC programme. Both workflows are driven by a decision-making process, which is based around the fundamental goal of accessing a new API crystal or particle form with one or more target physical properties that are improved relative to the parent compound. The workflows include regular checkpoint decisions, which reflect points at which challenges are often encountered in a MC or additive crystallisation screen and a decision from the experimenter is usually required. This may involve situations such as poor starting material solubility, poor product crystallinity, a difficulty in growing single-crystals suitable for analysis, or issues with sample stability. The flowchart diagrams (Fig. 1 and 2) indicate several key points at which the CCDC software tools, particularly those available in programs ConQuest and Mercury, are routinely implemented and these are invaluable for both experiment design and data analysis stages. Key points specific to the individual workflows are discussed further below.MC material screening workflow
Processes for co-crystal screening are well established in many laboratories; the workflow developed in the CMAC context is illustrated below (Fig. 1).At the start of MC material screening, the key API physical property targeted for improvement as a result of MC material development should be outlined, along with key criteria for success. Additionally, before experimental MC material screening can commence decisions on the choice of suitable co-formers must be made. This could be achieved via a number of routes, as outlined in the pre-requisites section, but within CMAC there is a focus on the use of prediction-led screening to guide MC experiment design. This can include ab initio modelling work (both molecular and solid state), or semi-empirical approaches such as those available from the CCDC software suite. The >1 million structures in the CSD provide a unique resource that should be utilised in designing a MC material screen, and both data mining approaches and molecular complementarity screening searches prove effective. Further details are provided in the benchmarking study below. Finally, any available solubility data for both the API and the chosen co-former set is also a valuable pre-requisite and is often available either from the literature or from prior experimental work with the pure API.
Stages 1–3 focus on MC materials discovery at the small (≤5 mL) scale. In practice we find that the parallel implementation of evaporative and mechanochemical crystallisation routes is an effective way to probe the maximum amount of the MC material design space in the shortest period of time. All decisions at these early stages are focussed on deciding if a new, crystalline product form has been accessed and if this can be conclusively characterised.
Stages 4–6 focus on MC materials development at a meso-scale (≤1 g) and the key aims of these stages are to assess whether any improvement in the target physical property is achieved by moving to the new API solid form, and to gather other physical property information that will assist in the design of scaled-up recrystallisation routes with the new material, that will be pursued in accordance with other CMAC experiment workflows within the broader CMAC family.
The overall goal of this discovery-stage workflow is to deliver a new MC API crystal form, that is well-characterised at the small to meso-scale, in either microcrystalline powder or single crystal form.
Additive screening workflow
In contrast to the situation for MC materials, additive interventions are less commonly systematically implemented. The workflow developed is given in Fig. 2 and includes the following informatics-informed elements: can additives offer benefits (in spite of being an additional process option/step); which additives are likely to be effective/scalable; at what level (concentration) are additives required to be used and what are the downstream implications. It should be noted that for size matched and structurally similar additives, the two workflows have much commonality; co-crystal screening tends to focus at higher (“stoichiometric”) second component (co-former) concentrations, while additive screening tends to focus on lower second component (additive) concentrations. Any decisions informed by such a workflow must, of course, meet the key criterion of allowing decisions to be made rapidly in challenging process development-driven environments.As for the MC equivalent, at the start of an additive crystallisation screen the key API physical property targeted for improvement must be outlined, along with sensible criteria for success.
The additive crystallisation screening does not aim to change the composition of the API material, but instead the particular crystal particle attributes, e.g. particle size distribution (PSD), shape/morphology etc. As such, there is benefit in first optimising the non-additive crystallisation process parameters with a view to employing these as a standard for all additive screening experiments (stage 1, Fig. 2). This helps to ensure any changes observed are the result of the additives, and not due to changes in the experiment set-up.
Stages 2 and 3 involve the choice of suitable additive candidates and an understanding of their solubility requirements. Within CMAC, as with co-former selection there is a focus on prediction-led approaches to additive selection and this includes ab initio modelling work, collaboration with the ADDoPT programme,15 as well as empirical and semi-empirical approaches. Empirical routes include the collection of crystal face information by SCXRD face-indexing methods, which are beyond the scope of this article but are conducted in accordance with another internal CMAC workflow procedure. This information can be visualised in the CCDC crystal structure visualisation software Mercury, in conjunction with their BFDH morphology prediction tools. Crystal structure data from the CSD can also be used to understand the nature of observed and predicted crystal faces, included the functional groups likely at the crystal surface terminations and, as an extension of this, likely surface properties.16
Stages 4–5 focus on additive screening at the small (≤5 mL) scale. All decisions at these stages are focussed on determining whether the target crystal particle attributes has been enhanced, and/or confirming that there has been no change in the API solid form, e.g. there has been no inclusion of the additive into the structure, and no polymorphic phase transformation is induced by the presence of the additive.
The final stages of the workflow focus on optimising the crystallisation conditions for the most promising additive candidates, including identifying the optimum additive concentration (stage 6), as well as ensuring the solvent choice, API concentration and other crystallisation process parameters remain optimal for the new additive crystallisation route. All of this information can then inform the design of scaled-up additive recrystallisation routes, that will be pursued in accordance with other CMAC experiment workflows within the broader CMAC family.
The overall goal of this discovery-stage workflow is to deliver API crystals with enhanced particle attributes, that is well characterised at the small scale and whose solid-form remains unchanged as a result of additive crystallisation.
Benchmarking the workflows I: MC material screening with flufenamic acid (FLU)
The MC-workflow was used to design a MC material screening experiment with flufenamic acid (FLU). Fenamic acid derivatives are a class of NSAIDs that are known to display challenging properties for industrial recrystallisation, including diverse conformational polymorphism,17,18 high hydrophobicity and particle adhesion,19 and low aqueous solubility leading to reduced bioavailability.20 MC crystallisation offers a route to modify the crystal form, targeting improved physical properties and processability.1. Workflow inputs/prerequisites
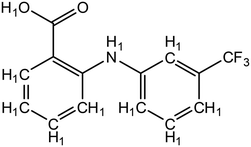 | ||
| Fig. 3 Structure of flufenamic acid (FLU), used as structure search in ConQuest, with all hydrogens explicitly assigned. | ||
• 3D coordinates must be determined.
• No polymeric structures.
• Only organic structures.
The explicit hydrogen assignment on COOH precludes the return of salt structures for this search.
The search returns 22 hits, of which 10 are structure determinations (or re-determinations) of the eight characterised polymorphs of FLU (CCDC ref-code base FPAMCA), nine are unique MC materials and the remaining three are re-determinations of these. See Table S1† for further details.
A second search was also performed, in which an additional query atom (any non-metal, NM) was added to represent the acceptor atom of a neighbouring molecule (see Fig. S1†). The Add 3D functionality was used to define both the atom label of this query atom, and the intermolecular contact distance between it and the hydroxyl oxygen. This restricted search allowed a quick and visual inspection of both the hydrogen bond acceptor atom and the intermolecular hydrogen bond distance in each of the returned structures. This provides valuable information as to the most common hydrogen bond motifs (and from this, infers the common supramolecular synthons) involved in the successful FLU-based MC materials reported to-date. The information can then guide the choice of suitable new co-formers for screening. The results indicated that five of the nine MC structures involved OH⋯O hydrogen bonds, all of which would be classified as medium strength on the basis of their bond length. Closer inspection in Mercury revealed the majority of these to involve R(8)22 COOH-dimer motifs, which is also the case for all of the known polymorphs of pure FLU. For FLU to form such a heterodimer in a MC material, there must be an energetic benefit over the homodimer in the pure API. This may reflect why only a handful of MC materials of this type are known. The remaining four MC structures involved medium strength OH⋯N hydrogen bonds, and closer inspection of these structures in Mercury revealed that these typically involved nitrogen atoms in aromatic ring systems.
A third search replaced the COOH group for COO– and retained the same filters. This returned only three organic salt structures, all of which are primary amine salts containing NH3+ (see Table S2†).
Of the nine known MC structures with FLU, one of the most extensively studied is the FLU 4,4′-bipyridine (2![[thin space (1/6-em)]](https://www.rsc.org/images/entities/char_2009.gif) :
:![[thin space (1/6-em)]](https://www.rsc.org/images/entities/char_2009.gif) 1) co-crystal system (with three structures reported to the CSD, ref-code base ZIQFEM). This, and the observed preference for FLU to form OH⋯N(aromatic) hydrogen bonds, lead us to choose its other common isomer, 2,2′-bypridine (CSD ref-code BIPYRL), as an additional co-former for our benchmarking study.
1) co-crystal system (with three structures reported to the CSD, ref-code base ZIQFEM). This, and the observed preference for FLU to form OH⋯N(aromatic) hydrogen bonds, lead us to choose its other common isomer, 2,2′-bypridine (CSD ref-code BIPYRL), as an additional co-former for our benchmarking study.
The molecular descriptors can be categorised by their relation to either the polarity of the co-former molecule, its size, or its shape, as follows:
• Polarity descriptors – dipole moment magnitude, fraction of N and O atoms.
• Size descriptor – S-axis.
• Shape descriptors – S/L axis ratio, M/L axis ratio.where S = smallest molecular axis length, M = medium axis length, L = longest axis length. If all of the selected molecular descriptors meet the complementarity criteria, the molecule is deemed to have passed the screening test.21
The original work indicates that the polarity and shape descriptors are the most informative for co-former selection, however any of the five descriptors may be excluded from a search at the user's discretion. If excluded, the descriptor is effectively given an automatic pass in the analysis.
Though Mercury contains its own library of potential co-formers, for our benchmarking study we created a co-former library from 25 small molecules on the FDA's generally regarded as safe (GRAS) list22,23 (see Table S3† for further information). If a MC material is formed between an API and a co-former from this GRAS library, it would prevent fewer regulatory concerns as a potential new drug formulation.
Three screening searches were performed with FLU and the GRAS library, each with a different combination of molecular descriptors:
• Search 1 used all five descriptors.
• Search 2 used only the polarity and shape descriptors.
• Search 3 used only the polarity descriptors.
Full outputs from all three searches are provided in Tables S4–S6.† To maintain a reasonably broad design-space for MC material screening, the outputs of search 3 were chosen to guide co-former selection. The search returned eight hits: adipic acid (CSD ref-code ADIPAC), benzoic acid (BENZAC), pyridoxine (BITZAF), octanoic acid (IZENUP), 2,4-hexadienoic acid (LEZHUT), nicotinamide (NICOAM), nicotinic acid (NICOAC) and propionic acid (PRONAC). Of these, a FLU-nicotinamide co-crystal is already known (EXAQAW),24 and so this co-former was excluded. Octanoic and propionic acid were also excluded on the basis that – both being oily, pungent liquids – it may be difficult to pursue mechanochemical crystallisation experiments. This left a set of five GRAS co-formers recommended by the molecular complementarity screening for our study.
2. MC workflow benchmarking
![[thin space (1/6-em)]](https://www.rsc.org/images/entities/char_2009.gif) :
:![[thin space (1/6-em)]](https://www.rsc.org/images/entities/char_2009.gif) 1 stoichiometric ratio of each co-former and dissolved in ca. 15 mL of the crystallisation solvent, then allowed to evaporate slowly at a constant 20 °C. Full experimental details are provided in the ESI.†
1 stoichiometric ratio of each co-former and dissolved in ca. 15 mL of the crystallisation solvent, then allowed to evaporate slowly at a constant 20 °C. Full experimental details are provided in the ESI.†
The resulting product materials were analysed by polarised light microscopy (PLM) and in each case workflow decision 1 was considered: is crystallinity retained? For the majority of samples, the answer was no and these were discarded (Table S7†), however two samples were progressed to stage 2 of the workflow: [FLU + 22-BPY] from ethyl acetate, and [FLU + BA] from propan-2-ol.
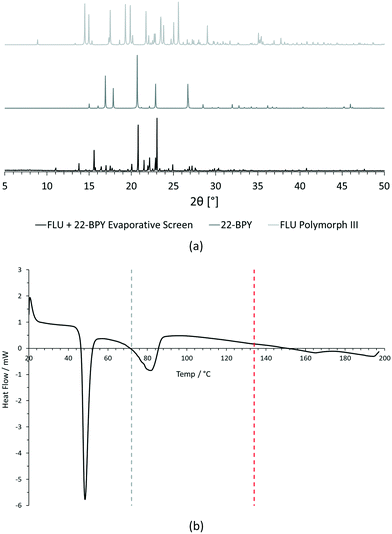
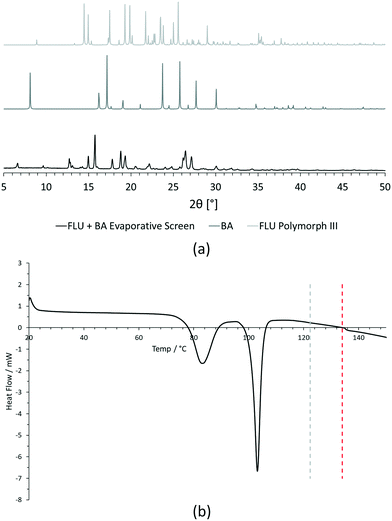
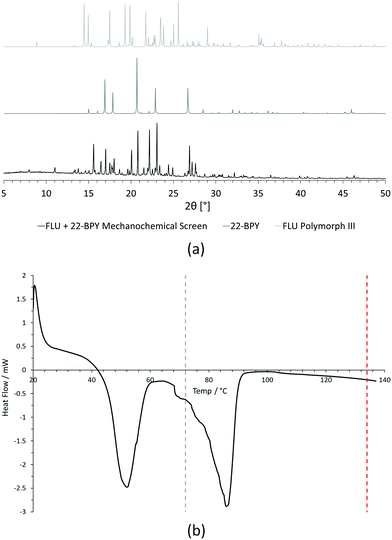
For PXRD comparisons, predicted starting material patterns were generated from 3D crystal structure data from the CSD, utilising the powder prediction tool in Mercury. This capability is particularly useful for materials such as FLU, as any one of its known polymorphs might preferentially crystallise in the presence of the co-former additive and it is not straightforward to collect experimental patterns for all polymorphs simply for comparison purposes. For clarity, only polymorph III is included for comparison in Fig. 4 and 5, as this was primarily observed, however a full comparison against all eight structurally characterised forms of FLU was conducted and is provided in the ESI.†
For DSC, the experimental traces are compared to melting point data obtained from the literature (FLU mp = 134 °C,25 22-BPY mp = 72 °C,26 and BA mp = 122.4 °C).27
Comparison of the [FLU + 22-BPY] PXRD data with the starting materials allow us to address decision 2 of the workflow: is there evidence of new forms? The analysis clearly indicates the production of a new crystal form, in particular from the new peaks identified at 11.0°, 13.8°, 15.6°, and 23.1°. Peaks at 17.0°, 20.8° and 22.9° indicate the presence of some unreacted 22-BPY starting material. These results are corroborated by the DSC data, which show a new sharp endothermic peak at 48 °C that is attributed to the melt of a new crystal form, but also a small endotherm with an onset at 73 °C that coincides with the expected melt of unreacted 22-BPY.
Decision 2 was also considered for [FLU + BA]. Again, both PXRD and DSC strongly indicate the presence of a new crystal form. The PXRD data show many new peaks, including those located at 6.7°, 12.8°, 15.8°, 17.8° and 18.8°, which indicate a new material. While there is some weak evidence of FLU form III in the data, there are no obvious peaks to indicate excess BA starting material. The DSC trace shows a sharp endotherm at 103° that could be attributed to a new crystal form. Another, broader endothermic event also occurs between ∼75–90 °C. As this sample was prepared from propan-2-ol, which has a boiling point of ∼82 °C, this peak could represent loss of propan-2-ol from the powder, indicating a solvated solid form. This would be confirmed by a single crystal X-ray structure.
Finally, decision 3 should be considered for both samples: are there single crystals? The PLM analysis of [FLU + 22-BPY] revealed plate-like crystals alongside the crystalline powder, which were suitable for analysis by SCXRD. By contrast, no suitable single crystals could be obtained for [FLU + BA] and, as per the workflow, this sample was referred for repeat recrystallisation attempts. To-date, no suitable single crystals have been prepared. Where this situation is encountered for high-priority materials, e.g. late-stage API candidates, more challenging 3D structure analysis methods could be attempted, e.g. structure solution from powder diffraction data. However, here it is outside the scope of our benchmarking investigation.
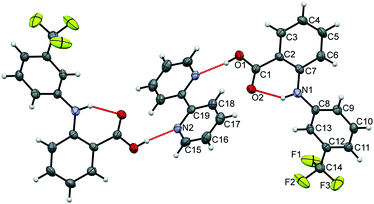
The data confirm that a new MC material has formed, containing FLU and 22-BPY in a 2![[thin space (1/6-em)]](https://www.rsc.org/images/entities/char_2009.gif) :
:![[thin space (1/6-em)]](https://www.rsc.org/images/entities/char_2009.gif) 1 ratio (Fig. 6). The full crystal data are given in Table 1. The 2
1 ratio (Fig. 6). The full crystal data are given in Table 1. The 2![[thin space (1/6-em)]](https://www.rsc.org/images/entities/char_2009.gif) :
:![[thin space (1/6-em)]](https://www.rsc.org/images/entities/char_2009.gif) 1 ratio of the product co-crystal explains why excess 22-BPY was observed in the PXRD and DSC data following formation from a 1
1 ratio of the product co-crystal explains why excess 22-BPY was observed in the PXRD and DSC data following formation from a 1![[thin space (1/6-em)]](https://www.rsc.org/images/entities/char_2009.gif) :
:![[thin space (1/6-em)]](https://www.rsc.org/images/entities/char_2009.gif) 1 stoichiometric ratio of starting materials. The material crystallises in the monoclinic space group P21/c, with one FLU molecule and half a 22-BPY molecule in the asymmetric unit. The N–H and O–H hydrogen atoms are easily located in the Fourier electron density difference map, with H1 clearly associated with the FLU molecule to retain the carboxylic acid functionality. This enables the assignment of a FLU 22-BPY (2
1 stoichiometric ratio of starting materials. The material crystallises in the monoclinic space group P21/c, with one FLU molecule and half a 22-BPY molecule in the asymmetric unit. The N–H and O–H hydrogen atoms are easily located in the Fourier electron density difference map, with H1 clearly associated with the FLU molecule to retain the carboxylic acid functionality. This enables the assignment of a FLU 22-BPY (2![[thin space (1/6-em)]](https://www.rsc.org/images/entities/char_2009.gif) :
:![[thin space (1/6-em)]](https://www.rsc.org/images/entities/char_2009.gif) 1) co-crystal, containing one COOH⋯N intermolecular hydrogen bond between the two components. FTIR data, collected on a sample of ground single crystals, further confirm this assignment (Fig. S3, ESI†). Finally, the predicted PXRD pattern for the single crystal X-ray structure was generated using Mercury and compared with the experimental data (see Fig. S4, ESI†). There is good agreement between the two patterns, confirming that the single crystal structure is representative of the bulk sample.
1) co-crystal, containing one COOH⋯N intermolecular hydrogen bond between the two components. FTIR data, collected on a sample of ground single crystals, further confirm this assignment (Fig. S3, ESI†). Finally, the predicted PXRD pattern for the single crystal X-ray structure was generated using Mercury and compared with the experimental data (see Fig. S4, ESI†). There is good agreement between the two patterns, confirming that the single crystal structure is representative of the bulk sample.
![[thin space (1/6-em)]](https://www.rsc.org/images/entities/char_2009.gif) :
:![[thin space (1/6-em)]](https://www.rsc.org/images/entities/char_2009.gif) 1) co-crystal
1) co-crystal
| Sample | FLU 22-BPY (2![[thin space (1/6-em)]](https://www.rsc.org/images/entities/char_2009.gif) : :![[thin space (1/6-em)]](https://www.rsc.org/images/entities/char_2009.gif) 1) 1) |
|---|---|
| Empirical formula | C19H14F3N2O2 |
| Formula weight | 359.32 |
| Temperature/K | 150.00(10) |
| Crystal system | Monoclinic |
| Space group | P21/c |
| a/Å | 9.6550(8) |
| b/Å | 7.8337(4) |
| c/Å | 21.8957(16) |
| α/° | 90 |
| β/° | 100.355(7) |
| γ/° | 90 |
| Volume/Å3 | 1629.1(2) |
| Z | 4 |
| ρ calc g cm−3 | 1.465 |
| μ/mm−1 | 0.119 |
| F(000) | 740.0 |
| Crystal size/mm3 | 0.61 × 0.45 × 0.05 |
| Radiation | Mo Kα (λ = 0.71073) |
| 2θ range for data collection/° | 6.208 to 51.362 |
| Reflections collected | 7063 |
| Independent reflections | 3095 [Rint = 0.0649, Rsigma = 0.1083] |
| Data/restraints/parameters | 3095/43/256 |
| Goodness-of-fit on F2 | 1.009 |
| Final R indexes [I> = 2σ (I)] | R 1 = 0.0585, wR2 = 0.0853 |
| Final R indexes [all data] | R 1 = 0.1393, wR2 = 0.1106 |
| Largest diff. peak/hole/e Å−3 | 0.28/−0.24 |
At this stage we can answer yes to decision 4 of the workflow: is there good diffraction from the single crystal and can a structure be solved? This completes the discovery phase of the workflow for evaporative crystallisation routes.
![[thin space (1/6-em)]](https://www.rsc.org/images/entities/char_2009.gif) :
:![[thin space (1/6-em)]](https://www.rsc.org/images/entities/char_2009.gif) 1 API to co-former ratio – and one drop of the chosen recrystallisation solvent, were ground by hand using a pestle and mortar for 15 min. Full experimental details for all screens are provided in Table S8.†
1 API to co-former ratio – and one drop of the chosen recrystallisation solvent, were ground by hand using a pestle and mortar for 15 min. Full experimental details for all screens are provided in Table S8.†
The resulting powder samples were then analysed by PLM, and decision 1a of the workflow was considered: is crystallinity retained. For several samples, the answer was yes and these were progressed on to stage 2a. Where the answer was no, those samples were discarded.
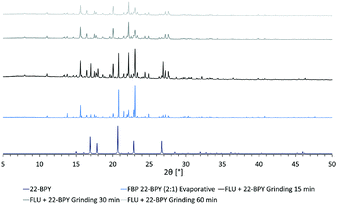
In an attempt to access a pure MC material by mechanochemical routes, a second series of grinding experiments were then performed where the starting materials were ground for a total of 60 min, in a 2![[thin space (1/6-em)]](https://www.rsc.org/images/entities/char_2009.gif) :
:![[thin space (1/6-em)]](https://www.rsc.org/images/entities/char_2009.gif) 1 ratio of API to co-former. Samples were taken every 15 min and analysed by PXRD. The results (Fig. 8) show that a near-pure sample of the FLU 22-BPY (2
1 ratio of API to co-former. Samples were taken every 15 min and analysed by PXRD. The results (Fig. 8) show that a near-pure sample of the FLU 22-BPY (2![[thin space (1/6-em)]](https://www.rsc.org/images/entities/char_2009.gif) :
:![[thin space (1/6-em)]](https://www.rsc.org/images/entities/char_2009.gif) 1) co-crystal can be accessed gradually with longer grinding times, and a revised answer to decision 3a is possible if the grinding time exceeds 60 min.
1) co-crystal can be accessed gradually with longer grinding times, and a revised answer to decision 3a is possible if the grinding time exceeds 60 min.
To investigate further this mechanochemical route to FLU 22-BPY (2![[thin space (1/6-em)]](https://www.rsc.org/images/entities/char_2009.gif) :
:![[thin space (1/6-em)]](https://www.rsc.org/images/entities/char_2009.gif) 1), the next stage would be to progress to stage 3a and attempt to form the co-crystal by ball-milling. This work is beyond the scope of this discovery-level benchmarking investigation.
1), the next stage would be to progress to stage 3a and attempt to form the co-crystal by ball-milling. This work is beyond the scope of this discovery-level benchmarking investigation.
![[thin space (1/6-em)]](https://www.rsc.org/images/entities/char_2009.gif) :
:![[thin space (1/6-em)]](https://www.rsc.org/images/entities/char_2009.gif) 1) co-crystal remains useful for benchmarking purposes.
1) co-crystal remains useful for benchmarking purposes.
![[thin space (1/6-em)]](https://www.rsc.org/images/entities/char_2009.gif) :
:![[thin space (1/6-em)]](https://www.rsc.org/images/entities/char_2009.gif) 1) in ethyl acetate, for a period of 24 h at room temperature, to assess its stability in its initial crystallisation medium. The resulting powder was analysed by PXRD (Fig. S6†), and the results are used to assess decision 5 of the workflow: is the product material stable to slurrying in solution? A few weak peaks correspond to FLU polymorph III and may indicate a small amount of dissociation, however there is no evidence of 22-BPY and in the main the pattern compares well to that obtained for the pure co-crystal. These results provide useful information for the future design of scaled-up recrystallisation routes that might target particular crystal particle attributes, which could retain ethyl acetate as the solvent.
1) in ethyl acetate, for a period of 24 h at room temperature, to assess its stability in its initial crystallisation medium. The resulting powder was analysed by PXRD (Fig. S6†), and the results are used to assess decision 5 of the workflow: is the product material stable to slurrying in solution? A few weak peaks correspond to FLU polymorph III and may indicate a small amount of dissociation, however there is no evidence of 22-BPY and in the main the pattern compares well to that obtained for the pure co-crystal. These results provide useful information for the future design of scaled-up recrystallisation routes that might target particular crystal particle attributes, which could retain ethyl acetate as the solvent.
![[thin space (1/6-em)]](https://www.rsc.org/images/entities/char_2009.gif) :
:![[thin space (1/6-em)]](https://www.rsc.org/images/entities/char_2009.gif) 1) in aqueous conditions, for a period of 24 h. This competitive slurrying experiment was performed at 37 °C, in an attempt to mimic conditions for dissolution in vivo. The resulting powder was again analysed by PXRD (Fig. S7†), which revealed that the co-crystal dissociates into its constituent components under these conditions. In this case, the answer to decision 5 is no, with regards to process design, but proof of such aqueous dissociation is valuable information regarding eventual performance of a drug formulation to be delivered orally in tablet form.
1) in aqueous conditions, for a period of 24 h. This competitive slurrying experiment was performed at 37 °C, in an attempt to mimic conditions for dissolution in vivo. The resulting powder was again analysed by PXRD (Fig. S7†), which revealed that the co-crystal dissociates into its constituent components under these conditions. In this case, the answer to decision 5 is no, with regards to process design, but proof of such aqueous dissociation is valuable information regarding eventual performance of a drug formulation to be delivered orally in tablet form.
![[thin space (1/6-em)]](https://www.rsc.org/images/entities/char_2009.gif) :
:![[thin space (1/6-em)]](https://www.rsc.org/images/entities/char_2009.gif) 1) co-crystal was placed in an oven at 50 °C and portions removed for analysis by PXRD at intervals in a 1 week period. The resulting data (Fig. S8†) indicated that the sample is not stable for long under these conditions, with dissociation complete after 24 h.
1) co-crystal was placed in an oven at 50 °C and portions removed for analysis by PXRD at intervals in a 1 week period. The resulting data (Fig. S8†) indicated that the sample is not stable for long under these conditions, with dissociation complete after 24 h.
![[thin space (1/6-em)]](https://www.rsc.org/images/entities/char_2009.gif) :
:![[thin space (1/6-em)]](https://www.rsc.org/images/entities/char_2009.gif) 1) can be progressed to stage 5 of the workflow and the potential for larger-scale crystallisation via slurrying methods can be investigated. In a meso-scale experiment, ca. 1 g of API and co-former, in a 2
1) can be progressed to stage 5 of the workflow and the potential for larger-scale crystallisation via slurrying methods can be investigated. In a meso-scale experiment, ca. 1 g of API and co-former, in a 2![[thin space (1/6-em)]](https://www.rsc.org/images/entities/char_2009.gif) :
:![[thin space (1/6-em)]](https://www.rsc.org/images/entities/char_2009.gif) 1 ratio, were slurried in the minimum volume of ethyl acetate for an extended period. Samples were removed at regular intervals and analysed by PXRD (Fig. S9†). These data confirm that a near-pure sample of the co-crystal is formed after 1 week, confirming that scale-up by slurrying routes is successful for this material. As per the workflow diagram, this would be a facile route to achieve the goal of a bulk powder sample, where no more complicated control of the particle form was required.
1 ratio, were slurried in the minimum volume of ethyl acetate for an extended period. Samples were removed at regular intervals and analysed by PXRD (Fig. S9†). These data confirm that a near-pure sample of the co-crystal is formed after 1 week, confirming that scale-up by slurrying routes is successful for this material. As per the workflow diagram, this would be a facile route to achieve the goal of a bulk powder sample, where no more complicated control of the particle form was required.
![[thin space (1/6-em)]](https://www.rsc.org/images/entities/char_2009.gif) :
:![[thin space (1/6-em)]](https://www.rsc.org/images/entities/char_2009.gif) 1) was attempted, but unfortunately the aqueous solubility level was still very poor and it was challenging to obtain accurate g/g mass fractions. As such, further analysis is not presented.
1) was attempted, but unfortunately the aqueous solubility level was still very poor and it was challenging to obtain accurate g/g mass fractions. As such, further analysis is not presented.
3. MC workflow benchmarking conclusions
The benchmarking experiments have successfully identified and characterised a new MC crystal form of an API material and collected additional data that would inform the design of scale up experiments in other areas of the CMAC consortium effort. These positive outcomes show the usefulness of the workflow decision-making process in guiding the research through the experiment, ensuring all necessary data are collected in a consistent and thorough way.Benchmarking the workflows II: additive control of morphology for isoniazid (IZN)
The additive screening workflow was used to design an additive crystallisation route to control the morphology of isoniazid (IZN), an antibiotic commonly used in the treatment of tuberculosis. IZN generally crystallises with a needle morphology,28 which can cause significant problems for downstream processing steps. By introducing additives into the crystallisation in very low w/w%, the potential exists to modify the resulting morphology of the crystals, towards more processable block-like crystal shapes, while minimising the likelihood of incorporating the additive into the crystal structure.1. Workflow inputs/prerequisites
![[thin space (1/6-em)]](https://www.rsc.org/images/entities/char_2009.gif) :
:![[thin space (1/6-em)]](https://www.rsc.org/images/entities/char_2009.gif) 1, 1
1, 1![[thin space (1/6-em)]](https://www.rsc.org/images/entities/char_2009.gif) :
:![[thin space (1/6-em)]](https://www.rsc.org/images/entities/char_2009.gif) 2, 2
2, 2![[thin space (1/6-em)]](https://www.rsc.org/images/entities/char_2009.gif) :
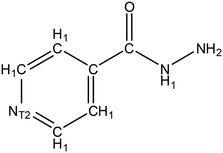
:![[thin space (1/6-em)]](https://www.rsc.org/images/entities/char_2009.gif) 1 etc.), this indicates that this molecule has a strong affinity for the API. Thus, if the same material is employed as an additive in low concentrations (e.g. ∼1% wt/wt) it follows that some interaction between the API and additive may occur. Data mining of IZN structure in the CSD was achieved via a structure search using Fig. 9, in ConQuest, with the following filters employed:
1 etc.), this indicates that this molecule has a strong affinity for the API. Thus, if the same material is employed as an additive in low concentrations (e.g. ∼1% wt/wt) it follows that some interaction between the API and additive may occur. Data mining of IZN structure in the CSD was achieved via a structure search using Fig. 9, in ConQuest, with the following filters employed:
• 3D coordinates must be determined.
• No polymeric structures.
• Only organic structures.
As we require additives to only interact with the API crystal and not alter its composition in any way, we are only interested in co-crystal hits from the CSD and not salts. As such, explicit hydrogen atom assignment was used to preclude the return of salt structures for this search.
The search returned 68 hits, four of which are determinations of the only polymorphic form of IZN published in the CSD at the time of searching (CCDC ref-code based: INICAC). We note that, during the preparation of this article, a new study reporting the discovery of two new metastable polymorphs of IZN has also been published.29 The remaining hits are made up of 41 different MC materials. Of these, the vast majority of API-co-former interactions involved N⋯OH or N⋯COOH hydrogen bonds between the pyridine nitrogen atom on IZN and the co-former.
2. Additive workflow benchmarking
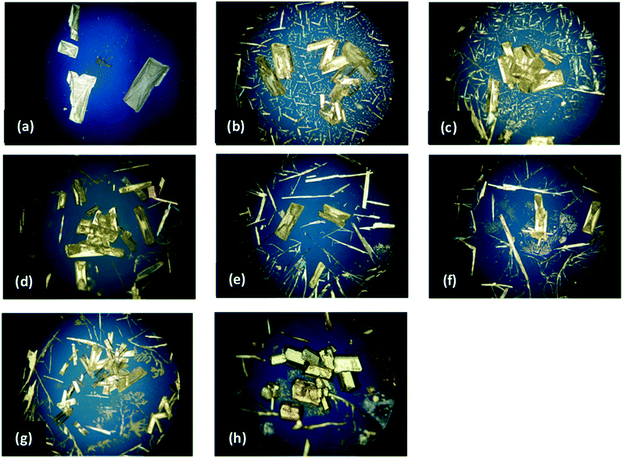
The resulting materials were analysed by PLM to assess any morphology modification. Crystal face-indexing was also performed on a representative crystal using SCXRD methods, to determine the faces contributing to the crystal morphology. These results are then used for later comparison to any additive modified samples. Most solvents produced typical needle-like IZN crystals as expected, crystals grown from propan-2-ol under these conditions formed plate-like morphologies (see Fig. 10 and 11, below). Though plate crystals still present challenges for downstream processing stages, this is a step closer to the target block morphology and so propan-2-ol was chosen as the solvent for further investigation by additive methods. This result outlines the benefits of including stage 1 in the additive workflow, as this apparent solvent control effect can now be separated from any additive effects on IZN morphology going forward.
For molecular complementarity screening, the GRAS co-former library outlined in Table S3† was used, alongside a second library of 30 common, not necessarily GRAS, co-formers generated from chemicals utilised in our laboratory (Table S9, ESI†). As this study was pursued from an academic perspective, the use of non-GRAS additives was less problematic for us as we need not be concerned about the potential for incorporation of very low levels of additive into the crystal structure. Thus, we were able to widen the design space in this way. However, for other studies where even the incorporation of a tiny amount of additive, or adsorption onto the crystal surface, could be problematic, e.g. from an API regulatory perspective, then the use of non-GRAS additives should be considered more carefully. Full details of the screening searches performed are provided in the ESI† (Tables S10 and S11).
In this case, the results of molecular complementarity searches were inconclusive for IZN as screening with both co-former libraries returned a large number of hits, even when all five molecular descriptors were included. To refine the selection further, these hits were cross-referenced with the results of CSD data mining in ConQuest to select a sub-set of additives that both satisfied molecular complementarity screening and are either already known to form co-crystals with IZN, or a co-crystal is known with a closely related molecule (e.g. structural isomers). A final screening step involved consideration of decision 1 of the workflow: are the chosen additives soluble in the solvents used for the optimised non-additive API crystallisation?. Small-scale solubility testing with potential additives in propan-2-ol, and only those that showed sufficient solubility in the chosen crystallisation solvent, and therefore satisfying decision 1, were taken forward.
Following this procedure, a set of seven different additives were short listed for screening: 3-cyanobenzoic acid, 4-cyanobenzoic acid (CSD ref-code TAGNAR), 3-hydroxybenzoic acid (BIDLOP), isonicotinamide (EHOWIH), nicotinamide (NICOAM), 3,4-dihydroxybenzoic acid (WUYNUA) and 3,4-dinitrobenzoic acid (YADKOF).
PLM images for both the pure IZN crystallisation in propan-2-ol from stage 1, and the additive screen in stage 4, are shown in Fig. 10. Visual analysis of the resulting crystal morphologies indicates that there are two promising additive candidates: 3-hydroxybenzoic (Fig. 10(b)) and 3,4-dinitrobenzoic acid (Fig. 10(h)), while all other crystallisations produced plate shaped crystals similar to those observed in the absence of additive (Fig. 10(a)).
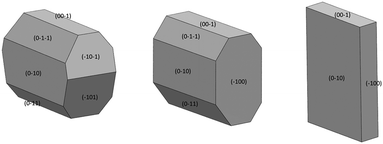
Face-indexing experiments were then carried out with these two candidates, to determine the nature of the morphology changes observed. In all cases, indexing of the unit cell parameters confirmed that no change in the IZN crystal form had occurred on recrystallisation. The results of face-indexing analysis can be visualised through the Mercury BFDH morphology tool, by generating a suitable morphology input file (in CIF format) containing the experimentally-determined crystal face list. The output of this analysis for the IZN additive screen is shown in Fig. 11.
Comparison of the observed crystal faces with the underlying crystal structure allows us to infer some rationale for morphology modification. In general, faces with large areas indicate slow growth in the direction perpendicular to that face,30 which may indicate that molecules present in solution (either additives or solvent) can interact with functional groups present at the surface terminations for that face. Similarly, small faces indicate fast crystal growth along the perpendicular axis. For the plate-like crystals grown from propan-2-ol in the absence of additives, the largest faces are the (010) set, indicating relatively slow growth in the [010], or b-axis, direction in propan-2-ol. In the underlying IZN crystal structure, C11(8) one-dimensional chains of IZN molecules, linked by discrete NH⋯N(py) hydrogen bonds, extend parallel to the [010] direction (see Fig. S11†), indicating that crystal growth along [010] proceeds via the formation of these interactions. As such, the results suggest that propan-2-ol acts to slow the formation of these hydrogen bonds, possibly via interaction between the alcohol OH groups and the pyridine nitrogen atoms on IZN. By contrast, smaller (100) and (001) faces indicate faster growth of IZN along the a- and c-axis directions in propan-2-ol. These correlate with the formation of C(3) chains formed of discrete NH⋯N interactions between adjacent hydrazine moieties along [100], and π-system stacking interactions along [001].
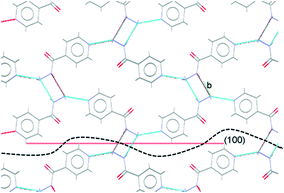
For crystals grown in the presence of 3-hydroxybenzoic acid, an increase in the area of the (100) faces is observed, leading to a more block-like crystal shape. This would indicate slower growth in the [100] direction, which may be the result of preferential interaction between the additive and IZN functional groups at the (100) surface terminations. Visualisation of the (100) plane overlaid with the underlying IZN crystal structure in Mercury suggests that likely surface terminations for the (100) face would expose the hydrazine NH groups (Fig. 12). We stress that this rationale is an approximation, as single crystal data represents the bulk structure and provides us with no direct surface chemistry information. Instead, we can infer possible real surface terminations at the (100) faces (e.g. black dashed lines in Fig. 12) by considering that the (100) plane intersects the NH⋯N hydrogen bonds involving hydrazine, thus a natural cleavage point for this face would break these intermolecular interactions and expose the hydrazine groups. Here, we assume real surface terminations will only break intermolecular interactions and covalently bonded molecular species remain intact. Thus, from this analysis a potential route for morphology modification can be hypothesised; that 3-hydroxybenzoic acid can interact with the hydrazine NH groups at the (100) surfaces of IZN, thus limiting the growth along [100] and effecting a change in the crystal shape.
The situation is similar for crystals grown in the presence of 3,4-dinitrobenzoic acid. Here, the growth is also slowed along the [100] direction, in comparison to the plates formed in the absence of additive, although the exposed faces are identified as the (−101) and (−10−1) sets. Visualisation of these planes overlaid with the underlying crystal structure in Mercury (Fig. S12†) also indicate that the hydrazine NH groups are likely to be exposed at the surface terminations for these faces, leading to a similar rationale for morphology changes.
At this stage of the workflow decision 3 must be considered: does analysis indicate a change in the targeted property (e.g. solid form/morphology/PSD etc.) in the presence of each additive candidate? As two successful additives have been identified in the experiments carried out with IZN, the answer to decision 3 is yes. Both the 3-hydroxybenzoic acid and the 3,4-dinitrobenzoic acid experiments can be deemed successful and taken through to the next stages of the workflow. The remainder of the additives were unsuccessful and can be discarded at this point.
![[thin space (1/6-em)]](https://www.rsc.org/images/entities/char_2009.gif) :
:![[thin space (1/6-em)]](https://www.rsc.org/images/entities/char_2009.gif) additive ratio and the design of scaled-up crystallisations, aiming towards a viable industrial scale crystallisation route. These stages of the workflow are more suited to later stage experimental efforts within the CMAC group, and the experiments will be the focus of a subsequent publication.
additive ratio and the design of scaled-up crystallisations, aiming towards a viable industrial scale crystallisation route. These stages of the workflow are more suited to later stage experimental efforts within the CMAC group, and the experiments will be the focus of a subsequent publication.
3. Additive workflow benchmarking conclusions
The benchmarking experiments have successfully identified two additives that can successfully modify the morphology of the target API IZN, and the morphology changes have been characterised and rationalised by considering the underlying crystal structure. These positive outcomes again confirm the usefulness of the workflow decision-making process to guide the researcher through the experiment and, in particular, highlight how implementation of CCDC software tools facilitates the decision-making process at all stages of the workflow.Conclusions
The research presented has shown that the workflow approach provides a logical and structured approach to two important aspects of pharmaceutical materials discovery and primary crystalline particle control, contributing to physical property optimisation and downstream processability. The workflows presented are compatible with a reproducible approach to process design that harnesses strengths of experimental data while also benefiting hugely from informatics-based approaches, such as those available in the CSD, to enhance their value.Critical to the workflows discussed here, these early interventions at the primary particle stage (the initial solid form crystallisation) can, in the context of pharmaceutical manufacturing, reduce process steps, minimise downstream processing, allow for efficient process design by focusing on optimised primary solid form and primary particle control, and allow for design of optimised particle properties. Efficient methods for evaluating the potential efficacy of such process steps are vital, as these (here, MC crystals and use of additives) are often considered as “additional options” that may not be a first choice for process development but which may give key benefits if assessed fully at an early stage.
These workflows place rational early stage crystallisation design at the heart of end-to-end process design and integration, potentially allowing for the reduction of experimental screening by establishing effective digital/informatics-based approaches and allowing multi-component materials and additive design to take processing and regulatory requirements fully into account. The million-plus structures and associated tools available within the CSD can play a substantial role in such efforts.
Integrating these capabilities into automated digital-driven workflow assessment and the creation of end-to-end processes is a key future aim of the CMAC consortium, to which the presented Workflow developments are contributing.
Conflicts of interest
There are no conflicts to declare.Acknowledgements
This research was funded under the EPSRC grant EP/P006965/1 and by a University of Bath studentship (PP). The authors would like to thank CMAC colleagues at Strathclyde, Leeds and Loughborough and both Dr. Pete Wood and Dr. Andy Moloney at the CCDC for valuable discussions.Notes and references
- J. Chen, B. Sarma, J. M. B. Evans and A. S. Myerson, Cryst. Growth Des., 2011, 11, 887 Search PubMed.
- J. W. Mullin, Crystallization, Elsevier Science, 2001 Search PubMed.
- EPSRC Future Manufacturing Hub in Continuous Manufacturing and Advanced Crystallisation, https://www.cmac.ac.uk/ [Accessed 23 June 2020].
- C. J. Brown, T. McGlone, S. Yerdelen, V. Srirambhatla, F. Mabbott, R. Gurung, M. L. Briuglia, B. Ahmed, H. Polyzois, J. McGinty, F. Perciballi, D. Fysikopoulos, P. MacFhionnghaile, H. Siddique, V. Raval, T. S. Harrington, A. D. Vassileiou, M. Robertson, E. Prasad, A. Johnston, B. Johnston, A. Nordon, J. S. Srai, G. Halbert, J. H. ter Horst, C. J. Price, C. D. Rielly, J. Sefcik and A. J. Florence, Mol. Syst. Des. Eng., 2018, 3, 518 Search PubMed.
- S. D. Schaber, D. I. Gerogiorgis, R. Ramachandran, J. M. B. Evans, P. I. Barton and B. L. Trout, Ind. Eng. Chem. Res., 2011, 50, 10083 Search PubMed.
- K. Plumb, Chem. Eng. Res. Des., 2005, 83, 730 Search PubMed.
- Novartis-MIT Center for Continuous Manufacturing, https://novartis-mit.mit.edu/ [Accessed 23 June 2020].
- C. R. Groom, I. J. Bruno, M. P. Lightfoot and S. C. Ward, Acta Crystallogr., Sect. B: Struct. Sci., Cryst. Eng. Mater., 2016, 72, 171 Search PubMed.
- F. Kesisoglou and Y. Wu, AAPS J., 2008, 10, 516 Search PubMed.
- G. R. Desiraju, Angew. Chem., Int. Ed. Engl., 1995, 34, 2311 Search PubMed.
- U.S. Department of Health and Human Services Food and Drug Administration, Center for Drug Evaluation and Research, Regulatory Classification of Pharmaceutical Co-Crystals Guidance for Industry, USA, 2018 Search PubMed.
- A. S. Myerson and R. Ginde, in Handbook of Industrial Crystallization, ed. A. S. Myerson, Butterworth-Heinemann, 2002, ch. 2, pp. 33–65 Search PubMed.
- M. A. Lovette and M. F. Doherty, Cryst. Growth Des., 2013, 13, 3341 Search PubMed.
- S. Datta and D. J. Grant, Nat. Rev. Drug Discovery, 2004, 3, 42 Search PubMed.
- T. D. Turner, L. E. Hatcher, C. C. Wilson and K. J. Roberts, J. Pharm. Sci., 2019, 108, 1779 Search PubMed.
- L. E. Hatcher, W. Li, P. Payne, B. Benyahia, C. D. Rielly and C. C. Wilson, Cryst. Growth Des., 2020, 20(9), 5854–5862 Search PubMed.
- K. E. Wittering, L. R. Agnew, A. R. Klapwijk, K. Robertson, A. J. P. Cousen, D. L. Cruickshank and C. C. Wilson, CrystEngComm, 2015, 17, 3610 Search PubMed.
- V. López-Mejías, J. W. Kampf and A. J. Matzger, J. Am. Chem. Soc., 2012, 134, 9872 Search PubMed.
- S. Cesur and S. Gokbel, Cryst. Res. Technol., 2008, 43, 720 Search PubMed.
- W. Nurhikmah, Y. C. Sumirtapura and J. S. Pamudji, Sci. Pharm., 2016, 84, 181 Search PubMed.
- L. Fábián, Cryst. Growth Des., 2009, 9, 1436 Search PubMed.
- Generally Regarded as Safe (GRAS): US Food and Drug Administration, https://www.fda.gov/food/food-ingredients-packaging/generally-recognized-safe-gras [Accessed 23 June 2020].
- I. Miroshnyk, S. Mirza and N. Sandler, Expert Opin. Drug Delivery, 2009, 6, 333 Search PubMed.
- L. Fábián, N. Hamill, K. S. Eccles, H. A. Moynihan, A. R. Maguire, L. McCausland and S. E. Lawrence, Cryst. Growth Des., 2011, 11, 3522–3528 Search PubMed.
- National Center for Biotechnology Information. PubChem Database. Flufenamic acid, CID=3371, https://pubchem.ncbi.nlm.nih.gov/compound/Flufenamic-acid [accessed 27 May 2020].
- National Center for Biotechnology Information. PubChem Database. 2,2′-Bipyridine, CID=1474, https://pubchem.ncbi.nlm.nih.gov/compound/2_2_-Bipyridine [accessed 27 May 2020].
- National Center for Biotechnology Information. PubChem Database. Benzoic acid, CID=243, https://pubchem.ncbi.nlm.nih.gov/compound/Benzoic-acid [accessed 27 May 2020].
- S. R. Kennedy, C. D. Jones, D. S. Yufit, C. E. Nicholson, S. J. Cooper and J. W. Steed, CrystEngComm, 2018, 20, 1390 Search PubMed.
- K. Zhang, N. Fellah, A. G. Shtukenberg, X. Fu, C. Hu and M. D. Ward, CrystEngComm, 2020, 22, 2705 Search PubMed.
- A. R. Klapwijk, E. Simone, Z. K. Nagy and C. C. Wilson, Cryst. Growth Des., 2016, 16, 4349 Search PubMed.
Footnotes |
| † Electronic supplementary information (ESI) available: Workflow methodology, further experimental information and characterisation data. CCDC 2011326. For ESI and crystallographic data in CIF or other electronic format see DOI: 10.1039/d0ce00898b |
| ‡ Invited paper for CrystEngComm (ACS Fall, 2019, San Diego, CSD Million Structures Symposium). |
| § CCDC is a partner in the CMAC consortium. |
| This journal is © The Royal Society of Chemistry 2020 |

