 Open Access Article
Counter-ion influence on the mechanism of HMTA-mediated ZnO formation†
Mark M. J.
van Rijt
 ,
Bernette M.
Oosterlaken
 ,
Rick R. M.
Joosten
,
Levina E. A.
Wijkhuijs
,
Rick R. M.
Joosten
,
Levina E. A.
Wijkhuijs
 ,
Paul H. H.
Bomans
,
Heiner
Friedrich
,
Paul H. H.
Bomans
,
Heiner
Friedrich
 and
Gijsbertus
de With
 *
*
Laboratory of Physical Chemistry, Center for Multiscale Electron Microscopy, Department of Chemical Engineering and Chemistry, Eindhoven University of Technology, P. O. Box 513, 5600 MB Eindhoven, The Netherlands. E-mail: G.deWith@tue.nl
First published on 11th August 2020
Abstract
Crystalline materials are often formed via transient phases. Here we focus on ZnO as a widely used and investigated material for technological applications. Although the literature for the wet chemical synthesis of ZnO is extensive, its formation pathway using these strategies has gained limited attention so far and is poorly understood. To gain insight into these pathways, a HMTA-mediated ZnO synthesis protocol with a variety of zinc salts was employed using in situ pH measurements combined with discrete cryoTEM and SEM sampling studies, in addition to more typical pXRD and SEM product analysis. These results indicate a significant counter-ion effect on the reaction product. Using acetate, nitrate, chloride and sulphate as counter-ions all result first in the formation of a layered zinc hydroxy salt (LZHS), the exact composition of which depends on the counter-ion. Rather stable LZHSs are formed using chloride and sulphate, preventing the eventual formation of ZnO. Only acetate and nitrate result in the formation of ZnO. For acetate, ZnO is preferably grown in-dispersion, while for nitrate it is formed on exposed solid interfaces to the reaction medium (on-surfaces). For the latter the nucleation of its LZHS precursor requires an additional incubation time, resulting in heterogeneous nucleation instead.
Introduction
Non-classical crystallization pathways, i.e. the multi-step progression from transient phases1 have been observed for multiple minerals including magnetite,2 hydroxy apatite3 and calcium carbonate.4 Similarly, for the synthesis of zinc oxide (ZnO) under aqueous conditions, it is generally accepted that either zinc hydroxide5–8 or layered zinc hydroxy salts (LZHS)9–13 are formed as a transient phase.A common strategy for the formation of high quality ZnO uses the gradual thermal decomposition of hexamethylenetetramine (HMTA) into ammonia and formaldehyde, where after the ammonia reacts with water resulting in the formation of hydroxide. The released hydroxide is subsequently consumed resulting in the formation of ZnO after several hours at temperatures above 60 °C.9,10,14,15 The thermal decomposition rate of HMTA increases with the concentration of protons in the system, making the release of hydroxide in the system pH dependent.16 Several ex situ studies on the mechanism of ZnO formation have been conducted using both zinc acetate9,10,13,14 and zinc nitrate10,17–20 as a zinc source. For these reactions either layered basic zinc acetate (LBZA, Zn5(OH)8(CH3COO)2·2H2O) or layered basic zinc nitrate (LBZN, Zn5(OH)8(NO3)2·2H2O) have been observed in the early reaction stages, suggesting they are transient species. It has been postulated by Jang et al.13 that these LZHS act as a seeding template for ZnO dumbbell structures that are frequently formed in dispersion. In situ studies have been performed including LPTEM14,21 and STXM,22 focussing on the growth stage, and XANES,7 showing the initial formation of [Zn(OH6)]2+ instead of LZHS.
The formation of ZnO using HMTA is not limited to the use of zinc acetate or zinc nitrate, as other zinc salts such as zinc N-dodecyl-N,N-dimethylammonioacetic bromide,11 zinc formate,5 zinc chloride23,24 and zinc sulphate,25 have been successfully used. However, only a few papers used similar reaction conditions for different zinc salts to investigate the influence of the counter-ion5,23 so that a general understanding of the counter-ion role during the ZnO formation is currently lacking. To date counter-ions are mainly described as capping agents, e.g. resulting in the formation of hexagonal platelets when using zinc sulphate, in contrast to the typically formed hexagonal rods for >4 nm ZnO crystals.25–27 Given the observation of counter-ion specific intermediates, it is highly likely that the counter-ion will have a significant influence on the reaction.
Here we investigate the influence of various zinc counter-ions on the formation of ZnO using a mild HMTA-based reaction strategy. We show that the selection of the counter-ion has a strong influence on the process and the final reaction product. Furthermore, for the formation of ZnO the counter-ion, dependent on reaction conditions, can direct the growth of ZnO in-dispersion or on-surfaces. Finally, in situ pH measurements are combined with discrete cryoTEM and SEM sampling to gain insight in the underlying formation mechanism of ZnO.
Results and discussion
Counter-ion influence on the reaction product
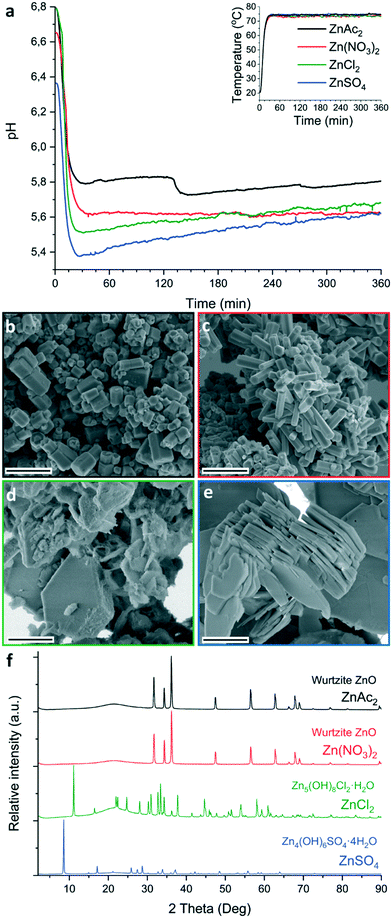
The influence of zinc counter-ions on ZnO crystallization was investigated using a protocol similar to Ou et al.28 In brief, by reacting 50 mM zinc salt and 25 mM hexamine (HMTA) in pure water at 80 °C for 6 h at ambient pressure, see ESI† section 1. Four different zinc salts were investigated: zinc acetate (ZnAc2), chloride (ZnCl2), nitrate (Zn(NO3)2) and sulphate (ZnSO4). In all cases a white precipitate was obtained after the reaction (Fig. S1†). For Zn(NO3)2 the precipitate formed dominantly on the flask wall and on the pH probe, resulting in a clear solution. In contrast, for the other three salts most (all in the case of ZnSO4) of the precipitate was formed in dispersion.For all zinc salts, in situ pH measurements (Fig. 1a) showed an initial rapid decrease in pH with increasing reaction temperature. The observed pH minima show a counter-ion dependence with the highest pH minima being observed for ZnAc2 (5.8) followed by Zn(NO3)2 (5.6), ZnCl2 (5.5) and ZnSO4 (5.4). Following the initial drop in pH, a stabilization or gradual increase in pH is observed over time. Only when ZnAc2 is used this constant pH trend is interrupted by a distinct second drop in pH of 0.1–0.2 pH points. This drop is typically observed after 2 h reaction time (ESI† section 3). After 6 h reaction time the pH of the reaction solution has raised to 5.8 for ZnAc2, 5.7 for ZnCl2 and 5.6 for both Zn(NO3)2 and ZnSO4.
The morphologies and crystallinity of the purified reaction products were investigated using SEM (Fig. 1b–e) and pXRD (Fig. 1f). For both ZnAc2 and Zn(NO3)2 hexagonal pillar-shaped wurtzite ZnO crystals were formed. Use of ZnAc2 typically resulted in a dumbbell structure. The reactions using ZnCl2 and ZnSO4 resulted in the formation of frequently hexagonally faceted plate-shaped crystals of Zn5(OH)8Cl2·H2O (LBZC) and29 Zn4(OH)6SO4·4H2O (LBZS), respectively.30 The plate-shaped crystals are not dissimilar to crystals observed by Govender et al.5 Thus for ZnCl2 and ZnSO4 no evidence of ZnO formation was observed using pXRD and this was supported by the observation of only one morphology by SEM. When comparing the reaction pH profiles, it can be observed that for ZnCl2 and ZnSO4 the reaction pH is slightly lower than when using the ZnO forming zinc salts. Furthermore, when ZnO pillars formed from ZnAc2 and Zn(NO3)2 were left in the reaction solution for over 24 h, they became hollow (Fig. S2†). This is indicative of pH-induced etching due to prolonged exposure to the low pH reaction solution at RT after synthesis.31 This suggests that the reaction pH when using ZnAc2 and Zn(NO3)2 is close to the pH stability limit of ZnO. In an attempted to raise the reaction pH, base (0.1 M ammonia) was added dropwise to the ZnSO4 reaction. This led to the formation of a white precipitate at RT without resulting in an increase in pH. After performing the reaction, pXRD showed the formation of a mixture of zinc hydroxy sulphate salts (Fig. S3†). As an alternative to raise the reaction pH, the reaction temperature was lowered for both ZnCl2 and ZnSO4. This increased the observed minima in reaction pH to 5.7 and 5.8, respectively (Fig. S4a†). After purification pXRD analysis still showed the dominant formation of LBZC and LBZS without any evidence for ZnO formation (Fig. S4b†). This indicates that the reaction pH is not the main cause for the formation of LZHS instead of ZnO when using ZnCl2 or ZnSO4.
Mechanism of HMTA-mediated ZnO formation in dispersion
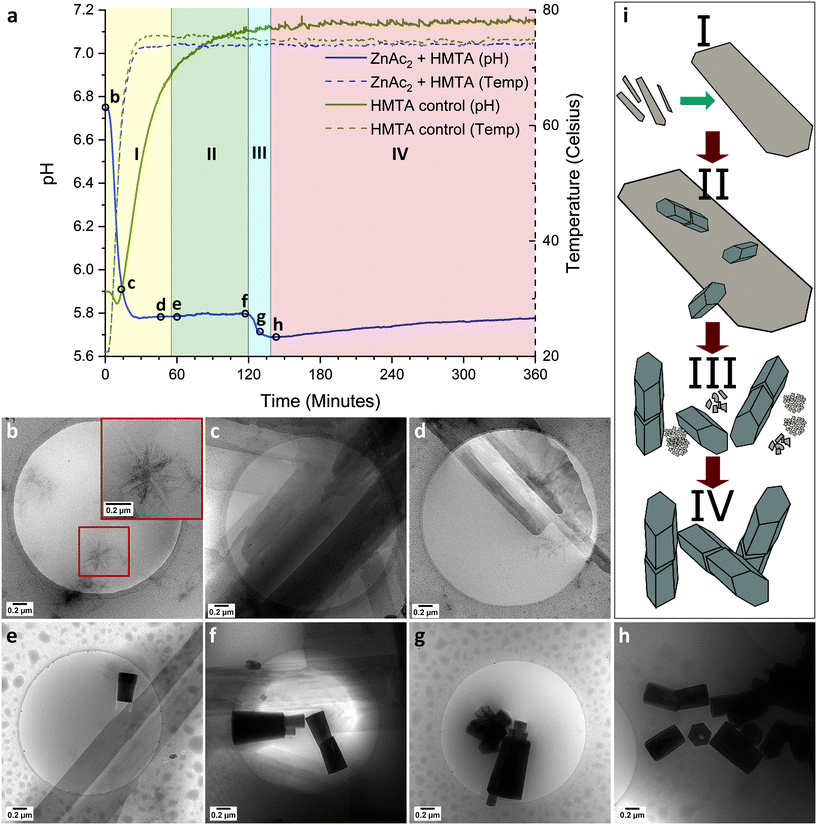
To understand how ZnAc2 transforms in dispersion into ZnO, discrete cryoTEM sampling studies were conducted (Fig. 2). Given that the features in the pH curve tend to shift in time between experiments due to the stochastic nature of nucleation and crystallization (ESI† section 3), cryoTEM sampling points are chosen and indicated based on curve features rather than absolute time points (Fig. 2aI). Dissolving ZnAc2 and HMTA in water yielded a transparent solution. CryoTEM prior to the start of the reaction showed the presence of ∼200 nm sized sheets (Fig. 2b). These sheets tend to orient with the TEM grid and are predominantly observed in clusters. Low dose selected area electron diffraction (LDSAED) of such clusters showed the presence of two diffuse rings originating from vitreous water and three faint but sharp rings, which include stronger diffraction spots, matching the (010), (![[1 with combining macron]](https://www.rsc.org/images/entities/char_0031_0304.gif) 20) and (020) spacing of either wurtzite ZnO or LBZA (Fig. 3 and S5†). When the temperature is gradually increased to initiate the reaction, cryoTEM imaging shows that the lateral size of the sheets increases significantly (Fig. 2c) concomitant with a decrease in pH from 6.8 to 5.8. LDSAED shows that these sheets are single crystals (Fig. S5b and e†), in agreement with previous observations on LBZA,32,33 with a preferred growth in the [010] direction. The maxima of the most prominent diffraction signals match with those of the ∼200 nm sheets (Fig. 3). This clearly shows that LBZA is formed when dissolving the reactants prior to the start of the reaction at RT. Upon temperature increase, which initiates the reaction, growth of LBZA sheets accelerates resulting in increased hydroxide consumption and a concomitant decrease in pH.
20) and (020) spacing of either wurtzite ZnO or LBZA (Fig. 3 and S5†). When the temperature is gradually increased to initiate the reaction, cryoTEM imaging shows that the lateral size of the sheets increases significantly (Fig. 2c) concomitant with a decrease in pH from 6.8 to 5.8. LDSAED shows that these sheets are single crystals (Fig. S5b and e†), in agreement with previous observations on LBZA,32,33 with a preferred growth in the [010] direction. The maxima of the most prominent diffraction signals match with those of the ∼200 nm sheets (Fig. 3). This clearly shows that LBZA is formed when dissolving the reactants prior to the start of the reaction at RT. Upon temperature increase, which initiates the reaction, growth of LBZA sheets accelerates resulting in increased hydroxide consumption and a concomitant decrease in pH.
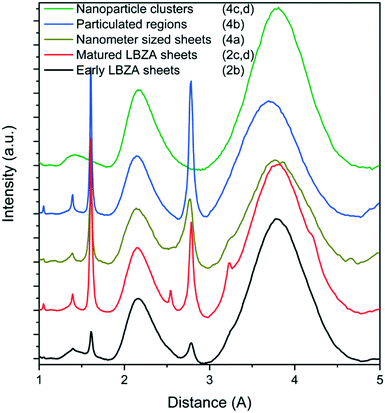 | ||
| Fig. 3 Radial averaged LDSAED data at different time points showing the initially observed small ∼200 nm LBZA (black), the large “matured” LBZA sheets (red) and species observed after the second pH drop; nanometer-sized sheets (gold), high-contrast particulated regions (blue), and amorphous nanoparticle clusters (green). The full LDSAED patterns are shown in Fig. S5.† | ||
The initial pH drop lasts for about 30 min when the temperature has reached approximately 75 °C. Thermal decomposition of HMTA, which starts at 50 °C, does not impact the slope of the pH drop. This suggests that the hydroxide, released by HMTA decomposition – ammonia formation – is immediately consumed by the formation of LBZA. Subsequently, the pH stabilizes close to 5.8 with only a slight increase being observed in time. At the beginning of the first pH plateau, LBZA sheets with a width of over 1 μm in some cases (Fig. 2d) can be regularly observed by cryoTEM. It should be noted that even at this stage small nanometer-sized sheets, like those observed at RT, are still present.
CryoTEM imaging at 60 min reaction time shows that the LBZA sheets have even further increased in size, with some having a width of more than 5 μm (Fig. 2e and f and S6†). From this timepoint onward, ZnO pillars can be observed in dispersion using cryoTEM (Fig. 2aII), suggesting that the ZnO nucleation takes place after formation of large LBZA sheets. Given above findings and the similar lattice spacings of wurtzite ZnO and LBZA, it seems reasonable to assume that LBZA plays a role in the formation of ZnO. However, cryoTEM provides no direct evidence for this hypothesis. Furthermore, it is striking that the formation of ZnO crystals does not rapidly consume all available LBZA, in fact, it seems that LBZA sheets continue to increase in size during the nucleation and initial growth of ZnO pillars.
The first pH plateau ends with a spontaneous second decrease in pH (Fig. 2aIII). Under typical reaction conditions this pH drop occurs after about 2 h reaction time. Surprisingly, during cryoTEM sampling experiments this pH drop occurred earlier (as early as 75 min reaction time), and in several cases directly after sampling (ESI† section 3) as will be discussed in more detail later. The spontaneous decrease in pH, which consequently will again accelerate the proton catalyzed decomposition of HMTA and subsequent release of hydroxide,34 can only be explained by a spontaneous increase in the consumption of hydroxide by the reaction.
After the onset of this second pH drop no rectangular shaped LBZA crystals were observed by cryoTEM (Fig. 2g and 4), indicating that the pH drop corresponded with a rapid decrease in the number of LBZA crystals present. Simultaneously, the size of ZnO crystals increased from 470 ± 330 nm to 660 ± 380 nm in length during the first 9 minutes of the pH drop (Fig. S7 and S8†), while the aspect ratio stayed almost constant at 2.4 vs. 2.3, respectively. Simplifying the shape of ZnO crystals as cylinders, this corresponds to a ZnO volume increase of 2.8 times. At the end of the second pH drop (27 min in the process), a ZnO rod length of 650 ± 250 nm is measured with an aspect ratio of 2.2. This shows that ZnO crystal growth is most pronounced at the start of the second pH drop. Given that LBZA contains hydroxide moieties, spontaneous dissolution of LBZA would result in a strong pH increase. The rapid increase in ZnO size and the corresponding decrease in pH indicate that the LBZA is not gradually dissolved, but instead rapidly consumed by accelerated ZnO crystal growth.
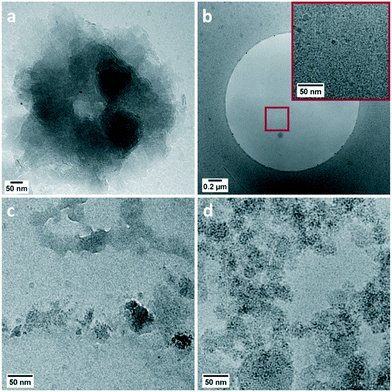 | ||
| Fig. 4 CryoTEM images of phases observed throughout the second drop in pH including: folded sheets (a), high-contrast particulated regions (b) and clusters of nanoparticles (c and d). | ||
Although ZnO has become the main phase after the onset of the second pH drop, other transient phases are present. Throughout the pH decrease a variety of coexisting phase are observed including folded sheets (Fig. 4a) and high contrast regions, that appear to be particulated on a higher magnification (Fig. 4b). LDSAED of both phases matches with the earlier observed LBZA spacings (Fig. 3). Furthermore, clusters of amorphous nanometer-sized particles are also observed at multiple time points (Fig. 3 and 4c and d).
After the end of the second pH drop a gradual increase in pH is observed. For this stage cryoTEM shows that ZnO is the dominant species present (Fig. 2h). This matches pXRD data obtained after 6 h reaction time (Fig. 1f). During this time period, base will still be released by HMTA decomposition, whereas the pH only gradually increases from 5.8 to 5.7 (Fig. 2aIV). The remainder of the released base is likely consumed by the growth of the ZnO crystals present.
By using cryoTEM sampling only a fraction of the reaction volume can be investigated. Due to this fact, only local information is obtained at a specific time point. Therefore, to confidently track the evolution in sample composition accurately in a relatively small timeframe it is imperative that the transition process occurs uniformly throughout the reaction. Given that for a fast and spontaneous disintegration process a uniform transition is unlikely, it is impossible to confidently chart the disintegration of the LBZA using cryoTEM sampling. This explains the observation of the coexisting transient phases. In fact, one of the sampling points taken close to the end of the second pH drop, shows the dominant presence of nanometer-sized particle clusters (ESI† section 3, Fig. 4d) which could correspond with a relative early stage of the disintegration process. These clusters are accompanied by small highly particulated sheets, which possibly correspond to the transition of LBZA into this particle phase. If the LBZA sheets would disintegrate into nanometer-sized particles, this could partially explain the spontaneous rapid decomposition of the species. These particles would be rapidly consumed by present crystals in dispersion, resulting in a rapid size increase for both species.
This leaves the question why the LBZA sheets would spontaneously and rapidly start to disintegrate and how this is accelerated by cryoTEM sampling experiments. The most probable reason is mechanical breaking of the LBZA sheets. LBZA sheets grow throughout the reaction and it is known that crystalline materials are more prone to brittle fracture with increasing size due to the occurrence of crystal defects.35,36 When the crystal size surpasses this critical size, brittle fracture will occur due to stress exposure, resulting in shattering of the LBZA sheets. The resulting disintegration of some LBZA sheets will feed and accelerate the growth of other LBZA sheets and ZnO crystals in dispersion. These expanded LBZA sheets will also surpass the critical size and disintegrate, effectively resulting in a rapid autocatalytic collapse of the entire LBZA phase. In contrast, the ZnO crystals grown remain stable, resulting in the formation of a pure ZnO phase as observed by pH measurements and cryoTEM sampling. Given that growth rates will be similar for every reaction, the onset of this autocatalytic fracturing can be expected to occur at about the same reaction time, matching observations. When performing cryoTEM sampling, additional strain is added to the system, fracturing some LBZA sheets and expediting the process.
The influence of layered hydroxy salts
Similar to the use of ZnAc2, the use of Zn(NO3)2 resulted in the formation of ZnO. However, in contrast to the other zinc salts used, the Zn(NO3)2 reaction product is predominantly formed on solid interfaces submerged in the reaction solution (on-surface growth) e.g. reaction flask and pH probe. CryoTEM sampling was used to investigate the particles formed in dispersion at both 15 and 30 min reaction time. Particles were only incidentally observed in dispersion (Fig. S9†), suggesting that during the early reaction stages most of the hydroxide is consumed by the formation of either soluble zinc hydroxide or on-surface crystal growth.To investigate if on-surface crystal growth occurs during the early stages, SEM was performed on cleaned glass plates (without a seed layer) submerged for a specific time in the reaction medium (Fig. 5). After 15 min reaction time micrometer-sized crystals were observed on the glass surface (Fig. 5a). The diameter of the particles significantly increased with reaction time (30–45 min, Fig. 5b and S10†), showing that the inserted hydroxide in the reaction is consumed by the formation of crystal growth on the glass surface. Many of these crystals have a rhombic shape, which is an atypical shape for both ZnO and LZHS, but it excellently matches with wulfingite zinc hydroxide as observed by McBride et al.6 The absence of LZHS species under mild condition is not unique as McPeak et al.7 also showed a zinc hydroxide intermediary when using seeded ZnO growth from Zn(NO3)2. In the presence of ZnAc2 after 30 min reaction time no crystal growth can be observed by SEM on the glass surface (Fig. S11†). After 180 min the surface was covered with ZnO pillar structures (Fig. 5c and d). These hexagonal pillars are significantly smaller than the initially observed crystals implying a transition via a dissolution–reprecipitation mechanism or their overgrowth with ZnO crystals as the reaction progresses. They also lack a preferred growing orientation which is due to the absence of an epitaxial seeding layer.37
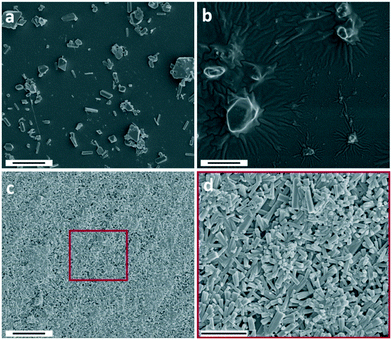 | ||
| Fig. 5 SEM images of the Zn(NO3)2 reaction product on glass plates at 15 min (a), 45 min (b) and 180 min (c and d). Scale bars are 5 μm (a–c) and 3 μm (d). A lower magnification image of (b) is shown in Fig. S10.† | ||
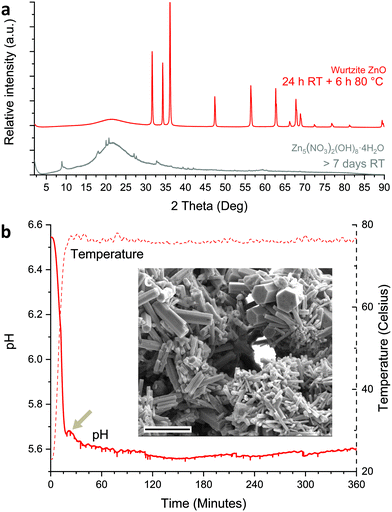
Discrete SEM sampling experiments provided no reasonable evidence for the formation of LBZN as a precursor for the observed surface grown ZnO crystals. Liang et al.10 observed the initial formation of LBZN in dispersion by using a 24 h incubation period at RT. Therefore, to stimulate the formation of LBZN a similar 24 h incubation time was introduced. This resulted in a gradual reduction of the starting pH from roughly 6.8 to 6.5 yet yielding a clear solution (Fig. S12a†). Increasing this incubation time to several days results in the formation of a white precipitate. This matches with LBZN characteristics according to pXRD (Fig. 6a and S12b†), confirming its formation. Performing the reaction after 24 h incubation time a turbid dispersion was obtained (Fig. S13†). pH measurements (Fig. 6b) showed a second drop in pH at 25 min reaction time near the end of the typical initial pH drop. After purifying the dispersed product, pXRD and SEM (Fig. 6a and c) confirmed the formation of wurtzite ZnO in-dispersion. This shows that, for Zn(NO3)2 the preferred in-dispersion versus on-surface nucleation and growth of ZnO can be controlled by stimulating the formation of LBZN as a transient phase.
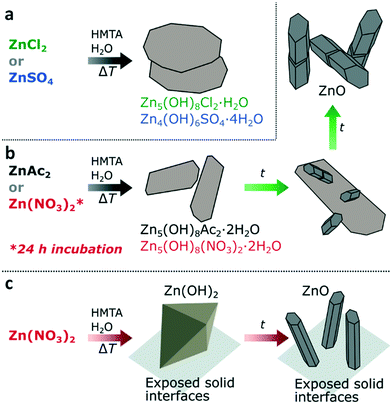
Considering the observations for all the studied zinc salts, when using ZnAc2, ZnCl2 or ZnSO4, LZHS crystals are rapidly formed under standard reaction conditions, however, only for ZnAc2 this LZHS phase transits into ZnO (Fig. 7a and b). Given the rapid formation of all three LZHS species their respective energy barriers are expected to be low and therefore a likely explanation for variation in evolution is the stability of these three transient phases. Although all three LZHS species can be transformed in ZnO under dry conditions by heating, this transition occurs for LBZA at 90 °C,32,33,38 whereas for LBZC 160 °C and LBZS 225 °C are required, implying their greater stability.29,30,39 Additionally, when ZnO is formed in the presence of LBZA, it does not directly result in the consumption of LBZA (Fig. 7b). As shown above, LBZA initially continues to mature in the presence of ZnO, showing that ZnO is thermodynamically stabile in the same range as LBZA. Given the higher stability of LBZC and LBZS precursors compared to LBZA, this could explain why these phases do not easily transform into ZnO. This does not preclude that ZnCl2 and ZnSO4 can be used to form ZnO via a HMTA-mediated precipitation, as this has been achieved,5,23,25 but it does show that these systems will likely be more sensitive to specific reaction conditions and that their transition into ZnO might be less straightforward.
When using Zn(NO3)2, ZnO can be formed in-dispersion after the initial formation of LBZN, suggesting a similar mechanism as for the formation of ZnO from ZnAc2 (Fig. 7b). However, in the absence of an initial incubation period at RT, the formation of LBZN is limited compared to the heterogeneous nucleation and growth of zinc hydroxide on solid interfaces exposed to the reaction solution (Fig. 7c). This implies that either the energy barrier for LBZN nucleation is relatively high compared to the other LZHS or that the present nitrate molecules promote the formation of zinc hydroxide. Based on available data neither hypothesis can be excluded. In the absence of LBZN formation, hexagonal wurtzite ZnO pillars are still formed, but they are predominantly formed on surfaces present, resulting in a non-measurable quantity in the dispersion. A possible cause for this is the high concentration of zinc and hydroxide near the solid interfaces. As discussed previously, a more likely alternative is that both LBZN and LBZA play a role as ZnO nucleation template. This is supported by the similar shape, similar hexagonal spacings in the (001) plane of both species and that the main growth direction of the ZnO crystals is perpendicular to that of the LZHS sheets. The observed occurrence of ZnO nucleation in the presence of LBZA, when using ZnAc2, further supports this hypothesis.
Conclusions
We have shown that for the formation of ZnO in-dispersion, a LZHS transient phase is required. The stability of this transient phase, which depends on reaction chemistry and conditions, is an essential parameter to be considered. A too stable phase, as in the case of LBZC and LBZS, can prevent the transition of this transient phase into ZnO. For LBZA under the investigated reaction conditions, pure ZnO can be formed in-dispersion. Initially, LBZA is formed, followed by a gradual formation of ZnO. During the initial formation of ZnO crystals, the LBZA crystals keep growing resulting in micrometer-sized rectangular sheets. These LBZA sheets then rapidly disintegrate (most likely by brittle fracture) resulting in an acceleration of ZnO growth. It is highly likely that the LBZA initially present acts as a nucleating template for the formation of ZnO. For Zn(NO3)2 initial formation or suppression of LBZN can be stimulated (aging), resulting either in ZnO dominantly formed as dispersed particles or particles on-surfaces. This not only implies that there are multiple paths for the formation of ZnO under mild reaction conditions, it also shows that the counter-ion has a strong effect on the formation and stability of the transient phases, in turn influencing the final reaction product and its nucleation location.Funding sources
This project received funding by a TopPunt grant (Bi-Hy, 718.016.003) of the Netherlands Organization for Scientific Research (NWO).Conflicts of interest
There are no conflicts to declare.Acknowledgements
The authors would like to thank Prof. Nico A. J. M. Sommerdijk (Radboud UMC, Nijmegen) for the scientific discussions during the early stages of this work.Notes and references
- J. J. De Yoreo, P. U. P. A. Gilbert, N. A. J. M. Sommerdijk, R. L. Penn, S. Whitelam, D. Joester, H. Z. Zhang, J. D. Rimer, A. Navrotsky, J. F. Banfield, A. F. Wallace, F. M. Michel, F. C. Meldrum, H. Colfen and P. M. Dove, Science, 2015, 349, aaa6760 CrossRef PubMed.
- G. Mirabello, A. Keizer, P. H. H. Bomans, A. Kovacs, R. E. Dunin-Borkowsk, N. A. J. M. Sommerdijk and H. Friedrich, Chem. Mater., 2019, 31, 7320–7328 CrossRef CAS.
- W. J. E. M. Habraken, J. H. Tao, L. J. Brylka, H. Friedrich, L. Bertinetti, A. S. Schenk, A. Verch, V. Dmitrovic, P. H. H. Bomans, P. M. Frederik, J. Laven, P. van der Schoot, B. Aichmayer, G. de With, J. J. DeYoreo and N. A. J. M. Sommerdijk, Nat. Commun., 2013, 4, 12 Search PubMed.
- Y. F. Xu, K. C. H. Tijssen, P. H. H. Bomans, A. Akiva, H. Friedrich, A. P. M. Kentgens and N. A. J. M. Sommerdijk, Nat. Commun., 2018, 9, 1507 CrossRef PubMed.
- K. Govender, D. S. Boyle, P. B. Kenway and P. O'Brien, J. Mater. Chem., 2004, 14, 2575–2591 RSC.
- R. A. McBride, J. M. Kelly and D. E. McCormack, J. Mater. Chem., 2003, 13, 1196–1201 RSC.
- K. M. McPeak, M. A. Becker, N. G. Britton, H. Majidi, B. A. Bunker and J. B. Baxter, Chem. Mater., 2010, 22, 6162–6170 CrossRef CAS.
- N. J. Nicholas, G. V. Franks and W. A. Ducker, CrystEngComm, 2012, 14, 1232–1240 RSC.
- W. L. Feng, B. C. Wang, P. Huang, X. D. Wang, J. Yu and C. W. Wang, Mater. Sci. Semicond. Process., 2016, 41, 462–469 CrossRef CAS.
- M. K. Liang, M. J. Limo, A. Sola-Rabada, M. J. Roe and C. C. Perry, Chem. Mater., 2014, 26, 4119–4129 CrossRef CAS.
- B. Song, X. Cui, Y. Q. Wang, L. F. Si, Z. X. Kou, W. W. Tian, C. Yi and Y. M. Sun, Cryst. Growth Des., 2016, 16, 4877–4885 CrossRef CAS.
- J. Lee, A. J. Easteal, U. Pal and D. Bhattacharyya, Curr. Appl. Phys., 2009, 9, 792–796 CrossRef.
- E. S. Jang, J. H. Won, Y. W. Kim, Z. Cheng and J. H. Choy, CrystEngComm, 2011, 13, 546–552 RSC.
- T. H. Hsieh, J. Y. Chen, C. W. Huang and W. W. Wu, Chem. Mater., 2016, 28, 4507–4511 CrossRef CAS.
- S. Yin and T. Sato, J. Mater. Chem., 2005, 15, 4584–4587 RSC.
- J. G. Strom and H. W. Jun, J. Pharm. Sci., 1980, 69, 1261–1263 CrossRef CAS PubMed.
- R. Devaraj, K. Venkatachalam, K. Saravanakumar, P. M. Razad and K. Mahalakshmi, J. Mater. Sci.: Mater. Electron., 2016, 27, 12201–12208 CrossRef CAS.
- G. Amin, M. H. Asif, A. Zainelabdin, S. Zaman, O. Nur and M. Willander, J. Nanomater., 2011, 2011, 1–9 CrossRef.
- K. M. McPeak, T. P. Le, N. G. Britton, Z. S. Nickolov, Y. A. Elabd and J. B. Baxter, Langmuir, 2011, 27, 3672–3677 CrossRef CAS PubMed.
- R. Parize, J. Garnier, O. Chaix-Pluchery, C. Verrier, E. Appert and V. Consonni, J. Phys. Chem. C, 2016, 120, 5242–5250 CrossRef CAS.
- Y. Liu, K. P. Tai and S. J. Dillon, Chem. Mater., 2013, 25, 2927–2933 CrossRef CAS.
- S. E. R. Tay, A. E. Goode, J. N. Weker, A. A. Cruickshank, S. Heutz, A. E. Porter, M. P. Ryan and M. F. Toney, Nanoscale, 2016, 8, 1849–1853 RSC.
- P. M. Perillo, M. N. Atia and D. F. Rodriguez, Matéria (Rio J.), 2018, 23(2), e12133 Search PubMed.
- T. F. Long, S. Yin, K. Takabatake, P. Zhnag and T. Sato, Nanoscale Res. Lett., 2009, 4, 247–253 CrossRef CAS PubMed.
- M. R. Alenezi, S. J. Henley, N. G. Emerson and S. R. P. Silva, Nanoscale, 2014, 6, 235–247 RSC.
- M. R. Alenezi, A. S. Alshammari, K. D. G. I. Jayawardena, M. J. Beliatis, S. J. Henley and S. R. P. Silva, J. Phys. Chem. C, 2013, 117, 17850–17858 CrossRef CAS PubMed.
- C. T. Sun and D. F. Xue, CrystEngComm, 2016, 18, 1262–1272 RSC.
- C. Ou, P. E. Sanchez-Jimenez, A. Datta, F. L. Boughey, R. A. Whiter, S. L. Sahonta and S. Kar-Narayan, ACS Appl. Mater. Interfaces, 2016, 8, 13678–13683 CrossRef CAS PubMed.
- A. Moezzi, M. B. Cortie and A. M. McDonagh, Dalton Trans., 2013, 42, 14432–14437 RSC.
- A. Moezzi, M. Cortie and A. McDonagh, Dalton Trans., 2016, 45, 7385–7390 RSC.
- Q. J. Yu, W. Y. Fu, C. L. Yu, H. B. Yang, R. H. Wei, M. H. Li, S. K. Liu, Y. M. Sui, Z. L. Liu, M. X. Yuan, G. T. Zou, G. R. Wang, C. L. Shao and Y. C. Liu, J. Phys. Chem. C, 2007, 111, 17521–17526 CrossRef CAS.
- M. S. Yao, P. Hu, N. Han, F. Ding, C. L. Yin, F. L. Yuan, J. Yang and Y. F. Chen, Sens. Actuators, B, 2013, 186, 614–621 CrossRef CAS.
- Q. Y. Cui, K. Yu, N. Zhang and Z. Q. Zhu, Appl. Surf. Sci., 2008, 254, 3517–3521 CrossRef CAS.
- M. N. R. Ashfold, R. P. Doherty, N. G. Ndifor-Angwafor, D. J. Riley and Y. Sun, Thin Solid Films, 2007, 515, 8679–8683 CrossRef CAS.
- H. J. Gao, B. H. Ji, I. L. Jager, E. Arzt and P. Fratzl, Proc. Natl. Acad. Sci. U. S. A., 2003, 100, 5597–5600 CrossRef CAS PubMed.
- X. Zhang, A. Vyatskikh, H. J. Gao, J. R. Greer and X. Y. Li, Proc. Natl. Acad. Sci. U. S. A., 2019, 116, 6665–6672 CrossRef CAS PubMed.
- J. H. Kim, E. M. Kim, D. Andeen, D. Thomson, S. P. DenBaars and F. F. Lange, Adv. Funct. Mater., 2007, 17, 463–471 CrossRef CAS.
- A. Moezzi, A. McDonagh, A. Dowd and M. Cortie, Inorg. Chem., 2013, 52, 95–102 CrossRef CAS PubMed.
- W. X. Zhang and K. Yanagisawa, Chem. Mater., 2007, 19, 2329–2334 CrossRef CAS.
Footnote |
| † Electronic supplementary information (ESI) available: Experimental section, supporting discussion and figures. See DOI: 10.1039/d0ce00847h |
| This journal is © The Royal Society of Chemistry 2020 |

