
 Open Access Article
 This Open Access Article is licensed under a Creative Commons Attribution-Non Commercial 3.0 Unported Licence
On the impact of metal ion proportion on the physical properties of heterometallic metal–organic frameworks†
Justyna
Trzmiel
a,
Paulina
Peksa
b,
Maciej
Ptak
 c,
Katarzyna
Fedoruk
b and
Adam
Sieradzki
*b
c,
Katarzyna
Fedoruk
b and
Adam
Sieradzki
*b
aDepartment of Theoretical Physics, Wrocław University of Science and Technology, Wybrzeże Wyspiańskiego 27, 50-370 Wrocław, Poland
bDepartment of Experimental Physics, Wrocław University of Science and Technology, Wybrzeże Wyspiańskiego 27, 50-370 Wrocław, Poland. E-mail: adam.sieradzki@pwr.edu.pl
cInstitute of Low Temperature and Structure Research, Polish Academy of Sciences, Box 1410, 50-950 Wrocław 2, Poland
First published on 30th June 2020
Abstract
Indications of desirable polar order in ethylammonium C2H5NH3(EtA) metal formate [EtA][Na0.5Cr0.5(HCOO)3] and the lack of it in [EtA][K0.5Cr0.5(HCOO)3] raised important questions on the origin of structural phase transition and dipolar dynamics in these kinds of compounds. In this paper we provide results of experimental studies performed on the mixed frameworks, which may give more insight into understanding these phenomena. We report the synthesis of four heterometallic metal–organic frameworks [CH3CH2NH3][KxNa0.5−xCr0.5(HCOO)3] with various compositions (x = 0, 0.04, 0.22, and 0.5). Broadband dielectric spectroscopy assisted by vibrational spectroscopy allows us to determine the role of EtA+ motions in the structural phase transition in the investigated compounds. We clearly demonstrate that the increase of the K/Na ratio results in freer translational movements of the EtA+ cations.
Introduction
Metal–organic frameworks (MOFs), which are one of the subgroups of coordination polymers (CPs), can be either porous or dense materials with voids accommodating guest molecules.1 In recent years, physicochemical studies of dense MOFs have resulted in a wide range of scientific papers discussing their synthesis and the diversity of their crystal structures and physical properties, as well as a long list of their potential applications. MOF structures are constituted by a network consisting of two main elements: metal cations or metal clusters (acting as metallic centers, nodes) and organic ligands (acting as bridges between nodes) connected together by means of coordination bonds. Organic ligands, known as linkers, are able to form coordination bonds with metal ions. As a result of such a structure, it is possible to obtain crystalline, three, two or one-dimensional frameworks.2–4 Compounds crystallizing in a perovskite architecture, ABX3 (where A, B and X denote a protonated amine, a metal ion and a linker, respectively), are one of the most intensively studied groups of protonated amine-templated metal formates.5–7 In these compounds, the presence of additional hydrogen bonds (HBs) connecting ions embedded inside the cage of the metal–ligand framework is particularly important, as far as the functionality of these materials and the nature of the observed relaxation processes are concerned. The energy, strength and geometry of HBs present within the compound structure determine the mechanism of structural phase transitions and have an impact on the dynamics of relaxation processes. It was shown that the physical properties of the compound, for example magnetic ordering8,9 or electronic properties,10–15 change with the metal and functional group in the perovskite-type structure.The very intensively investigated subclass of such MOFs is metal formates with built-in alkylammonium cations.16,17 Their general formula is [cat][M(HCOO)3], where M is a divalent metal ion (M = Mg, Zn, Mn, Fe, Co, Ni, Cu) and [cat] represents an alkylammonium cation embedded within the voids of the metal formate framework. The cation placed in the organometallic skeleton can be, for instance, an ammonium ion [NH4+] (Am+),18,19 dimethylammonium ion (CH3)2NH2+] (DMA+)20,21 ethylammonium ion [C2H5NH3+] (EtA+),22,23 guanidinium ion [C(NH2)3+] (Gua+),24,25 formamidinium ion [CH(NH2)2+] (FMD+)26,27 or methylhydrazinium ion [CH3NH2NH2+] (MHy+).28,29 Depending on the composition, the physical properties of the compound undergo significant structural changes30 leading to unique magnetic,31 ferroelectric,32 ferroelastic33 or multiferroic34 properties.
Nevertheless, some common trends, due to their structural similarities, are observed for specific groups of compounds. Just to mention a few, the widely studied compounds containing DMA+ cations, which at higher temperatures belong to the trigonal space group R![[3 with combining macron]](https://www.rsc.org/images/entities/char_0033_0304.gif) c with disordered DMA+ ions located in the cages of the network, exhibit order–disorder phase transition to ferroelectric structures at 160–280 K.35–42 DSC measurements detected that these compounds show a structural phase transition that seems to have a first order nature.43–45 On the other hand, [EtA][M(HCOO)3] formates, where M = Mn or Mg, crystallize in the non-centrosymmetric space group Pna21 with ordered EtA+ cations.46,47 It was observed, however, that [EtA][Mg(HCOO)3] upon heating exhibits two phase transitions at 374 K and 426 K to trigonal and orthorhombic phases with disordered EtA+ cations, respectively.48
c with disordered DMA+ ions located in the cages of the network, exhibit order–disorder phase transition to ferroelectric structures at 160–280 K.35–42 DSC measurements detected that these compounds show a structural phase transition that seems to have a first order nature.43–45 On the other hand, [EtA][M(HCOO)3] formates, where M = Mn or Mg, crystallize in the non-centrosymmetric space group Pna21 with ordered EtA+ cations.46,47 It was observed, however, that [EtA][Mg(HCOO)3] upon heating exhibits two phase transitions at 374 K and 426 K to trigonal and orthorhombic phases with disordered EtA+ cations, respectively.48
Studies of heterometallic double perovskite-like formates with the general formula of [cat][MI0.5MIII0.5(HCOO)3] resulted in gathering of the very important knowledge concerning the phase transition phenomenon in MOFs.22,23,49–56 Extensive studies of formates have shown that the size of the organic cation and its binding strength to the anionic metal formate framework play a crucial role in the structural stability of the compound. Recently, the influence of two cations, i.e. DMA+ and EtA+, on the structural phase transition has been revealed. The research results obtained for mixed compounds, [C2H5NH3][Na0.5Cr0.5(HCOO)3] (EtANaCr), [C2H5NH3][Na0.5Al0.5(HCOO)3] (EtANaAl) and [C2H5NH3][Na0.5Fe0.5(HCOO)3] (EtANaFe), showed that there is a transition between the room-temperature polar Pn structure and the centrosymmetric paraelectric phase P21/n at high temperatures.22,23,45–47 The high-temperature (HT) paraelectric phase results from the dynamic disorder of EtA+ cations, which are equally likely to occupy one of the two symmetry independent positions in the unit cell. Lowering of the temperature results in symmetry breaking by ordering of the EtA+ cations. These cations begin to occupy one of the two specific positions giving rise to spontaneous polarization lying in the ac plane (LT phase).22,23
It is also worth adding that upon cooling, pure [C2H5NH3][Na0.5Cr0.5(HCOO)3] double perovskite exhibits structural phase transition to a polar phase at a temperature of 373 K (Fig. 1).45 The complete replacement of Na+ ions by larger K+ ions changes significantly the material properties and suppresses the observed phase transition to the polar phase, i.e. [C2H5NH3][K0.5Cr0.5(HCOO)3] (EtAKCr) adopts a monoclinic structure (P21/n) with ordered EtA+ cations.46 Despite all these empirical studies on the heterometallic formates mentioned, there are still many unanswered, although highly interesting, questions regarding the mechanism of phase transitions in such mixed structures. In order to make a contribution to studies focusing on understanding the role of dopants in the structural phase transition mechanism, we have decided to synthesize a series of mixed compounds [C2H5NH3][KxNa0.5−xCr0.5(HCOO)3] that would contain both K+ and Na+ ions in various proportions. We expect that in the case of heterometallic formates, the use of different concentrations of metal ions would allow obtaining compounds possessing different substructures and thus, it would change their physicochemical properties.
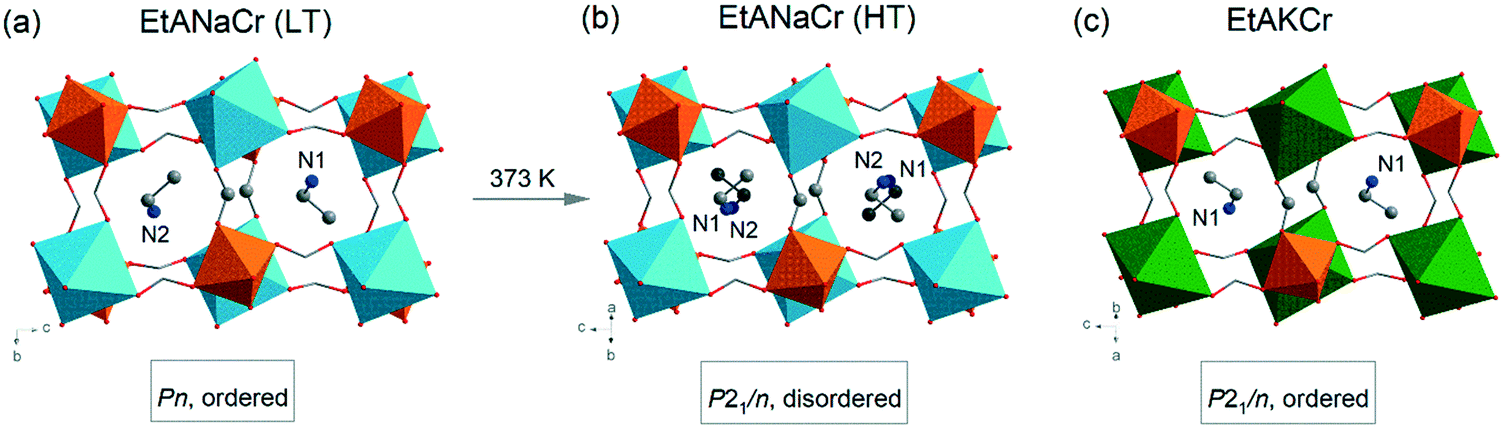 | ||
| Fig. 1 The LT (a) and HT (b) phases of EtANaCr compared to the ambient phase of EtAKCr (c); the H atoms are not marked for clarity of schemas; Cr (orange), Na (blue), K (green), C (grey), N (navy), O (red).45,46 | ||
The aim of this paper is to explore the influence of metal substitution in the framework of the investigated compounds on both the EtA+ cation ordering and bond strength. Various independent experimental techniques including differential scanning calorimetry (DSC), broadband dielectric spectroscopy (BDS), and structural studies using X-ray powder diffraction (XRD), Raman and IR spectroscopy were used to shed some light on the mechanism of structural phase transition in MOFs.
Experimental
Various synthesis methods, i.e. solvothermal method, simple crystallization from solution and diffusion method, were used to obtain [C2H5NH3][KxNa0.5−xCr0.5(HCOO)3] perovskites. Many attempts were made to obtain materials with composition parameter x in a broad concentration range. It turned out, however, that the substitution is possible only up to ca. 44 mol%. The microwave solvothermal technique using N-ethylformamide acting as the solvent and precursor of ethylammonium and formate ions appeared to be the most effective method. To obtain [C2H5NH3][Na0.5Cr0.5(HCOO)3] and [C2H5NH3][K0.5Cr0.5(HCOO)3] perovskites, a mixture composed of 25 ml of N-ethylformamide, 15 ml of water, 4 mmol of C2H5HN2·HCl, and 4 mmol of CrCl3·6H2O was added to the clear solution of 9 mmol of HCOONa (or 9 mmol of HCOOK for [CH3CH2NH3][K0.5Cr0.5(HCOO)3]) dissolved in 10 ml of H2O and 4 ml of 95% HCOOH (ca. 100 mmol). The reaction was carried out at 140 °C for 24 hours in a microwave-assisted autoclave. Next, the clear solution was cooled and left undisturbed. After one week, the navy blue crystals were separated from the mother liquid, washed a few times with methanol and dried in air. The synthesis procedure for the remaining analogues was the same, however, HCOONa was mixed with HCOOK in an appropriate molar ratio, i.e. 0.9 mmol of HCOOK + 8.1 mmol of HCOONa (for x = 0.04) and 4.5 mmol of HCOONa + 4.5 mmol of HCOOK (for x = 0.22).In this way, four mixed compounds, [C2H5NH3][Na0.5Cr0.5(HCOO)3] (1), [C2H5NH3][K0.04Na0.46Cr0.5(HCOO)3] (2), [C2H5NH3][K0.22Na0.28Cr0.5(HCOO)3] (3), and [C2H5NH3][K0.5Cr0.5(HCOO)3] (4), were obtained. The chemical composition of the mixed samples was determined using the ICP-OES method (determining the Na/K ratio, see Table S1†).
X-ray diffractograms were measured for all the samples to verify the symmetry of the mixed compounds. Powder diffraction data (XRD) were collected using an X'Pert PRO X-ray diffraction system equipped with a PIXcel ultra-fast line detector, divergence slits and Soller slits for CuKα radiation. The measurements were performed in reflection mode in the Bragg–Brentano geometry. The analysis of the patterns was made by the Rietveld method using the X'Pert PANalytical software.
Heat capacity was measured using a Mettler Toledo DSC-1 calorimeter with a high resolution of 0.4 μW. Nitrogen was used as a purging gas and the heating and cooling rate was 10 K min−1. The excess heat capacity associated with the phase transition was evaluated by subtraction of the baseline.
Raman spectra were measured using a Bruker FT 110/S spectrometer with a 1064 nm excitation line and 2 cm−1 resolution. IR spectra in the mid-IR (4000–600 cm−1) range were measured in KBr pellets and in the far-IR (600–50 cm−1) range in Nujol suspension on a polyethylene plate using a Nicolet iS50 FT-IR spectrometer with 2 cm−1 resolution.
Since the obtained single crystals were not big enough to perform electrical measurements on them, the complex dielectric permittivity of the pelletized polycrystalline samples was measured as a function of frequency and temperature with a parallel plate capacitor coupled to a broadband impedance Novocontrol Alpha analyzer. The powder was pressed into cylindrical pellets of 5 mm in diameter and about 0.8 mm in thickness, using a uniaxial press generating pressures of approximately about 0.5 GPa. All the investigated samples were dried and silver paste was painted on their surfaces to ensure a good electrical contact with the electrodes. An AC voltage of 1 V amplitude and frequencies in the range of 101–106 Hz were applied across the sample mounted in a holder. Measurements of the dielectric spectra were taken with a step of 1 K over the temperature range from 270 to 390 K. The temperature was controlled with a Novo-Control Quattro system using a nitrogen gas cryostat.
Results and discussion
Structural investigation
The crystallographic structures of EtANaCr (1) and EtAKCr (4) double perovskites have already been determined (Fig. 1). The crystal structure of (4) and the HT phase of (1) are described by the same P21/n monoclinic symmetry, however, the arrangement of the EtA+ cations in both crystals is different.45,46 In (4), they are ordered and occupy one crystallographic position, while in the HT phase of (1) there are two inequivalent EtA+ cation positions due to their dynamic disorder.45,46 Lowering of the temperature below 373 K leads to the order–disorder phase transition and this crystal transforms into monoclinic polar Pn symmetry.The experimental (e) results of the XRD measurements for samples (1)–(4) compared to the simulated (s) patterns based on crystal data taken from the literature are presented in Fig. 2. The patterns showed that the obtained (1) and (4) crystals are free of impurities and exhibit good agreement with the literature data.45,46 The diffractograms obtained for the crystals (2) and (3) show very similar reflections to the polar phase, which were observed for (1). This result suggests that the compounds with the composition of x = 0.04 and x = 0.22 adopt the Pn polar phase. As could have been expected, substitution of Na+ by larger K+ ions led to a downshift of the observed reflections towards lower values of 2θ angles. According to Bragg's equation, smaller angles correspond to larger interplanar distances in the crystal lattice. Therefore, it can be concluded that higher values of the x parameter are related to the increased volume of the unit cell. To understand the impact of K+ ions on the unit cell parameters, the Rietveld analysis was performed. The results of the refinement are presented in Fig. S1, S2 and in Table S2.† They confirmed that the increased amount of K+ ions leads to the increase of the unit cell volume by about 0.6 and 2.6% for x = 0.04 and 0.22, respectively. The increased level of doping affects mainly the b and c parameters and decreases the monoclinic β angle.
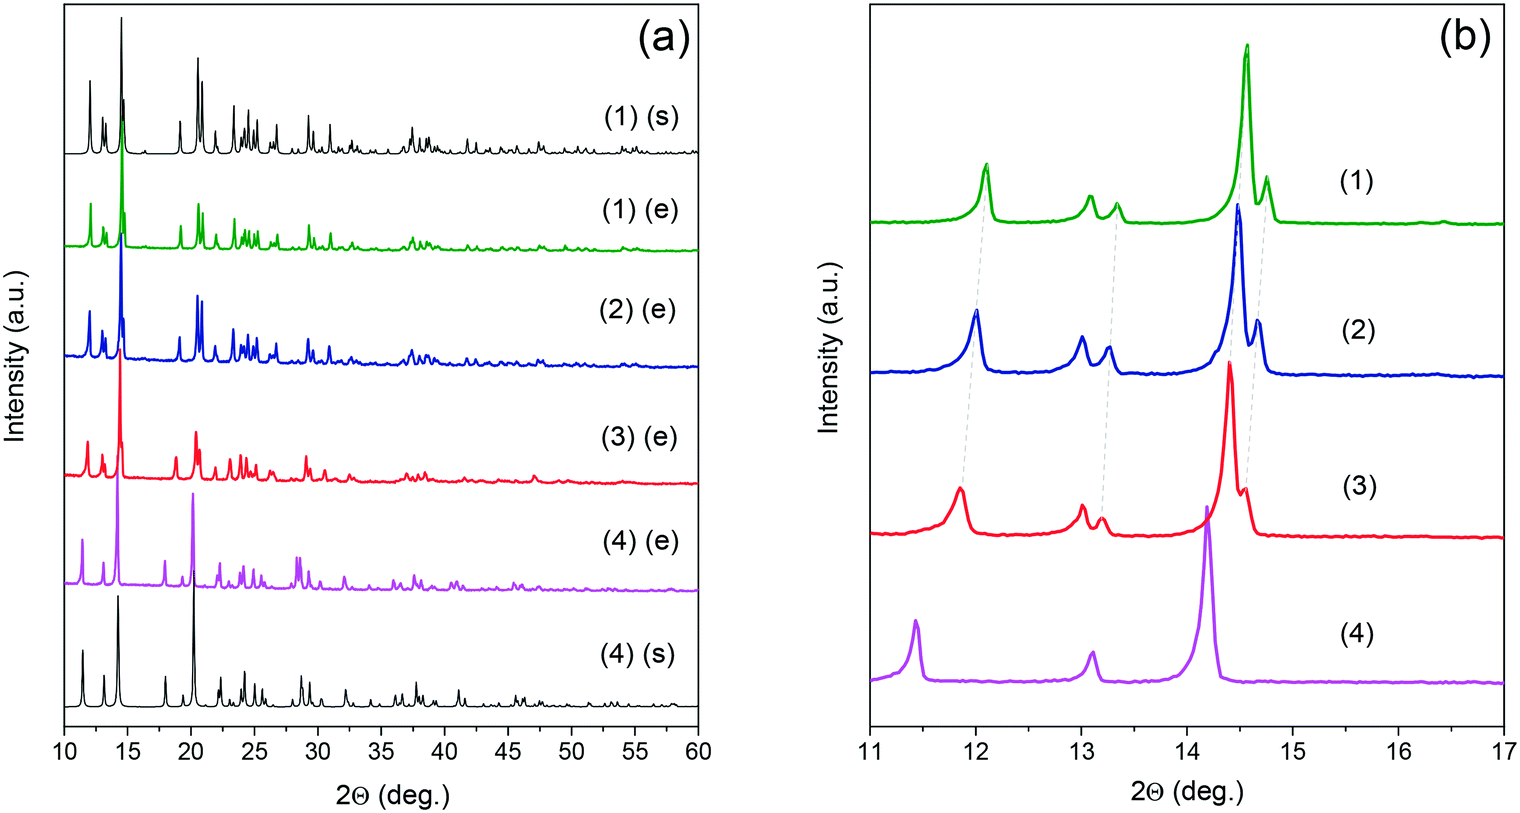 | ||
| Fig. 2 Experimental (e) and simulated (s) powder XRD patterns of the mixed [EtA][KxNa0.5−xCr0.5(HCOO)3] samples in the full (a) and zoomed 10–17 2θ range (b). | ||
Raman and IR spectra
The IR and Raman spectra of the studied double perovskites are presented in Fig. 3. The factor group analysis and detailed assignment of the observed bands to internal and external (lattice) vibrations were previously proposed and thus, they are not discussed here.45,46 The incorporation of K+ ions into crystal (1) does not change the spectra qualitatively. This confirms that the (2) and (3) perovskites adopt the ambient polar Pn phase of (1). As can be observed, the increased amount of K+ ions results in subtle changes of the spectra measured for samples (2) and (3). The observed broadening of many IR and Raman bands is related to the increased substitutional disorder. This effect is expected to be most pronounced for bands assigned to lattice vibrations and to formate linkers. Indeed, bands originating from lattice modes (below 350 cm−1) become broader and strongly overlapped. Among the internal vibrations of formate ions, the most sensitive ones are those corresponding to symmetric stretching of the carbonyl groups (ν2) and to deformational (ν5) and stretching (ν1) vibrations of the CH groups. The corresponding band downshifts are weak (up to 3 cm−1 for sample (3)) indicating that the metal formate framework is weakly distorted. Previous detailed studies of (1) and (4) under high-pressure conditions showed that K+ analogues are more flexible and possess lower bulk modulus, site-projected vibrational entropy, larger cages accommodating EtA+ cations and stronger HBs.49 The interplay of the listed factors causes suppression of the temperature-induced phase transition in (4).49 Therefore, the increased amount of K+ ions in (2) and (3) should also lead to the enlargement of the space available for EtA+ cations and their higher freedom of movement. The IR and Raman spectral data show that the bands corresponding to the EtA+ cations are weakly affected, indicating that the structural change is also weak.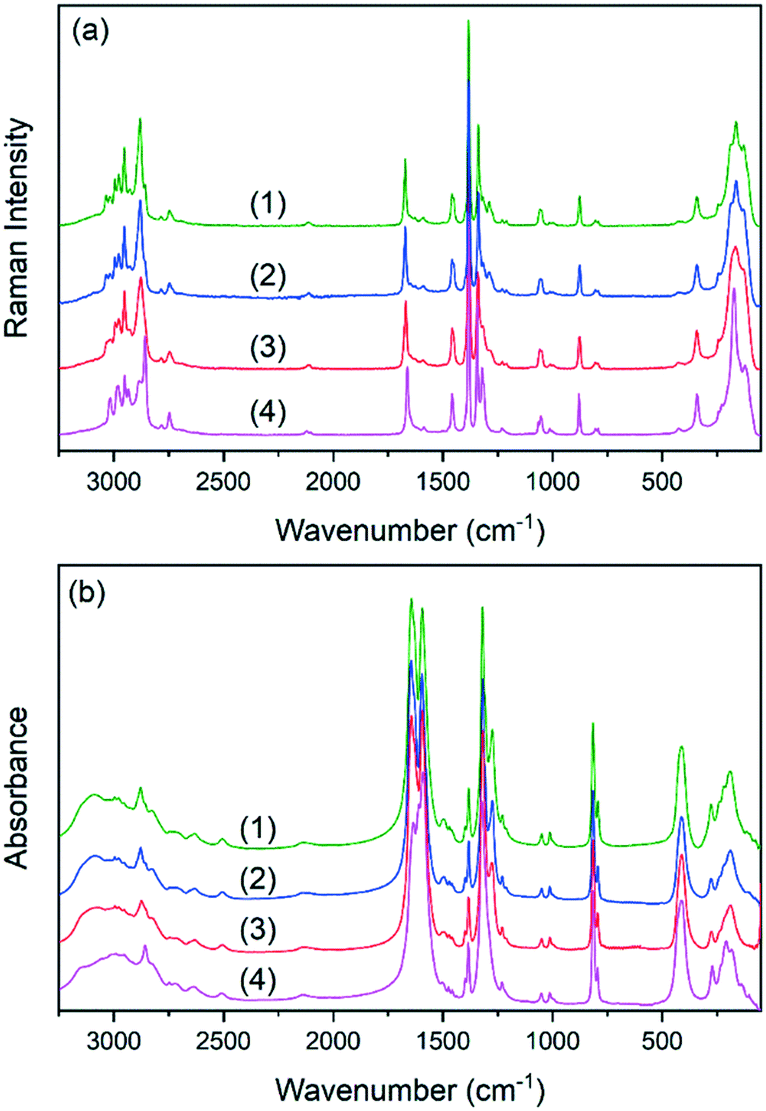 | ||
| Fig. 3 Raman (a) and IR (b) spectra of the studied double perovskites. | ||
DSC
The observed specific heat anomaly for compound (1) is asymmetric and the corresponding change in the entropy (ΔS) at Tc exhibits a continuous trend, which confirms that the phase transition in this sample is of a second order (see Fig. 4). The specific heat dependence for sample (2) near 370 K (measured during heating) revealed the presence of a slight anomaly, suggesting an additional heat flow associated with the phase change. It can be observed that the DSC signal for this sample is more blurred and shifted to slightly lower temperatures compared to sample (1) (see Fig. 4), which makes the determination of the phase transition temperature rather approximate. It can be noted that the dependence of the specific heat changes as a function of temperature cp(T) for sample (2) is asymmetrical and the change of entropy is continuous, similar to sample (1). This observation indicates the second order phase transition occurring in this compound. Blurring of the phase transition anomaly is significant for sample (3) and makes it difficult to determine the transition point accurately. However, comprehensive analysis and an estimated network heat value allowed determination of the specific heat changes around the phase transition temperature. An increase in potassium K+ percentage in the compound composition clearly affects the phase transition blur, which is consistent with the previously observed influence of the dopant on the phase transition in hybrid metal–organic compounds.30 | ||
| Fig. 4 (a) The temperature dependence of the specific heat and (b) change in heat capacity, related to the phase transition in (1)–(4) compounds measured in a heating mode. | ||
Dielectric studies
Ordering of the movements of the built-in cation or more specifically, the loss of its rotations in the low-temperature phase, is assumed to be the mechanism of phase transformation in metal–organic formates. In the case of the tested compounds, the embedded EtA+ cation has a dipole moment, thus the use of broadband dielectric spectroscopy seems to be an effective tool in determining the effect of ordering of the movements of this cation at around the phase transition temperature. Complex impedance measurements for various temperatures were performed as a function of sampling signal frequency. The results were presented using a modulus representation to avoid polarizing effects on the electrodes. The bell-shaped course of imaginary part M′′ and the step-like behavior of real part M′ of the complex modulus prove the occurrence of the dipolar relaxation phenomenon (Fig. 5). Each data set was fitted by means of the Havriliak–Negami function to determine the relaxation times on temperature dependence (see Fig. S3† and 5b and c). In the tested compounds, the observed relaxation processes may be associated with either rotational or translational EtA+ motions. The results of the structural investigations of sample (1) revealed the ordering of EtA+ cations during the phase transition. It was found that above the Tc, the dynamic disorder of EtA+ is predominant as the cation may, with the same probability, take one out of two equivalent positions in the voids. The freedom of EtA+ movements becomes limited below the phase transition temperature, as in this temperature region ethylammonium cation movements are frozen. Therefore, it can be concluded that the relaxation response of the sample above the phase transition temperature would be related to the dynamic motions of EtA+, whereas their “freezing” would be expected below the Tc. In consequence, any relaxation process detected below the phase transition temperature would rather originate from the translational motions of the EtA+ cation. | ||
| Fig. 5 (a) Dependence of the mean relaxation time of the EtA+ cation as a function of inverse temperature obtained for the studied compounds (1)–(4) (the linear fits indicate the Arrhenius processes), and selected frequency dependence of real part M′(ω) (b) and imaginary part M′′(ω) (c) at selected temperatures of samples (2) and (3). Characteristic dipolar relaxation peak shifts to higher frequencies with increasing temperature. | ||
The relaxation map (Fig. 5a) shows no changes at the phase transition temperature region, which indicates that the observed relaxation process is rather not related to the motions of the ethylammonium cations. As the presence of this relaxation process is detected below as well as above the phase transition temperature it may highly likely be related to the translational motions of EtA+. The obtained value of activation energy (Ea) corresponding to this process for sample (1) is equal to 0.99 eV and is higher, compared to the energies originating from ordering of the movements of other ammonium cations.23,57,58 The change in composition seems not to have an impact on the qualitative properties of the observed process. It results, however, in a quantitative change, which is a decrease in the activation energy value for samples (2) and (3). The activation energies for these samples were stated to be equal to 0.63 eV and 0.20 eV, respectively. The observed decrease in activation energy values may be related to the diminished strength of the metal–framework interactions and in consequence, freer cation movement. The dielectric response of compound (4) is quite different, as in the case of this sample, two relaxation processes are observed. The activation energies corresponding to these two processes do not match the observed general tendency of decreasing value of Ea with increasing potassium content in the sample structure. Nevertheless, this result is not very surprising. It remains in good agreement with the structural investigations showing structural differences between sample (4) and the other samples used in this study. It should be pointed out that the strong dependence of the activation energy value of the processes related to the EtA+ movements on the K/Na ratio observed for compounds (1)–(3) allows us to conclude that in the studied structures, the strength of the interaction between the built-in cation and the environment is strongly modified by the K to Na proportion. Even slight changes in the K/Na content have a strong impact on the activation energy value, which can be related to a significant change in long-range interactions, responsible for the polar order of the studied materials.
Conclusions
In this paper four samples of heterometallic metal–organic frameworks [C2H5NH3][KxNa0.5−xCr0.5(HCOO)3] with x = 0, 0.04, 0.22, and 0.5 compositions were studied by means of various experimental techniques including X-ray powder diffraction (XRD), Raman spectroscopy, differential scanning calorimetry (DSC) and dielectric broadband spectroscopy. It was found that changes in the chemical composition of the studied amine-templated metal formates result in various physical properties of these materials.Structural investigations revealed that mixed x = 0.04 and x = 0.22 K/Na compositions possess structures very similar to [C2H5NH3][Na0.5Cr0.5(HCOO)3] formate. Thus, some polar properties of [C2H5NH3][K0.04Na0.46Cr0.5(HCOO)3] and [C2H5NH3][K0.22Na0.28Cr0.5(HCOO)3] could be expected. This issue, however, would require further studies. It was also found that higher values of the composition parameter x result in the increase of the unit cell volume of the studied compounds leading to the enlargement of the space available for EtA+ cations.
Moreover, DSC studies revealed that the potassium content has an impact on the structural phase transition, i.e. for the sample with maximum sodium occupancy, second order phase transition is observed, whereas the increase of the K/Na ratio to about 1 causes strong blurring of the structural phase change. This phase transition is no longer observed for the sample with maximum potassium occupancy.
Dielectric spectroscopy measurements revealed that in the studied structures the strength of mutual interactions between the built-in EtA+ cation and the environment is strongly modified by the K/Na ratio. It was shown that an even slight increase of the K to Na proportion results in freer translational movements of EtA+ cations and as a result, has a strong impact on the values of activation energy of the [C2H5NH3][KxNa0.5−xCr0.5(HCOO)3] framework.
Considering the above results, it can be concluded that the change in the physical properties of ethylammonium heterometallic metal formates can be introduced by controlling the metal cation proportions within the compound structure.
Conflicts of interest
There are no conflicts to declare.Acknowledgements
The authors are grateful to the National Science Centre within the framework of the Miniatura 1 project for financial support (Grant No. DEC-2017/01/X/ST3/00682).References
- S. R. Batten, N. R. Champness, X.-M. Chen, J. Garcia-Martinez, S. Kitagawa, L. Öhrström, M. O'Keeffe, M. P. Suh and J. Reedijk, CrystEngComm, 2012, 14, 3001–3004 RSC.
- L. Jiao, J. Y. Ru Seow, W. S. Skinner, Z. U. Wang and H.-L. Jiang, Mater. Today, 2019, 27, 43–68 CrossRef CAS.
- J. Tang and Y. Yamauchi, Nat. Chem., 2016, 8, 638–639 CrossRef CAS PubMed.
- S. Yuan, L. Feng, K. Wang, J. Pang, M. Bosch, C. Lollar, Y. Sun, J. Qin, X. Yang, P. Zhang, Q. Wang, L. Zhou, Y. Zhang, L. Zhang, Y. Fang, J. Li and H.-C. Zhou, Adv. Mater., 2018, 30, 1704303 CrossRef.
- W. Li, Z. Zhang, E. Bithell, A. Batsanov, P. Barton, P. Saines, P. Jain, C. Howard, M. Carpenter and A. Cheetham, Acta Mater., 2013, 61, 4928–4938 CrossRef CAS.
- P. Jain, V. Ramachandran, R. J. Clark, H. D. Zhou, B. H. Toby, N. S. Dalal, H. W. Kroto and A. K. Cheetham, J. Am. Chem. Soc., 2009, 131, 13625–13627 CrossRef CAS PubMed.
- M. Bosch, S. Yuan, W. Rutledge and H.-C. Zhou, Acc. Chem. Res., 2017, 50, 857–865 CrossRef CAS PubMed.
- X. Y. Wang, L. Gan, S. W. Zhang and S. Gao, Inorg. Chem., 2004, 43, 4615–4625 CrossRef CAS PubMed.
- D. F. Weng, Z. M. Wang and S. Gao, Chem. Soc. Rev., 2011, 40, 3157–3181 RSC.
- P. Jain, N. S. Dalal, B. H. Toby, H. W. Kroto and A. K. Cheetham, J. Am. Chem. Soc., 2008, 130, 10450–10451 CrossRef CAS PubMed.
- F. R. Fan, H. Wu, D. Nabok, S. Hu, W. Ren, C. Draxl and A. Stroppa, J. Am. Chem. Soc., 2017, 139, 12883–12886 CrossRef CAS PubMed.
- Y. Tian, J. Cong, S. Shen, Y. Chai, L. Yan, S. Wang and Y. Sun, Phys. Status Solidi RRL, 2014, 8, 91–94 CrossRef CAS.
- D. Di Sante, A. Stroppa, P. Jain and S. Picozzi, J. Am. Chem. Soc., 2013, 135, 18126–18130 CrossRef CAS PubMed.
- P. Jain, A. Stroppa, D. Nabok, A. Marino, A. Rubano, D. Paparo, M. Matsubara, H. Nakotte, M. Fiebig, S. Picozzi, E. S. Choi, A. K. Cheetham, C. Drax, N. S. Dalal and V. S. Zapf, npj Quantum Mater., 2016, 1, 16012 CrossRef.
- L. C. Gomez-Aguirre, B. Pato-Doldan, J. Mira, S. Castro-Garcia, M. A. Senaris-Rodriguzes, M. Sanchez-Andujar, J. Singleton and V. S. Zapf, J. Am. Chem. Soc., 2016, 138, 1122–1125 CrossRef CAS PubMed.
- W. Zhang and R.-G. Xiong, Chem. Rev., 2012, 112, 1163–1195 CrossRef CAS PubMed.
- R. Shang, S. Chen, K.-L. Hu, B.-W. Wang, Z.-M. Wang and S. Gao, Chem. – Eur. J., 2016, 22, 6199–6203 CrossRef CAS PubMed.
- R. Ramesh, Nature, 2009, 461, 1218–1219 CrossRef CAS PubMed.
- M. Mączka, M. Ptak and S. Kojima, Appl. Phys. Lett., 2014, 104, 222903 CrossRef.
- W. Wang, L.-Q. Yan, J.-Z. Cong, Y.-L. Zhao, F. Wang, S.-P. Shen, T. Zou, D. Zhang, S.-G. Wang, X.-F. Han and Y. Sun, Sci. Rep., 2013, 3, 2024 CrossRef CAS.
- M. Mączka, A. Sieradzki, B. Bondzior, P. Dereń, J. Hanuza and K. Hermanowicz, J. Mater. Chem. C, 2015, 3, 9337–9345 RSC.
- M. Ptak, M. Mączka, A. Gągor, A. Sieradzki, A. Stroppa, D. Di Sante, J. M. Perez-Mato and L. Macalik, Dalton Trans., 2016, 45, 2574–2583 RSC.
- A. Sieradzki, S. Pawlus, S. N. Tripathy, A. Gągor, M. Ptak, M. Paluch and M. Mączka, Dalton Trans., 2017, 46, 3681–3687 RSC.
- A. Stroppa, P. Jain, P. Barone, M. Marsman, J. M. Perez-Mato, A. K. Cheetham, H. W. Kroto and S. Picozzi, Angew. Chem., Int. Ed., 2011, 50, 5847–5850 CrossRef CAS PubMed.
- M. Viswanathan, Cryst. Growth Des., 2019, 19, 4287–4292 CrossRef CAS.
- M. Mączka, A. Ciupa, A. Gągor, A. Sieradzki, A. Pikul, B. Macalik and M. Drozd, Inorg. Chem., 2014, 53, 5260–5268 CrossRef PubMed.
- A. Ciupa, M. Mączka, A. Gągor, A. Pikul, E. Kucharska, J. Hanuza and A. Sieradzki, Polyhedron, 2015, 85, 137–143 CrossRef CAS.
- M. Mączka, A. Gagor, M. Ptak, W. Paraguassu, T. A. da Silva, A. Sieradzki and A. Pikul, Chem. Mater., 2017, 29, 2264–2275 CrossRef.
- A. Sieradzki, M. Mączka, M. Simenas, J. K. Zaręba, A. Gągor, S. Balciunas, M. Kinka, A. Ciupa, M. Nyk, V. Samulionis, J. Banys, M. Paluch and S. Pawlus, J. Mater. Chem. C, 2018, 6, 9420–9429 RSC.
- P. Peksa, J. Trzmiel, K. Fedoruk, A. Gągor, M. Šimėnas, A. Ciupa, S. Pawlus, J. Banys, M. Mączka and A. Sieradzki, J. Phys. Chem. C, 2019, 123, 23594–23603 CrossRef CAS.
- C. Bellitto, E. M. Bauer and G. Righini, Coord. Chem. Rev., 2015, 123, 289–290 Search PubMed.
- W. Zhang and R.-G. Xiong, Chem. Rev., 2012, 112, 1163 CrossRef CAS PubMed.
- E. Strelcov, Q. Dong, T. Li, J. Chae, Y. Shao, Y. Deng, A. Gruverman, J. Huang and A. Centrone, Sci. Adv., 2017, 3, e160216 Search PubMed.
- Y. Zhang, W.-Q. Liao, D.-W. Fu, H.-Y. Ye, C.-M. Liu, Z.-N. Chen and R.-G. Xiong, Adv. Mater., 2015, 27, 3942 CrossRef CAS PubMed.
- W. Li, Z. Wang, F. Deschler, S. Gao, R. H. Friend and A. K. Cheetham, Nat. Rev. Mater., 2017, 2, 16099 CrossRef.
- T. Besara, P. Jain, N. S. Dalal, P. L. Kuhns, A. P. Reyes, H. W. Kroto and A. K. Cheetham, Proc. Natl. Acad. Sci. U. S. A., 2011, 108, 6828–6832 CrossRef.
- Z. Zhang, H. Tang, D. Cheng, J. Zhang, Y. Chen, X. Shen and H. Yu, Results Phys., 2019, 12, 2183–2188 CrossRef.
- T. Asaji and K. Ashitomi, J. Phys. Chem. C, 2013, 117, 10185–10190 CrossRef CAS.
- B. Pato-Doldán, M. Sánchez-Andújar, L. C. Gómez-Aguirre, S. Yáñez-Vilar, J. López-Beceiro, C. Gracia-Fernández, A. A. Haghighirad, F. Ritter, S. Castro-García and M. A. Señarís-Rodríguez, Phys. Chem. Chem. Phys., 2012, 14, 8498 RSC.
- T. Asaji, S. Yoshitake, Y. Ito and H. Fujimori, J. Mol. Struct., 2014, 1076, 719–723 CrossRef CAS.
- X. Y. Wang, L. Gan, S. W. Zhang and S. Gao, Inorg. Chem., 2004, 43, 4615–4625 CrossRef CAS.
- K. Asadi and M. A. van der Veen, Eur. J. Inorg. Chem., 2016, 27, 4332–4344 CrossRef.
- B. Pato-Doldan, M. Sanchez-Andujar, L. C. Gomez-Aguirre, S. Yanez-Vilar, J. Lopez-Beceiro, C. Gracia-Fernandez, A. A. Haghighirad, F. Ritter, S. Castro-Garcia and M. A. Senaris-Rodrigues, Phys. Chem. Chem. Phys., 2012, 14, 8498–8501 RSC.
- M. Sanchez-Andujar, L. C. Gomez-Aguirre, B. Pato Doldan, S. Yanez-Vilar, R. Artiaga, A. L. Llamas-Saiz, R. S. Manna, F. Schnelle, M. Lang, F. Ritter, A. A. Haghighirad and M. A. Senaris-Rodriguzez, CrystEngComm, 2014, 16, 3558–3566 RSC.
- Y. Ma, Y. Wang, J. Cong and Y. Sun, Phys. Rev. Lett., 2019, 122, 255701 CrossRef CAS PubMed.
- R. Shang, G. C. Xu, Z. M. Wang and S. Gao, Chem. – Eur. J., 2014, 20, 1146–1158 CrossRef CAS PubMed.
- Z. Wang, B. Zhang, T. Otsuka, K. Inoue, H. Kobayashi and M. Kurmoo, Dalton Trans., 2004, 2209–2216 RSC.
- A. Ciupa, M. Ptak, M. Mączka, J. G. da Silva Filho and P. T. C. Freire, J. Raman Spectrosc., 2017, 48, 972–982 CrossRef CAS.
- M. Ptak, M. Mączka, A. Gągor, A. Sieradzki, B. Bondzior, P. Dereń and S. Pawlus, Phys. Chem. Chem. Phys., 2016, 18, 29629–29640 RSC.
- M. Ptak, A. Gągor, A. Sieradzki, B. Bondzior, P. Dereń, A. Ciupa, M. Trzebiatowska and M. Mączka, Phys. Chem. Chem. Phys., 2017, 19, 12156–12166 RSC.
- M. Ptak, D. Stefańska, A. Gągor, K. L. Svane, A. Walsh and W. Paraguassu, Phys. Chem. Chem. Phys., 2018, 20, 22284–22295 RSC.
- M. Ptak, I. E. Collings, K. L. Svane, A. Sieradzki, W. Paraguassu and M. Mączka, J. Mater. Chem. C, 2019, 7, 8660–8668 RSC.
- M. Ptak, K. L. Svane, I. E. Collings and W. Paraguassu, J. Phys. Chem. C, 2020, 124, 6337–6348 CrossRef CAS.
- H. Yurtseven and O. Tari, Int. J. Mod. Phys. B, 2019, 33, 1950103 CrossRef CAS.
- A. Plutecka and U. Rychlewska, Acta Crystallogr., Sect. C: Cryst. Struct. Commun., 2009, 65, 75–77 CrossRef PubMed.
- Y. Yu, R. Shang, S. Chen, B.-W. Wang, Z.-M. Wang and S. Gao, Chem. – Eur. J., 2017, 23, 9857–9871 CrossRef CAS PubMed.
- A. Sieradzki, J. Trzmiel, M. Ptak and M. Mączka, Electron. Mater. Lett., 2015, 11, 1033–1039 CrossRef CAS.
- M. Šimėnas, S. Balčiūnas, A. Ciupa, L. Vilčiauskas, D. Jablonskas, M. Kinka, A. Sieradzki, V. Samulionis, M. Maczka and J. Banys, J. Mater. Chem. C, 2019, 7, 6779–6785 RSC.
Footnote |
| † Electronic supplementary information (ESI) available. See DOI: 10.1039/d0ce00578a |
| This journal is © The Royal Society of Chemistry 2020 |