 Open Access Article
High-throughput on demand access of single enantiomers by a continuous flow crystallization process†
Fabio
Cameli
a,
Christos
Xiouras
 *b and
Georgios D.
Stefanidis
 *ac
*ac
aProcess Engineering for Sustainable Systems (ProcESS), Department of Chemical Engineering, KU Leuven, Celestijnenlaan 200F, 3001 Leuven, Belgium. E-mail: georgios.stefanidis@kuleuven.be
bCrystallization Technology Unit (CTU), Janssen Research & Development, Janssen Pharmaceutical Companies of Johnson & Johnson, Tournhoutseweg 30, 2340, Beerse, Belgium. E-mail: CXiouras@its.jnj.com
cSchool of Chemical Engineering, National Technical University of Athens, 9, Heroon Polytechniou Str., Zografos, Athens, Gr-15780, Greece
First published on 13th May 2020
Abstract
A novel continuous flow reactive crystallization process for the in situ on-demand access of single enantiomer crystals is reported and exemplified for a chiral pharmaceutical intermediate that crystallizes as a racemic conglomerate. During this process, a nearly racemic feed suspension with a racemization catalyst is circulated through a tubular coiled milli-reactor immersed in two thermostatic baths set at different temperatures. This flow configuration enables rapid heat transfer, which in turn results in successive spatial cycles of dissolution and re-crystallization carried out at extremely short residence times, unattainable in batchwise operations. By tuning the number of cycles, residence time per cycle and feed suspension density we show that unprecedented productivities (>20 g L−1 h−1) of the preferred enantiomer at purities >98% can be attained that could easily suit industrial demand in a directly scalable process.
Introduction
Amongst the plethora of methods for chiral separation, crystallization-enhanced deracemization processes have attracted much interest in the pharmaceutical industry due to complete enantiopurity and maximum theoretical solid recovery achievable.1 Such deracemization processes rely on partial dissolution and re-crystallization of a nearly racemic suspension of chiral conglomerate crystals via either mechanical forces2 or thermal oscillations3 in the presence of a racemization reaction. While the mechanisms leading to deracemization in those processes have been thoroughly investigated,4 all deracemization process schemes developed so far operate in batch mode, while direct scale-up of these configurations as such has been both limited and unsuccessful.3gContinuous manufacturing has been adopted by the pharmaceutical industry as the way forward,5 exhibiting unique benefits such as the accessibility to extreme reaction conditions and hazard control,5a,b lower plant footprint and waste production,5c,d improved supply chain, flexibility of production5d and a high level of control within a quality-by-design (QbD) framework.5c In particular to crystallization processes, such benefits have been demonstrated in continuous antisolvent crystallizations,6 oscillatory baffled flow crystallizers7 as well as in integrated reaction, crystallization and formulation schemes for the end-to-end manufacture of pharmaceuticals.8
While a few modelling studies have demonstrated the feasibility of extending continuous crystallization processes to the deracemization of chiral compounds,9 also in combination with racemization reactions,9a an experimental proof-of-principle for such a process remains unreported. In this context, small diameter (μm–mm) flow reactor technology is expected to offer unique advantages for deracemization processes via e.g. temperature cycles, as heat can be added and removed efficiently owing to the high surface-to-volume ratio and small volumes involved in such configurations.5e Additionally, such technology is considerably easier to scale up compared to batch processing by e.g. “smart dimensioning” or numbering up.5a To our knowledge, no deracemization or any other chiral crystallization process for that matter has been reported in such flow-through (milli-)reactor configuration.
Herein, we show for the first time that fully continuous and automated deracemization is possible for an important chiral pharmaceutical intermediate by employing spatial thermal oscillations in a tubular flow milli-reactor. Without extensive optimization, we show that such continuous operation delivered approximately an order of magnitude higher productivities compared to similar batch processes offering tremendous possibilities for intensifying and scaling up this deracemization process.
Experimental section
Model compound
Compound 1, (2-isopropyl-3-hydroxy-3-phenylisoindolin-1-one) belongs to the class of isoindolin-1-ones, which are important building blocks for several natural products and pharmaceuticals.10a While various synthetic routes for producing chiral isoindolin-1-ones exist, only few asymmetric syntheses of such molecules are known in the literature.10b Previous studies have shown that 1 fulfils the necessary prerequisites for deracemization, i.e. a) conglomerate crystallization and b) facile racemization in the liquid phase (Scheme 1).11 In our previous work,3h we studied extensively the deracemization behaviour of 1 in batch temperature cycling experiments carried out in a microwave reactor and underscored the key role of stereoselective secondary nucleation in the deracemization process. For this reason, we selected 1 as a model compound to perform the continuous deracemization experiments reported here, due to our experience with the compound and the availability of previous batch deracemization data that can be directly compared with the continuous deracemization experiments. To this end, rac-1 was synthesized in our lab using the same procedure as in our previous work,3h also reported in the ESI.†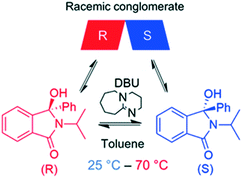 | ||
| Scheme 1 Racemization reaction of 1 in toluene using catalytic DBU. 1 crystallizes as a racemic conglomerate, i.e. R and S enantiomers discriminate in the solid state. | ||
Set-up
In order to investigate the feasibility of continuous deracemization of 1via spatial thermal oscillations, we designed a flow milli-reactor that employed a helically coiled tube (PFA, inner ∅ 1.59 mm), in which two water baths were utilized to provide constant temperature in the different zones of dissolution and crystallization as shown in Fig. 1. In all experiments, the temperatures of the cold and hot baths were kept at 25 °C and 70 °C, respectively. Different configurations were tested, in which the total length of the tube (L) varied in order to adjust the cycle residence time in the dissolution (τc,1) and crystallization zones (τc,2) at a constant suspension flow rate of 3–6 mL min−1.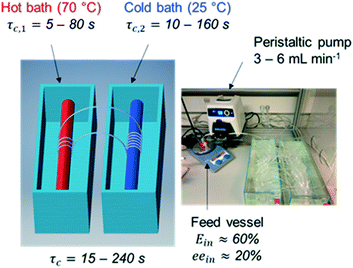 | ||
| Fig. 1 Tubular flow reactor employed for the deracemization of 1via spatial cycles of dissolution and re-crystallization. | ||
Hence, the tube length in each dissolution passage varied from 0.25 m to 2 m resulting in τc,1 between 5 s and 80 s while the length in the low temperature zone varied between 0.5 m and 4 m, corresponding to τc,2 between 10 s and 160 s. Since crystallization is typically slower than dissolution, τc,2 was kept two times higher than τc,1 in all configurations. Hence, the cycle residence time: τc = τc,1 + τc,2 varied between 15 s and 240 s in the different experiments.
In order to run each configuration for various number of cycles (N), each set-up employed only one thermal cycle (i.e. one dissolution and crystallization passage respectively) working in a loop. To enable such operation, the nearly racemic feed suspension (ee ≈ 20%, thus Ein ≈ 60% in favour of the S enantiomer) was initially fed through the tubular reactor, and subsequently the two ends of the tube were tied together with a connecting fitting. Thereafter, the reactor worked without interruptions for a given set of N cycles, resembling a fully continuous tubular reactor with a total length of N·L. At the end of each run, the connecting fitting was uncoupled, and the entire suspension was filtered on a glass filter to determine yield, productivity and enantiomeric purity for each run.
Measurement of enantiomeric purity
The final enantiomeric purity of the dried product crystals (Ef) was determined by chiral HPLC in a Lux Amylose-1 (Phenomenex) column running at 0.5 mL min−1 of n-hexane/ethanol 95/5 (v/v%). The enantiomers were detected by a diode array detector (DAD) at a wavelength of 254 nm and the enantiomeric purity of the preferred (S in this case) enantiomer was calculated as: | (1) |
Solid yield and process productivity
The final overall solid yield (Y) was calculated based on the outlet solute concentration of 1 recovered from the process and the solubility at 25 °C: | (2) |
 is the solubility of rac-1 at 25 °C (20.7 g Lsolvent−1) and ρs,f is the feed suspension density at 25 °C (constant at 45.4 g Lsolvent−1 unless stated otherwise). Both solute concentration of the outlet and the solubility concentration were measured via UV spectroscopy in a UV/VIS Lambda 365, Perkin Elmer spectrophotometer.
The productivity of the desired enantiomer (P; g Lsolvent−1 h−1) was calculated according to:3f
 | (3) |
Results and discussion
Thermal analysis of the flow reactor
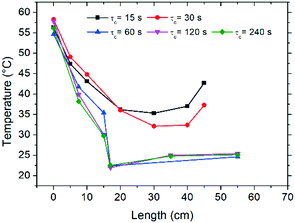
Initial characterization of the flow reactor involved the determination of the thermal profiles along the length of the tube, as well as characterization of the dissolution and crystallization kinetics for the various cycle residence times (τc) examined. In Fig. 2 the temperature profiles attained in the reactor are reported as a function of tube length, measured by an infrared camera, where zero length corresponds to the point immediately after exiting the hot bath. Fig. 2 shows that the temperature of the tube leaving the hot bath is comparable among the different experiments although inferior to the bath temperature of 70 °C, likely due to fast cooling by natural convection when the tube meets ambient air at room temperature. Subsequently, along the length of the reactor, the solution is cooled and temperatures close to 25 °C are achieved for most experiments. Due to practical considerations, experiments with τc = 15–30 s could not be cooled in the bath and were only air-cooled by natural convection, which as shown in Fig. 2 provokes dampened thermal sweeps with minimum temperature values of about 35 °C. Nonetheless, the temperature profiles reported in Fig. 2 clearly show that the flow configuration employed here enables excellent heat transfer, which is very difficult to attain in typical batchwise operations. This in turn permits cycles of dissolution and crystallization at unprecedented short times.Dissolution and crystallization rates
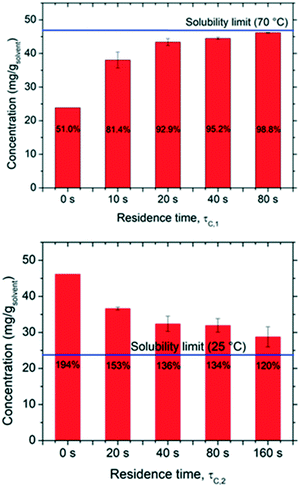
The kinetics of dissolution and re-crystallization, which in turn determine the mass involved in the deracemization process, were evaluated by carrying out measurements of solute concentration at the end of the dissolution and crystallization segments as a function of residence time. The results are reported in Fig. 3 in which one can notice that both dissolution and crystallization do not reach full equilibrium. As expected, the longer the residence time in both hot and cold parts the closer to solubility limits the system operates. In particular, for the dissolution stage, up to 98.8% of the solubility at 70 °C is achieved with τc,1 = 80 s, while a τc,1 = 20 s is already sufficient to reach more than 90% of the solubility. Likewise, the rate of solution desupersaturation due to crystallization is influenced by the residence time, with longer residence times leading to solution concentrations closer to the solubility at 25 °C. However, it is evident that most dissolution and crystallization already occur at short residence times (up to τc,1 = 20 s and τc,2 = 40 s), with negligible mass dissolving/crystallizing after those times. This pertains to the fact that dissolution and crystallization kinetics are initially much faster due to the high initial super(under)saturations attained. Thus, short cycle residence times are advantageous, as they avoid operating at low driving forces where dissolution/crystallization kinetics are slow. For example, in a period of 240 s, one can perform a single cycle featuring τc,1 = 80 s and τc,2 = 160 s which would involve ∼17.4 mg gsolvent−1 in the dissolution/recrystallization process. Alternatively, in the same time period of 240 s, 4 cycles featuring τc,1 = 20 s and τc,2 = 40 s can be performed, each of which would involve 11 mg gsolvent−1, giving a total of 44 mg gsolvent−1 involved in the dissolution/recrystallization process.Effect of residence time on deracemization
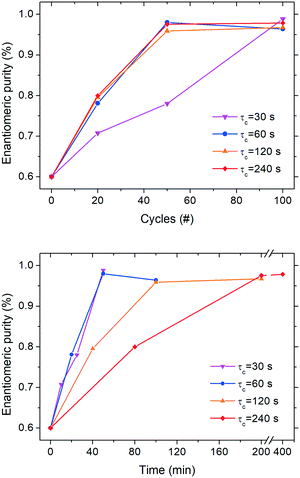
In order to determine whether enantiomeric enrichment occurs in these configurations as well as the minimum number of cycles required to do so, we conducted series of continuous deracemization experiments at 20, 50 and 100 cycles for the various cycle residence times, τc values of 30, 60, 120, and 240 s, corresponding to the τc,1 and τc,2 values reported in Fig. 3. All experiments were started from an initial enantiomeric excess of 20%. It is also noted, that in all experiments, the initial enantiomeric imbalance was created by mixing small enantiopure crystals of 1 (obtained in a previous deracemization run) with larger rac-1 crystals (synthesized according to the procedure reported in the ESI†). Thus, besides the enantiomeric mass imbalance, there is also a small size imbalance between the enantiomers, that could adversely affect deracemization, since the smaller enantiopure crystals can kinetically dissolve and convert to the counter enantiomer during the heating phase. While this effect may well play a role in the observed deracemization kinetics, its magnitude is expected to be similar among the different experiments since the same enantiomeric imbalance was used. Thus, a relative comparison of the deracemization rates among the reported experiments is still possible.Fig. 4 shows that continuous deracemization is well feasible, as every configuration led to substantial increase in the enantiomeric purity from 60% up to values >96%. Starting from an even lower initial enantiomeric imbalance is expected to also lead to complete deracemization, as shown previously in batch experiments,3 but it is undesirable due to the slow deracemization rates attained that could lead to low productivity.3f In order to prove that deracemization is due to temperature cycles, a continuous experiment (ESI†) at a constant temperature (25 °C) was also run using only the cold bath (τc = 60 s) with a suspension featuring 20% enantiomeric excess. During that experiment, no substantial enantiomeric enrichment was observed for more than 100 cycles indicating that the reason for the enantiomeric enrichment in the continuous experiments is indeed the successive cycles of dissolution and re-crystallization induced by spatial thermal oscillations.
It is also noticeable (Fig. 4, top) how little difference in the deracemization rate per cycle is attained at different residence times presumably due to the similar dissolution/crystallization rates achieved for τc > 60 s (Fig. 3). Nevertheless, the experiment with τc = 30 s clearly features a lower deracemization rate per cycle, possibly due to the lower mass involved per cycle. While most experiments reach maximum purity already at 50 cycles, the aforementioned configuration requires 100 cycles to achieve similar purity. However, Fig. 4 (bottom) shows that shorter residence times lead to an overall shorter time to reach enantiomeric purity, as the lower deracemization capacity per cycle is overcompensated by the fact that many more cycles are possible during the same time period, in accordance to our previous observations in batch deracemization via temperature cycles.3c
In order to show that the loop reactor configuration employed here for convenience is equivalent to a fully continuous tubular reactor that can be used in industry, we repeated the experiment at τc = 120 s in a fully continuous manner by employing a 60 m long tube (seen in Fig. 1, right) featuring 20 successive cycles of heating and cooling without recirculation of the suspension (single passage). The initially scalemic suspension (Ein = 85%) used in that experiment reached a final enantiomeric purity of 96% at the outlet of the reactor. Since a similar enantiomeric purity increase was obtained in the loop experiment with τc = 120 s after 20 cycles (Fig. 4, top), we became convinced that the loop systems used for the analysis of the residence time can be considered as reliable reproductions of fully continuous configurations applicable at industrial scale.
Effect of feed suspension density on deracemization
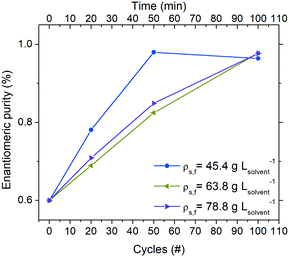
Operating the continuous reactor at a higher suspension density is expected to directly influence productivity (eqn (3)). To this end, three experiments at the same residence time (τc = 60 s) were conducted in order to investigate the behaviour of the system when a higher amount of crystals is employed for deracemization.As the thermal profile was identical in all conditions, a lower percentage of crystal mass is involved in the dissolution/crystallization stages when the process is run with higher suspension densities. Therefore, from Fig. 5 it can be noticed that the deracemization rate per cycle decreases by increasing the amount of crystals employed. Thus, a 75 m long reactor (corresponding to 50 thermal cycles at τc = 60 s) is adequate to reach >96% purity of the target enantiomer when running at a feed suspension density of 45.4 g Lsolvent−1. However, by increasing the suspension density to 63.8 and 78.8 g Lsolvent−1, the same reactor delivers purity of only 83% and 85%, respectively.
Process productivity
Table 1 presents an overview of the yield, productivity and enantiomeric purity attained for all continuous experiments calculated at the estimated number of cycles (N) needed to achieve a steady-state of maximum enantiomeric purity (Ef > 96%) in the reactor outlet. An additional experiment is included in that table at an even shorter residence time of τc = 15 s (not shown in Fig. 4) that was carried out in the same reactor as the one at τc = 30 s but using a double suspension flow rate (6 mL min−1). We note here in passing that changing the suspension flow rate at a constant residence time (by using different reactor lengths) did not affect the deracemization process (ESI†). Therefore, in the range of parameters examined here, flow rate and reactor length can be viewed as two independent parameters that influence the deracemization process simply by their effect on τc. Nevertheless, a further increase in flow rate up to 12 mL min−1 provoked clogging of the tubular reactor due to different relative velocities between solvent and crystals that caused particles to stick and form large aggregates. However, in all other conditions herein mentioned, no sign of clogging was observed, and the crystals appeared to be sufficiently suspended in the liquid. SEM images of the crystals before and after the runs in the flow reactor with different conditions of residence time, flow rate and suspension density are reported in ESI.†| τ c (s) | ρ s,f (g Lsolvent−1) | N (−) | Y (%) | P (g Lsolvent−1 h−1) | E f (%) |
|---|---|---|---|---|---|
| a τ c refers to the cycle residence time, where crystallization time is two times higher than dissolution time. b Since shorter tube was impractical, τc was decreased at 15 s by using the same tube as for τc = 30 s and running at double flow rate (6 mL min−1). In all other cases, flow rate was 3 mL min−1. | |||||
| 15b | 45.4 | 100 | 83.1 | 30.8 | 94.0 |
| 30 | 45.4 | 100 | 92.0 | 19.5 | 98.9 |
| 60 | 45.4 | 50 | 99.9 | 20.7 | 98.0 |
| 60 | 63.8 | 100 | 98.2 | 14.3 | 98.0 |
| 60 | 78.8 | 100 | 97.3 | 17.5 | 98.0 |
| 120 | 45.4 | 50 | 93.6 | 9.2 | 96.0 |
| 240 | 45.4 | 50 | 95.0 | 4.9 | 97.6 |
Table 1 shows that while an overall shorter residence time at a constant suspension density leads to a small negative impact on yield due to incomplete equilibration at the low temperature, substantially higher productivities at smaller reactor footprints are possible with shorter residence times. In fact, a total reactor length of just 75 m (100 cycles) is sufficient to produce up to 30.8 g L−1 h−1 of the preferred enantiomer at steady state, which is practically feasible. On the other hand, increasing the suspension density at a constant cycle residence time has a small negative impact on the productivity of the preferred enantiomer. While an increase in the feed suspension density should lead to higher productivity (eqn (3)), the effect is counterbalanced by the increased number of cycles needed to achieve enantiomeric purities >96% due to the slower deracemization kinetics at higher suspension densities (Fig. 5).
As a comparison, Table 2 shows typical productivity and purity values obtained in state-of-the-art batch deracemization experiments employing temperature cycles reported in the literature. While a direct assessment is difficult due to the different kinetics in the various systems employed in the different studies, a comparison with Table 1 shows that productivity values of approximately an order of magnitude higher are obtained in the continuous deracemization process.
| Study | Substance | P (g Lsolvent−1 h−1) | E f (%) |
|---|---|---|---|
| a For cases where batch productivities were not reported, they were calculated by eqn (2) by replacing the term N·τc with the total batch time reported in each study. In cases where the yield, Y was not reported, it was taken as 1. Productivities correspond to the best case scenario reported in each study. | |||
| Suwannasang et al.3b | Precursor of paclobutrazol | 0.47 | >99 |
| Li et al.3d | Phenylalanine | 4.4 | 100 |
| Oketani et al.3e | 2-Methoxy-naphtamide | 1.0 | 95 |
| Breveglieri et al.3f | N-(2-Methylbenzylidene)-phenylglycine amide | 1.8 | 100 |
| Steendam et al.3g | Sodium bromate | 0.13 | >99 |
| Cameli et al.3h | 1 | 5.1 | 98.3 |
Conclusions
In summary, we have developed a continuous flow reactive crystallization process for accessing single enantiomer crystals of a conglomerate-forming pharmaceutical intermediate starting from nearly racemic suspensions. Within a tubular flow reactor, cycles of dissolution and crystallization of the suspension can be carried out by simply pumping the suspension through two thermal zones at high and low temperature. This configuration affords excellent heat transfer and allows to carry out thermal cycles in time periods as low as 15 s, which are impossible to attain in batchwise operations. While in such short cycle times, suspension equilibration is not complete, the dissolution/crystallization kinetics are greatly enhanced by operating most of the cycle at higher super(under)saturations. Using less than 100 m tubing, approximately 20 g L−1 h−1 of the preferred enantiomer at purities >98% can be produced. Scale-up or scale-out of the method can be easily performed by increasing the tubing diameter or by adding parallel reactors and is foreseen to enable high throughput on-demand access of single enantiomers at industrial scale.Conflicts of interest
There are no conflicts to declare.Acknowledgements
This project has received funding from the European Union's Horizon 2020 research and innovation programme under the Marie Skłodowska-Curie grant agreement No 721290. This publication reflects only the author's view, exempting the Community from any liability. Project website: http://cosmic-etn.eu/ Fabio Cameli thanks Prabhat Ranjan for providing the chiral crystals used in the experiments.References
- H. Lorenz and A. Seidel-Morgensern, Angew. Chem., Int. Ed., 2014, 53, 1218–1250 CrossRef CAS PubMed
.
-
(a) C. Viedma, Phys. Rev. Lett., 2005, 94, 065504 CrossRef PubMed
; (b) W. L. Noorduin, W. J. P. Van Enckevort, H. Meekes, B. Kaptein, R. M. Kellogg, J. C. Tully, J. M. Mcbride and E. Vlieg, Angew. Chem., Int. Ed., 2010, 49, 8435–8438 CrossRef CAS PubMed
; (c) A. H. J. Engwerda, R. Maassen, P. Tinnemans, H. Meekes, F. P. J. T. Rutjes and E. Vlieg, Angew. Chem., Int. Ed., 2019, 58, 1670–1673 CrossRef CAS PubMed
; (d) C. Xiouras, A. Fytopoulos, J. H. Ter Horst, A. G. Boudouvis, T. Van Gerven and G. D. Stefanidis, Cryst. Growth Des., 2018, 18, 3051–3061 CrossRef CAS
; (e) C. Xiouras, A. Fytopoulos, J. Jordens, A. G. Boudouvis, T. Van Gerven and G. D. Stefanidis, Ultrason. Sonochem., 2018, 43, 184–192 CrossRef CAS PubMed
.
-
(a) C. Viedma and P. Cintas, Chem. Commun., 2011, 47, 12786 RSC
; (b) K. Suwannasang, A. E. Flood, C. Rougeot and G. Coquerel, Cryst. Growth Des., 2013, 13, 3498–3504 CrossRef CAS
; (c) F. Cameli, C. Xiouras and G. D. Stefanidis, CrystEngComm, 2018, 20, 2897 RSC
; (d) W. W. Li, L. Spix, S. C. A. De Reus, H. Meekes, H. J. M. Kramer, E. Vlieg and J. H. Ter Horst, Cryst. Growth Des., 2016, 16, 5563–5570 CrossRef CAS
; (e) R. Oketani, M. Hoquante, P. Cardinael and G. Coquerel, Cryst. Growth Des., 2018, 18, 6417–6420 CrossRef CAS
; (f) F. Breveglieri, G. M. Maggioni and M. Mazzotti, Cryst. Growth Des., 2018, 18, 1873–1881 CrossRef CAS
; (g) R. R. E. Steendam and J. H. ter Horst, Cryst. Growth Des., 2018, 18, 3008–3015 CrossRef CAS
; (h) F. Cameli, J. H. ter Horst, R. R. E. Steendam, C. Xiouras and G. D. Stefanidis, Chem. – Eur. J., 2020, 26, 1344–1354 CrossRef CAS PubMed
.
-
(a) K. Suwannasang, G. Coquerel, C. Rougeot and A. E. Flood, Chem. Eng. Technol., 2014, 37, 1329–1339 CrossRef CAS
; (b) H. Katsuno and M. Uwaha, Phys. Rev. E, 2016, 93, 1–10 CrossRef PubMed
; (c) B. Bodák, G. M. Maggioni and M. Mazzotti, Cryst. Growth Des., 2018, 18, 7122–7131 CrossRef
.
-
(a) B. Gutmann, D. Cantillo and C. O. Kappe, Angew. Chem., Int. Ed., 2015, 54, 6688–6728 CrossRef CAS PubMed
; (b) A. R. Bogdan, S. L. Poe, D. C. Kubis, S. J. Broadwater and D. T. McQuade, Angew. Chem., Int. Ed., 2009, 48, 8547–8550 CrossRef CAS PubMed
; (c) S. D. Schaber, D. I. Gerogiorgis, R. Ramachandran, J. M. B. Evans, P. I. Barton and B. L. Trout, Ind. Eng. Chem. Res., 2011, 50, 10083–10092 CrossRef CAS
; (d) S. L. Lee, T. F. O'Connor, X. Yang, C. N. Cruz, S. Chatterjee, R. D. Madurawe, C. M. V. Moore, L. X. Yu and J. Woodcock, J. Pharm. Innov., 2015, 10, 191–199 CrossRef
; (e) R. L. Hartman, J. P. McMullen and K. F. Jensen, Angew. Chem., Int. Ed., 2011, 50, 7502–7519 CrossRef CAS PubMed
.
- S. A. Raza, U. Schacht, V. Svoboda, D. P. Edwards, A. J. Florence, C. R. Pulham, J. Sefcik and I. D. H. Oswald, Cryst. Growth Des., 2018, 18, 210–218 CrossRef CAS
.
- T. McGlone, N. E. B. Briggs, C. A. Clark, C. J. Brown, J. Sefcik and A. J. Florence, Org. Process Res. Dev., 2015, 19, 1186–1202 CrossRef CAS
.
- A. Adamo, R. L. Beingessner, M. Behnam, T. F. Jamison, K. F. Jensen, J.-C. M. Monbaliu, A. S. Myerson, E. M. Revalor, D. R. Snead, T. Stelzer, N. Weeranoppanant, S. Y. Wong and P. Zhang, Science, 2016, 352, 61–67 CrossRef CAS PubMed
.
-
(a) T. Köllges and T. Vetter, Cryst. Growth Des., 2017, 17, 233–247 CrossRef
; (b) A. Majumder, Processes, 2018, 6, 247 CrossRef CAS
; (c) A. Majumder and Z. Nagy, Pharmaceutics, 2017, 9, 55 CrossRef PubMed
.
-
(a) D. L. Comins, S. Schilling and Y. Zhang, Org. Lett., 2005, 7, 95–98 CrossRef CAS PubMed
; (b) V. Agouridas, F. Capet, A. Couture, E. Deniau and P. Grandclaudon, Tetrahedron: Asymmetry, 2011, 22, 1441–1447 CrossRef CAS
.
-
(a) F. Yagishita, H. Ishikawa, T. Onuki, S. Hachiya, T. Mino and M. Sakamoto, Angew. Chem., Int. Ed., 2012, 51, 13023–13025 CrossRef CAS PubMed
; (b) R. R. E. Steendam, M. C. T. Brouwer, E. M. E. Huijs, M. W. Kulka, H. Meekes, W. J. P. Van Enckevort, J. Raap, F. P. J. T. Rutjes and E. Vlieg, Chem. – Eur. J., 2014, 20, 13527–13530 CrossRef CAS PubMed
.
Footnote |
| † Electronic supplementary information (ESI) available. See DOI:10.1039/d0ce00366b |
| This journal is © The Royal Society of Chemistry 2020 |

