
 Open Access Article
 This Open Access Article is licensed under a
 Creative Commons Attribution 3.0 Unported Licence
Enabling efficient exploration of metal–organic frameworks in the Cambridge Structural Database†
Aurelia
Li
 a,
Rocio
Bueno-Perez
a,
Seth
Wiggin
b and
David
Fairen-Jimenez
*a
a,
Rocio
Bueno-Perez
a,
Seth
Wiggin
b and
David
Fairen-Jimenez
*a
aAdsorption & Advanced Materials Laboratory (A2ML), Department of Chemical Engineering & Biotechnology, University of Cambridge, Philippa Fawcett Drive, Cambridge CB3 0AS, UK. E-mail: df334@cam.ac.uk
bThe Cambridge Crystallographic Data Centre, 12 Union Road, Cambridge, UK
First published on 2nd June 2020
Abstract
As the Cambridge Structural Database reaches a record number of one million deposited structures in 2019, the metal–organic frameworks (MOFs) community sees its own pool of synthesised structures continue to grow to almost 100![[thin space (1/6-em)]](https://www.rsc.org/images/entities/char_2009.gif) 000 entries. The increasing number of MOFs being synthesised paved the way to an entire computational research field based on high-throughput screenings in order to i) find the best structure for a given application, ii) uncover structure–property trends to guide experimentalists towards a more rational design of MOFs. In this sense, the CSD has become a treasure trove in which computational researchers are trying to find the most relevant data. However, the wealth of information and possibilities combined with the lack of guidelines can be overwhelming and misleading, for new and experienced researchers in the field alike. In this tutorial review, we aim to look at the different ways the CSD has been used so far by the community, to present the most useful tools for efficient exploration of the CSD for MOFs applications and the future possible developments to further enhance the discovery of MOFs.
000 entries. The increasing number of MOFs being synthesised paved the way to an entire computational research field based on high-throughput screenings in order to i) find the best structure for a given application, ii) uncover structure–property trends to guide experimentalists towards a more rational design of MOFs. In this sense, the CSD has become a treasure trove in which computational researchers are trying to find the most relevant data. However, the wealth of information and possibilities combined with the lack of guidelines can be overwhelming and misleading, for new and experienced researchers in the field alike. In this tutorial review, we aim to look at the different ways the CSD has been used so far by the community, to present the most useful tools for efficient exploration of the CSD for MOFs applications and the future possible developments to further enhance the discovery of MOFs.
1. Introduction
Metal–organic frameworks (MOFs) have gained much attention in the last two decades in the nanoporous materials community and are now one of the fastest-growing subsets of extended structures.1–6 Although the nature of MOFs is still debated and remains to be more clearly defined,7–9 they are usually described as a class of crystalline materials assembled from metal atoms or clusters (secondary building units or SBUs) and organic ligands in a ‘building block’ approach.10 The relatively straightforward synthesis of MOFs and the diverse possible combinations of SBUs and ligands have led to the design of ever more customised structures. Their pores span a range of sizes (from micro- to mesoporous), geometries, internal surface areas (as high as 8000 m2 g−1vs. 1000 m2 g−1 for zeolites and 3500 m2 g−1 for activated carbons)11 and void fractions. These properties have encouraged researchers to consider MOFs for a wide variety of applications, ranging from gas storage,12–16 separation,17–21 catalysis22–24 to drug delivery25–29 and bio-imaging.26,27,30 The number of structures published and deposited in the Cambridge Structural Database (CSD) has thus also significantly increased. In 2017, our group developed in collaboration with the Cambridge Crystallographic Data Centre (CCDC) the first regularly and automatically updated CSD MOF subset.7 At the time of its publication, there was ca. 70000 MOFs in this database. By August 2019, this number had reached 96000, meaning almost 1000 new structures per month. This huge amount of data creates interesting opportunities for materials discovery, whether it is to find the best existing structure for a given application or to uncover interesting structure–property trends that can guide researchers towards a more rational design of new MOFs.
Our previous work7 led to the release of a package of tools for the exploration of MOFs in the CSD: we developed the CSD MOF subset, a non-disordered MOF subset and Python scripts for the removal of the bound and unbound solvent, for users to apply on their desired subset. We also detailed our methods, based entirely on CSD tools, and encouraged MOF scientists to use them for their own research. We have realised, however, that these tools might not seem very intuitive to researchers who are new in the field or not familiar with all the available possibilities provided by the CCDC. In addition, the lack of guidelines on these tools and the sharing of methods has led to misleading or irreproducible results. This tutorial review highlights the different ways the CSD has been explored by MOF researchers, further explains some essential CSD data concepts, provides tips on how to use the CSD tools for a better, reproducible exploration of the MOF subset and finally gives a quick overview on current data issues the computational MOF community is faced with. We will particularly focus on the CCDC software Mercury and ConQuest,31 and the CSD application programming interface (API),32 for single structure and high-throughput search and analyses. Mercury is the main CCDC software for visualising, exploring and analysing structures one at a time, and ConQuest, the primary structures search software. Both are presented with a graphical user interface (GUI) and can be used with simple click-and-drag actions. The CSD Python API uses a command-line interface and requires a little familiarity with Python. While Mercury is only able to perform actions on single structures, the API is able to do the same in a high-throughput manner. We will provide guidance on the effective use of these tools later on in this review. We hope the tips given here will be helpful for experimentalist and computational MOF scientists alike.
2. Single MOF analysis – Polymer Expansions with Mercury
Mercury offers a wide range of possibilities for the analysis of a single structure, such as powder diffraction patterns, visualisation of void space, measure of distances and angles, etc. The full list of capabilities can be found in the Help section of the software or online.33 We will here focus on the Polymer Expansion functionality, a particularly useful way to visualise MOFs. As extended structures, only a repeating unit (RU) is used to represent MOFs in the CSD. Therefore, several expansions of this RU are necessary to form the final framework. Extended structures are defined in the CCDC with ‘polymeric’ bonds, the type of bond that connects RUs. These bonds are represented in a zig-zag shape in a 2D-diagram, or labelled as ‘Po’ in the Mercury visualiser (see Fig. 1a and c). The 2020.0 release of Mercury (version 4.3.0) also enables the identification of polymeric bonds from any CIF files read into the software, or from any disordered CSD entry where bond types were not previously assigned. To identify polymeric bonds from such structures, go to Edit > Auto Edit Structure and make sure the Identify polymeric bonds box is ticked. To perform a Polymer Expansion, simply go to Edit > Polymer Expansion. In the pop-up window, you can either expand all the polymeric bonds (click on Expand All) or only specific ones by ticking Expand at selection and clicking on the desired polymeric bond. Tick the ‘Po’ label on polymeric bonds option to visualise their position in the structure. It is also possible to reverse back to a smaller structure by ticking Prune at selection and clicking on the polymeric bond. Fig. 1b and d give an example of the structures obtained with one or more polymer expansion.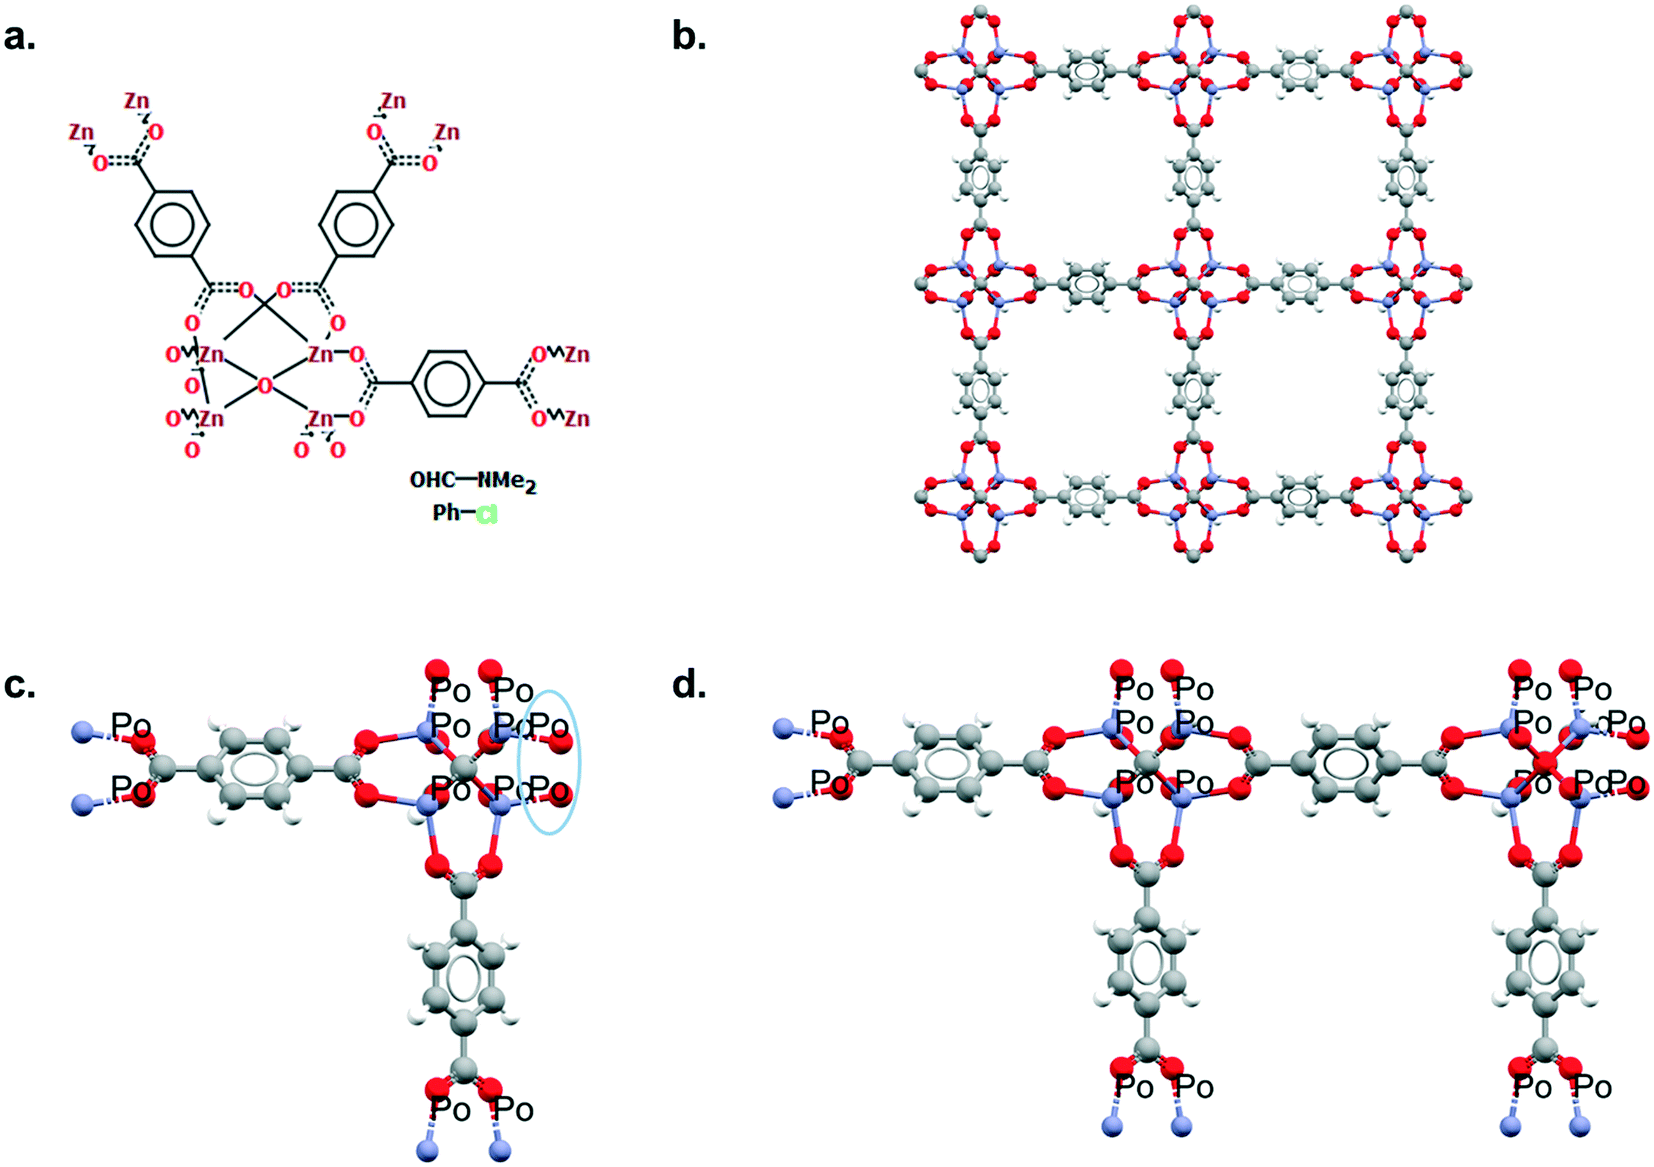 | ||
| Fig. 1 Example of polymeric expansion in MOF-5 (CSD refcode: SAHYIK) in Mercury. a. Chemical diagram: the zig-zag lines are the polymeric bonds, the dotted lines are aromatic bonds. b. The expanded structure after several polymer expansions. c. The repeating unit with polymeric bonds labelled as ‘Po’. d. The structure after expanding the polymeric bonds circled in c. A 3D representation of SAHYIK is given in Fig. 3b. | ||
3. Digging into the CSD for MOFs with ConQuest
ConQuest offers a wide range of search possibilities, from drawing a fragment of a targeted structure, to specifying its space group, and from combining different search queries to combining different search results. It can be used to find one specific structure, but also a subset of structures – such as MOFs. As early as in 2004, Ockwig et al. endeavoured to classify MOFs in the CSD according to their respective topologies.34 An older version of the software, Quest, was then used to carry out a string search, which returned 1127 three-periodic MOFs. However, no further details on the exact strings were given.Given the amount of data, the growing toolbox of computational chemistry35 and the computational power available today, virtual high-throughput screenings (HTS) have become an emerging approach for scientists interested in materials discovery. Amongst the properties that can be calculated in a reasonable amount of time – from a few seconds to several hours per structure – are a structure's properties calculated using geometrical approaches or obtained with classical simulations. Typical textural properties (largest cavity diameter, pore limiting diameter, void fraction, surface area and density) can be obtained with open-source software packages such as Zeo++36 or PoreBlazer.37 Physical properties related to the adsorption of molecules inside MOFs can be obtained with algorithms based on statistical thermodynamics using Monte Carlo techniques.38 High-throughput ab initio molecular dynamics and quantum mechanical calculations are also becoming more accessible, though they still require significant computational time. Regardless of the type of simulations, it is necessary to prepare a dataset of structures to run through.
Several research groups published their methods for the extraction of a dataset of experimental and already synthesised MOFs.39–41 Since most research groups focused on gas adsorption applications, the selected structures were ‘porous’ 3D MOFs; the porosity being defined differently by each research group. All the MOF structures were extracted from the CSD, before further data filtering, processing and cleaning in order to prepare them for simulations. Among the most common data processing steps are bound and/or unbound solvent removal, the addition of missing hydrogens and elimination or repair of disordered structures. Watanabe et al. extracted 30000 MOFs from the CSD, although no details were given regarding the selection of MOFs from the CSD.39 Later on, Goldsmith et al. used a set of labelled MOFs and an algorithm to determine the features that indicate if a structure is a MOF.40 Based on these features, they extracted 38800 structures using unspecified CSD tools. Chung et al. developed the computation-ready, experimental (CoRE) MOF database, the first publicly available database of MOFs; in 2019, the CoRE MOF database was updated to contain over 14000 curated structures.41,42 The selection of structures from the CSD used ConQuest and their own definition of a MOF. A subset of the CoRE MOF database was further optimised with density functional theory methods.43 Users should be aware that, although a significant number of structures from the CoRE MOF database still have their original CSD refcode, they have been modified to be simulation-ready. Most recently, we developed the CSD MOF subset using criteria drawn in ConQuest to capture MOFs and MOF-like structures.7 Conversely to the previous datasets, the CSD MOF subset was designed to be of use to researchers working on applications that are not restricted to gas adsorption. The subset thus contains 1D, 2D and 3D MOFs that do not necessarily have any apparent porosity. These criteria are implemented in the CSD as a filter so that the dataset is automatically updated, along with the quarterly CSD updates. These criteria are also very flexible and can be easily tailored to better fit the evolution of the definition of MOFs.7,8 The structures in the CSD MOF subset are the original data as-deposited and curated by the CCDC.
The recent efforts in the development of MOF databases have spread the use of HTS on MOFs for a wide variety of gas adsorption applications. The subset obtained by Watanabe et al. for instance was further processed and analysed before retaining 359 MOFs for the simulation of CO2/N2 separation with grand canonical Monte Carlo.39 These materials were then ranked for their separation performance. Goldsmith et al. used their subsets to determine the theoretical limits of hydrogen storage in MOFs, by correlating the structures' surface area and the hydrogen excess uptakes.40 The assignment of density-derived electrostatic and chemical (DDEC)44,45 charges to structures from the CoRE MOF database enabled simulations where electrostatic interactions play a major role. Using the DDEC database, Moghadam et al. found the best existing candidate for oxygen storage, UMCM-152.46 This structure was then synthesised and its uptake experimentally confirmed to be 22.5% higher than the previously best-performing structure reported in the literature. In addition to identifying the best candidate for a given application, more efforts are now put towards mapping the landscape of MOFs' properties. Along with the (re)discovery of UMCM-152, Moghadam et al. published an online interactive data explorer where users can plot all the available textural and adsorption properties in order to spot interesting structure–property trends and potential structures of interest. The observations made from this visualisation can highlight interesting structural behaviours and guide researchers towards a more rational design of MOFs. Very recently, Boyd et al. used such data mining and visualisation methods to design two MOFs with higher wet flue gas CO2/N2 selectivity than available commercial materials.47
4. Which database to use?
The availability of two easily accessible databases – CoRE MOF and the CSD MOF subset – have sparked questions among computational researchers: which database should be used? How different are they? What kind of impact will one database or another have on the final simulated results? Altintas et al. reported the comparison of the two databases (CoRE MOF version 2014 and non-disordered CSD MOF subset version 5.37 May 2016, where the authors also removed solvents using the provided Python script) in the case of 3D MOFs for methane and hydrogen adsorption.48 Among the 3490 structures in common in the two datasets, 387 differed significantly in the final gas uptakes. These differences stem from the different modifications the original data underwent during the cleaning process in both databases. The authors went on to compare the uptake obtained in both cases to the actually measured uptake from the original papers. According to this study, neither database is in perfect agreement with reported experimental results. However, the exact changes applied to the original CSD CIF files were also not made clear for the comparison of these two datasets. Although the nature of the modifications made on the original CSD data to obtain CoRE MOF is known, it is difficult to understand what exactly has been modified from the final CIF file and the impact of these changes on the simulated uptake. Similarly, although the provided Python script for the removal of bound and unbound solvent was used on the CSD MOF subset, it is unclear on which subsets of structures it was run for this comparison. As we and others highlight and insist, researchers should be extremely careful when removing bound solvents, as the MOFs' structural integrity might be impacted, resulting in unrealistic simulated uptakes and selectivities.7,49To overcome the issue of reproducibility, a trackable workflow such as the automated interactive infrastructure and database for computational science (AiiDA) could be helpful.50 Ongari et al. recently demonstrated the use of AiiDA on a database of CURATED (clean, uniform, and refined with automatic tracking from experimental database) covalent-organic frameworks (COFs).51 The workflow and results obtained at each stage are available online on the Materials Cloud platform.50 Though promising, implementing such a workflow will need significant effort from the computational MOF community. In the meantime, we encourage users to report as much information as possible at every step for better reproducibility. Below, we provide some advice on how to better use two CSD tools – ConQuest and the CSD Python API. We also give some additional information on how to use the previously published Python script for the removal of solvents.
5. Using ConQuest to access the MOF subset
One of the most used search tools within ConQuest is Draw. With this function, users can draw entire molecules or fragments that should be contained in the targeted structure. The criteria developed for the CSD MOF subset heavily used Draw. To access the CSD MOF subset, simply open ConQuest, then on the top menu bar, navigate to View Databases > Lists in CSD version X [this will depend on your version of the software] > MOF subset. There is an additional Non-disordered MOF subset in this list, which can be used as a starting point for HTS. However, the term ‘non-disordered’ here can be misleading and deserves further explanation. The crystallographic disorder is flagged differently in the CSD depending on the exact nature of the disorder. A structure is normally classified as disordered if there is any non-hydrogen disorder present in the whole structure, that is the framework and any other unmodelled molecule present – i.e. solvent and guest molecules commonly seen in MOF-like compounds where the disordered solvent is treated using the Platon/Squeeze52 or Olex2/Mask53 tools. In other words, a non-disordered structure in the CSD might still have missing or disordered hydrogen atoms. However, the Non-disordered MOF subset is intended to contain structures with no disorder within the framework, including no hydrogen disorder or missing hydrogens, but there might still be disorder in the unmodelled molecules. The algorithm developed for identifying these ‘non-disordered’ MOFs works as follows: i) look for disordered atoms (i.e. cases of multi-site disorder); ii) search for the nearest neighbouring non-disordered atom; iii) if this non-disordered atom is part of the framework, the structure is considered as disordered, if not, (i.e. near a solvent molecule), it is considered as non-disordered. Fig. 2 summarises the organisation of the MOF subsets in the CSD. We invite users to explore the differences in disorders by comparing the Non-disordered MOF subset and a search with the ‘non-disordered’ filter in the main MOF subset. In the latter case, the ‘non-disordered’ filter applied to the CSD MOF subset excludes entries with the disorder in the unmodelled molecules but keeps frameworks with hydrogen disorder. Fig. S1† gives a summary of the differences and overlaps between these two subsets. Errors might still exist in the database and users are encouraged to report them to the CCDC. A non-exhaustive list of erroneous entries in the Non-disordered MOF subset is provided in Table S1.† Once the desired subset loaded, users can export the list of structures by going to File > Export Entries as. This will trigger a window to pop up, and users can choose between different formats and the folder to export to. Among the most common formats are the GCD file, a text file containing the list of recodes (choose Refcode: CSD entry identifier list for this format), the CIF and the PDB files. The GCD file can then be opened in Mercury for easier visualisation, polymer expansions and further analyses. It can also be used with the CSD Python API, albeit without the visualisation capability. We explained here how to access the entire CSD MOF subset. For users interested in retrieving structures from the latest updates only, more details are given in the ESI.†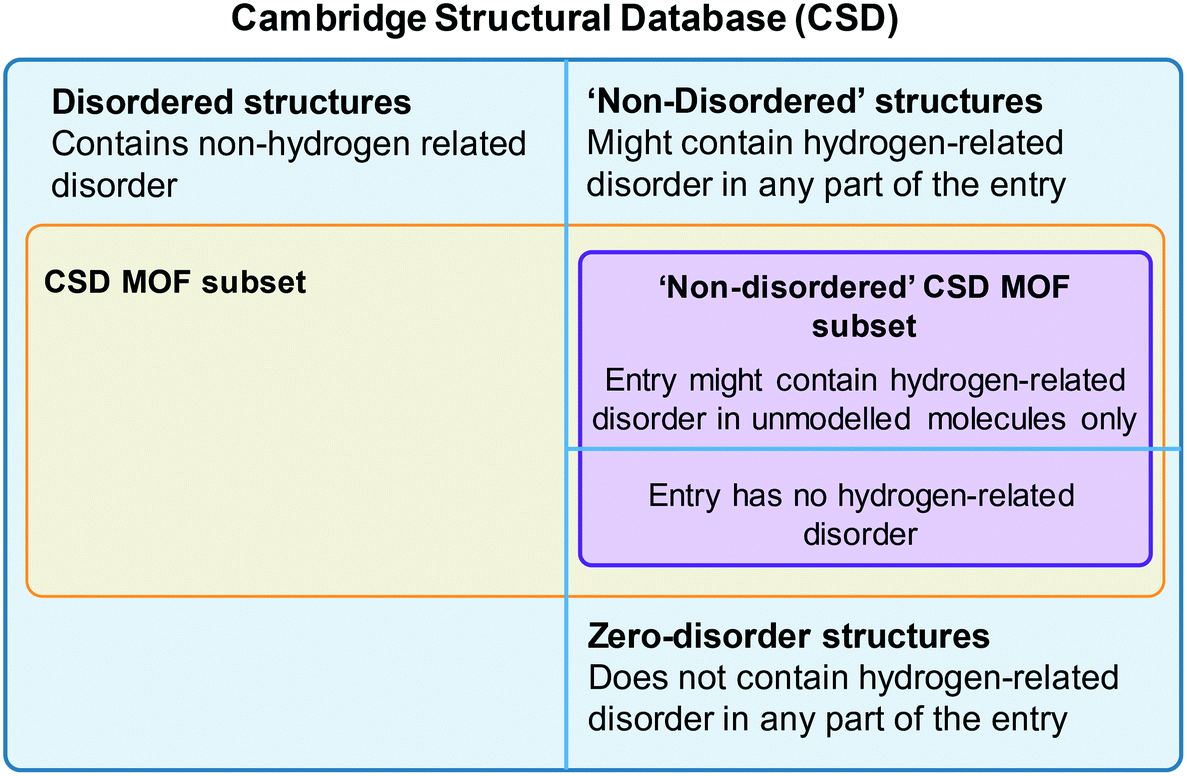 | ||
| Fig. 2 Organisation of the MOF data in the CSD. | ||
6. Tips on ConQuest queries
Although a MOF subset is provided, we encourage users to perform their own searches within either the CSD or the MOF subsets and, most importantly, to report the exact queries used when publishing. Indeed, we noticed that queries are rarely reported or, at best, only translated into words. These can be highly misinterpreted and have very low reproducibility. We also noticed that, often, only one Draw query is mentioned, when most of the time, a combination of different queries is necessary to cover the whole spectrum of possible results. Since the basics of how to use ConQuest for queries are covered in the user guide (available in Help > Help Index) or online,54 we will only give a few comments on how to improve MOF searches.Draw is a deceiving function, as it appears simple and easy to use when experience shows that proper usage really is an art that requires many trials and errors. When a Draw query is made, ConQuest will look through the 2D diagrams of the CSD structures and find an exact match to these 2D diagrams (also called Chemical Diagram in Mercury). There are different ways of representing the same structures with a 2D diagram, and this is especially the case for extended structures since they are only partially represented with the help of ‘polymeric’ bonds.55 As defined previously, ‘polymeric’ bonds are the essence of extended structures. Thinking about where and how the polymeric bond can be defined in a repeating unit is tricky. Fig. 1 shows two structures containing carboxylate ligands connected to zinc atoms – one of the simplest configurations. As highlighted by the blue circles, there are at least two ways of representing such a linkage. A single query describing the circled linkage in Fig. 3a seems intuitive but is too specific and will miss structures such as the one in Fig. 3b. Therefore, we highly encourage researchers to examine the resulting diagrams after each search. These are displayed in the View Results panel by default, where the matching substructure is highlighted in red. This will guide users towards a better-tuned query, or to combining different queries instead. Users can either create different queries and combine the resulting hitlists in Manage Hitlists or combine queries directly in the Combine Queries panel.
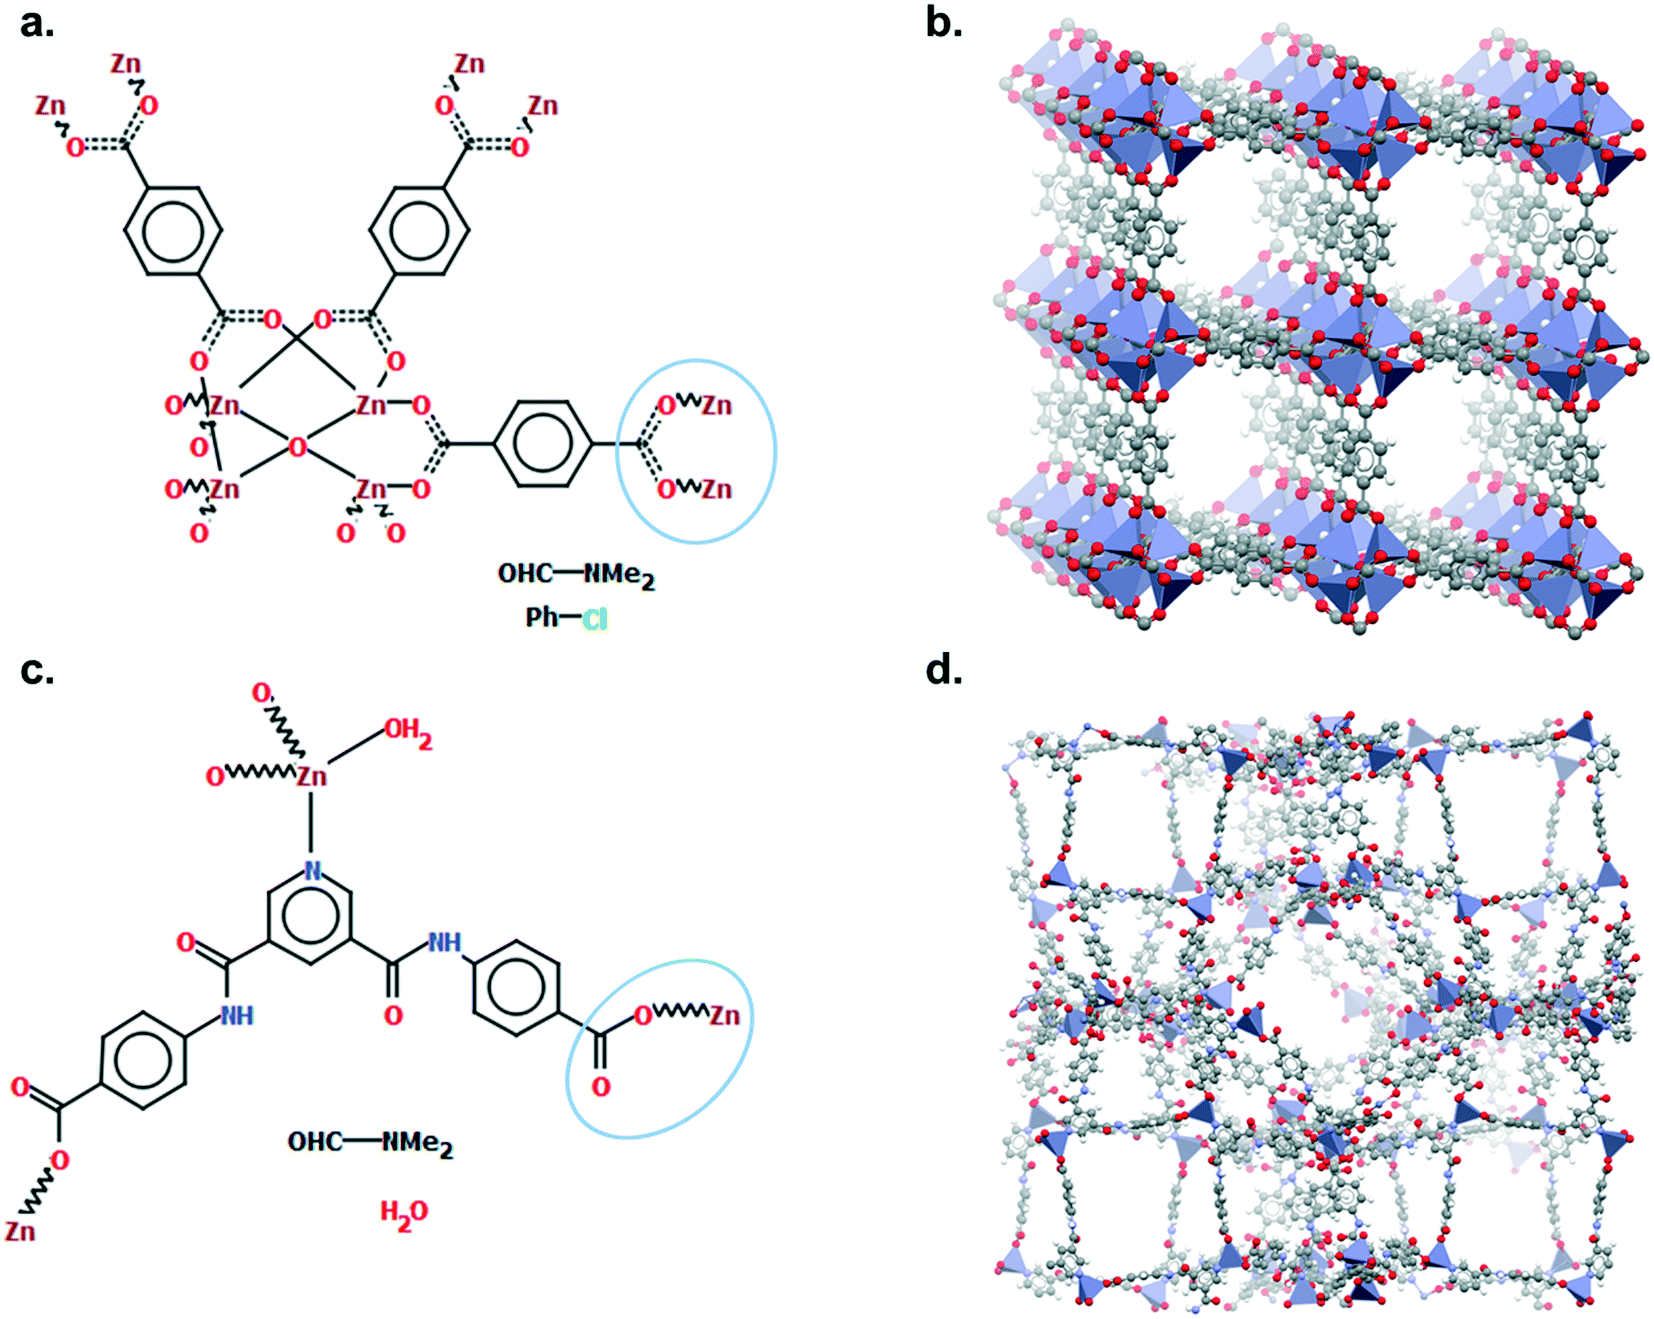 | ||
| Fig. 3 Example of two different ways of representing carboxylate ligands: a. chemical diagram of SAHYIK, b. 3D representation of SAHYIK, c. chemical diagram of ADUROI and d. 3D representation of ADUROI. | ||
When a set of queries is satisfactory, it can be saved and exported to be reused by other users. We recommend attaching these files in the ESI† of papers where these searches are relevant. Each Draw query can be saved as a CON file by going to File > Export QUEST query in the Draw window and retrieved by going to File > Read QUEST query. If a similar Draw query needs to be used several times with little differences, it can be saved as a template in File > Save Template. To save a list of queries, users can go to File > Save Queries and choose between saving all queries, a single query or the selected queries.
7. Removing solvents with the CSD Python API
Once the desired MOF subset is obtained from ConQuest and saved as a GCD file, users can explore the data with the CSD Python API for more efficient data mining and structures modification. The CCDC has a thorough guide on how to use the API at https://downloads.ccdc.cam.ac.uk/documentation/API/. We particularly recommend the ‘Quick Primer’ section for anyone new to the API. This will explain how to load the MOF subset from the obtained GCD list and how to retrieve simple information. For the removal of bound and unbound solvents, we previously published a Python script that takes a GCD list of structures, a solvent list when necessary and outputs the desired CIF files.7 The algorithm looks for metal atoms present in the framework, removes all bonds around them, and compares the removed fragments to a list of solvent. When no list is provided by the user, the algorithm uses the default CCDC most common solvent list. A step-by-step guide for using the Python script is provided in the ESI.† It is important to note here that the provided script will remove both bound and unbound solvents. However, as explained previously, we recommend removing bound solvents on specific cases only (such as structures containing Cu–Cu paddlewheels or similar to CPO-27/MOF-74). To remove unbound solvent only with this script, use an empty solvent file. Another simple way of obtaining the same result with the API would be to look for the heaviest weight component (heaviest_component) of an entry and return only this part of the entry as a CIF file. The heaviest_component corresponds to the component in the CSD entry with the highest molecular weight, a component being a group of atoms linked with bonds and thus forming a distinct unit. The heaviest_component is – in general – the framework. However, exceptions exist and it is wise to check that it is indeed polymeric (i.e. by using the is_polymeric attribute). If it is not, one of the substructures must be polymeric by definition of the subset, and that substructure should be kept as the framework.Along with the previous script, we also provided an alternative where users can remove bound and unbound solvents on a single entry at a time in Mercury.7 This could be useful for researchers who are only interested in a couple of structures. Details on how to operate this script are given in the ESI.†
8. Adding missing hydrogens
As explained earlier, the non-disordered MOF subset should not include frameworks with missing hydrogens. However, ‘missing hydrogens’ is another misleading expression that requires clarification. In a CSD entry, only the atoms modelled from the original data have coordinates and can be visualised in Mercury. Hydrogen atoms are sometimes not found in the original data, therefore not modelled, but are still accounted for in the CSD so the overall structure makes chemical sense. These hydrogen atoms are referred to as ‘siteless hydrogens’ in the CSD. They do not appear in the original structure's CIF file but are taken into account in the 2D diagrams and in search queries. Fig. 4 shows the example of RUBTAK01, one of many entry versions of UiO-66 in the CSD. RUBTAK01 is part of the non-disordered MOF subset and has siteless hydrogens. To obtain the coordinates of these siteless hydrogens, we recommend users to apply the add_hydrogens function available in the API. To compute the position of a missing hydrogen, the add_hydrogen function refers to the ‘ideal’ geometry calculated based on the standard chemistry of the structure. The bond lengths, angles and torsions of this ideal geometry are obtained from averaging neutron diffraction values. The added hydrogen atoms will then appear in the CIF file. Equivalent solutions exist in Mercury. To edit the structure manually, go to Edit > Edit Structure, click on Hydrogen Atoms. Insert the number of desired hydrogen atoms on the right, then click on the atoms to which these hydrogen atoms should be added. To edit the structure automatically, go to Edit > Auto Edit Structure. Select Add missing H atoms and click Apply.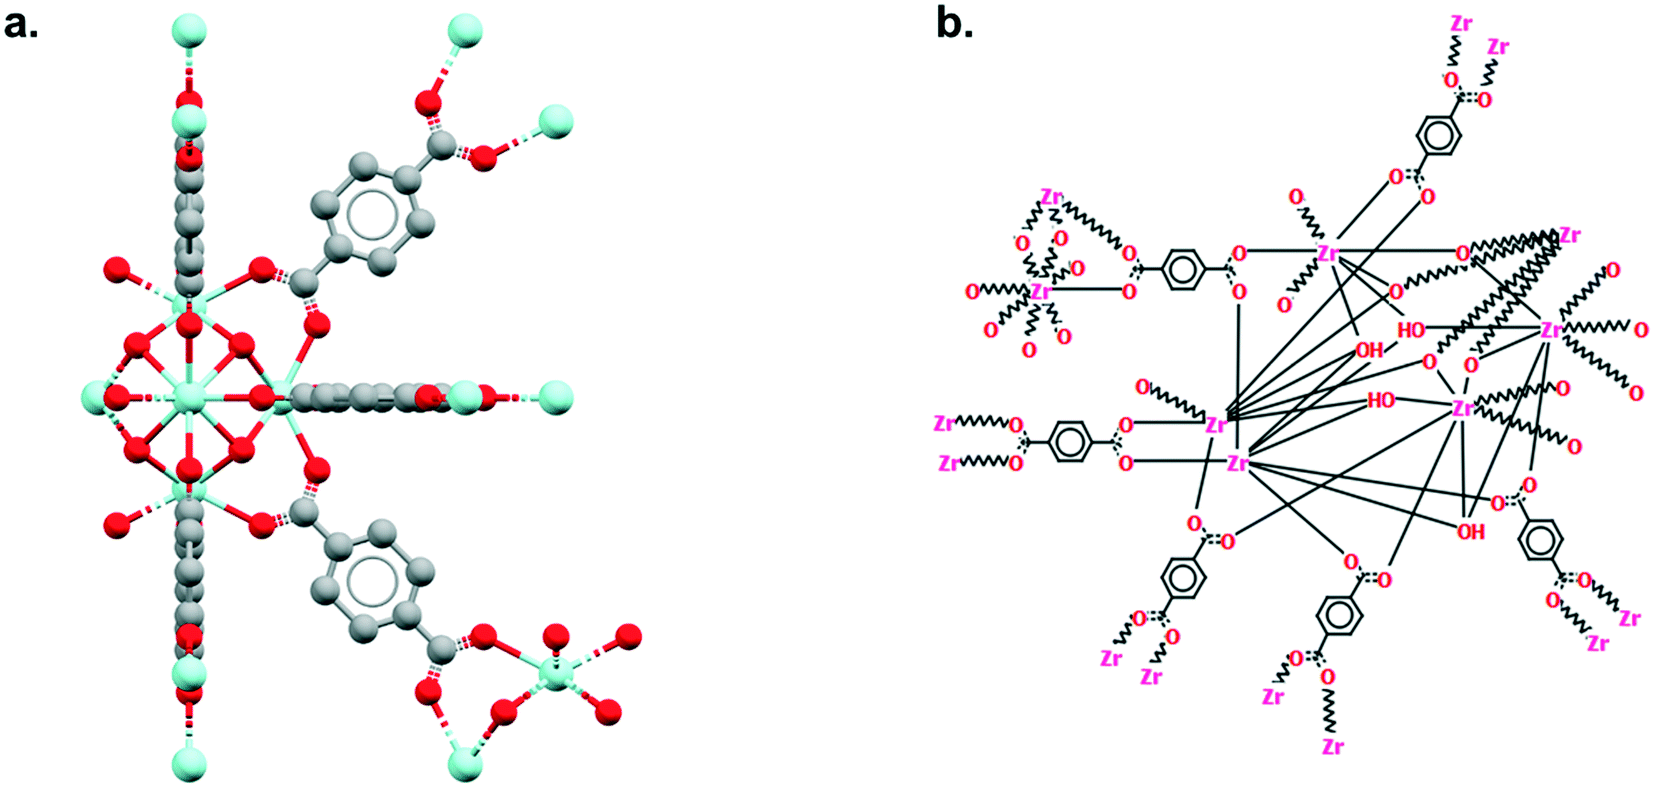 | ||
| Fig. 4 Example of a structure from the non-disordered MOF subset with siteless hydrogen atoms: UiO-66 (CSD refcode: RUBTAK01). a. 3D visualization of a repeating unit in Mercury. b. 2D (hydrogen-depleted) diagram available in Mercury. | ||
9. Outlook
We have reviewed the most common usage of the CSD for MOFs applications and provided some tips on how to use the existing CSD tools. Users should now be able to access the CSD MOF subset, perform and share better queries, remove bound and/or unbound solvent using the CSD Python API and add missing hydrogens. These manipulations should be enough for simulations where electrostatic interactions between the framework and the adsorbed molecules are neglected. Multiple external methods exist for the assignment of partial charges and we refer readers to the literature in order to choose the most appropriate one for their application.45,56As described in this paper, designing the best search query is not straightforward and there is currently no easy checks to determine how many structures can be missed; that is, how accurate a certain query is. The CCDC has already started assigning to some MOFs their common names (e.g. HKUST-1, MOF-5, etc.). This information can be searched for as a string. We believe this effort will greatly facilitate the search for specific types of well-known MOFs. We also propose to flag any future deposition as ‘MOF’ vs. ‘non-MOF’ and to double-check with the automatically updated CSD MOF subset, to ensure the accuracy of the criteria defined.
It is worth reminding that the CSD MOF subset is an experimental database, and as such, the quality of the final data available depends highly on the deposited experimental data itself, even after being edited by the CCDC. Each CIF file undergoes a thorough validation process upon deposition: first, it needs to pass a series of 539 detailed automated checks, the list of which is available online.57 Second, a chemical structure is automatically assigned and its reliability is determined based on the other validated CSD structures.58 Third, a scientific editor manually checks the structure before it is released with the publication of the research.59 The complexity of handling such a large amount of experimental data means that errors are inevitable. We thus encourage MOF researchers – experimentalists and computationalists alike – to familiarise themselves with the general guidelines on good quality CIFs60 and to report any error to the CCDC.
Amongst other recent discussed issues in the HTS for MOFs community is that of identical and similar structures found in the CSD. Indeed, the same MOF is often represented several times, corresponding to syntheses performed in different research groups or measurements obtained under different conditions. HKUST-1 alone is present at least 50 times.41 Whether or not users should discard similar structures depends on the exact research. The presence of numerous identical structures can indeed skew a data analysis, but the study of a variety of similar structures may also reveal interesting structural behaviours. A possible solution to identifying these MOFs is to flag them in the CSD, provided a concept of similarity can be agreed on. Currently, similar structures in the CSD are assembled under the same refcode family. Entries from the same family share the same six-letter code but have different ending digits. RUBTAK and RUBTAK01 are for instance two similar entries corresponding to UiO-66. CSD editors use different techniques – including molecules overlay and powder patterns analyses – and the chemistry described by the authors to assess the similarity of two molecules. However, this classification is not straightforward for MOFs, as two identical frameworks with different or unknown guest molecules will not be considered as part of the same family. Barthel et al. proposed to exploit the structures' bond networks to determine whether two structures should be considered as duplicates.61 In their case, after analysing 502 CoRE MOFs with assigned partial charges, 15.5% were found redundant. Bucior et al. recently developed systematic identifiers that assign to each unique MOF a MOFid and a MOFkey using automated cheminformatics algorithms.62 These methods could not only identify duplicates but also initiate a more standardised way of naming MOFs. The latest update of CoRE MOF includes a similarity check performed with a Python script that compares the CIF files directly.42 The StructureMatcher algorithm from Pymatgen, an open-source Python library for materials analysis, uses a similar method.42,63
As the field of gas adsorption is growing wider, and more researchers carry out similar simulations using the CSD data, it can be power- and time-saving to gather the obtained results and link them to the CSD. We are working currently with the CCDC to include geometrical and calculated gas uptakes to the MOF structures' information. Several research groups have started to exploit the power of machine learning to rapidly predict gas uptakes by training their algorithms on data calculated from hypothetical and experimental databases.64–68 Bucior et al. for instance used the adsorbate–adsorbent energy as a descriptor to screen the CSD MOF subset.69 Further GCMC simulations were then run on the top-performing structures, before identifying the most promising MOF for hydrogen storage. This structure was then synthesised and its hydrogen storage capacity experimentally confirmed. Combining machine learning and a reduced number of simulations, in this case, used less than 10% of the computational resources of a brute-force screening method. Using a genetic algorithm on the CoRE MOF database, Chung et al. successfully identified a top-performing structure for carbon capture.70 The MOF was then synthesised and its working capacity was found to be higher than any other structures reported then. This genetic algorithm was estimated to reduce the total computational time by two orders of magnitude. Machine learning is a promising and powerful tool, whose accuracy also depends on the quality of the data it is trained on. We, therefore, hope this review is the first step for MOF scientists towards a clearer understanding of what the MOF data consist of in the CSD, and how they can be modified.
10. Glossary
CSD MOF subset
A subset of MOFs from the CSD accessible with a CCDC license. It contains the original data deposited and edited by the CCDC, without any further data processing.CSD Python API
An API is a set of routines, protocols and tools for building software applications. It specifies how different components of an application should interact. The API used with the CSD is based on Python.Non-disordered CSD MOF subset
A subset of the CSD MOF subset, it is intended to contain frameworks without any missing hydrogens. The unmodelled molecules, however, can still contain hydrogen-related disorder.Polymeric bond
A CCDC-specific type of bond that corresponds to a bond between repeating units. It is used to define extended structures.Conflicts of interest
There are no conflicts to declare.Acknowledgements
D. F.-J. thanks the Royal Society for funding through a University Research Fellowship. We acknowledge funding from the European Research Council (ERC) under the European Union's Horizon 2020 research and innovation programme (NanoMOFdeli), ERC-2016-COG 726380. We thank the Cambridge Crystallographic Data Centre for the provision of studentship funding to A. L.References
- H. Li, M. Eddaoudi, M. O'Keeffe and O. M. Yaghi, Nature, 1999, 402, 276 CrossRef CAS.
- B. F. Hoskins and R. Robson, J. Am. Chem. Soc., 1989, 111, 5962–5964 CrossRef CAS.
- G. Maurin, C. Serre, A. Cooper and G. Ferey, Chem. Soc. Rev., 2017, 46, 3104–3107 RSC.
- S. Kitagawa, R. Kitaura and S.-i. Noro, Angew. Chem., Int. Ed., 2004, 43, 2334–2375 CrossRef CAS PubMed.
- A. K. Cheetham, G. Férey and T. Loiseau, Angew. Chem., Int. Ed., 1999, 38, 3268–3292 CrossRef CAS PubMed.
- A. G. Slater and A. I. Cooper, Science, 2015, 348, aaa8075 CrossRef PubMed.
- P. Z. Moghadam, A. Li, S. B. Wiggin, A. Tao, A. G. P. Maloney, P. A. Wood, S. C. Ward and D. Fairen-Jimenez, Chem. Mater., 2017, 29, 2618–2625 CrossRef CAS.
- R. Batten Stuart, R. Champness Neil, X.-M. Chen, J. Garcia-Martinez, S. Kitagawa, L. Öhrström, M. O'Keeffe, M. Paik Suh and J. Reedijk, in Pure and Applied Chemistry, 2013, vol. 85, p. 1715 Search PubMed.
- S. R. Batten, N. R. Champness, X.-M. Chen, J. Garcia-Martinez, S. Kitagawa, L. Öhrström, M. O'Keeffe, M. P. Suh and J. Reedijk, CrystEngComm, 2012, 14, 3001–3004 RSC.
- M. Eddaoudi, D. B. Moler, H. Li, B. Chen, T. M. Reineke, M. O'Keeffe and O. M. Yaghi, Acc. Chem. Res., 2001, 34, 319–330 CrossRef CAS PubMed.
- O. K. Farha, I. Eryazici, N. C. Jeong, B. G. Hauser, C. E. Wilmer, A. A. Sarjeant, R. Q. Snurr, S. T. Nguyen, A. Ö. Yazaydın and J. T. Hupp, J. Am. Chem. Soc., 2012, 134, 15016–15021 CrossRef CAS PubMed.
- D. A. Gomez-Gualdron, Y. J. Colon, X. Zhang, T. C. Wang, Y.-S. Chen, J. T. Hupp, T. Yildirim, O. K. Farha, J. Zhang and R. Q. Snurr, Energy Environ. Sci., 2016, 9, 3279–3289 RSC.
- L. J. Murray, M. Dinca and J. R. Long, Chem. Soc. Rev., 2009, 38, 1294–1314 RSC.
- R. B. Getman, Y.-S. Bae, C. E. Wilmer and R. Q. Snurr, Chem. Rev., 2012, 112, 703–723 CrossRef CAS PubMed.
- Y. He, W. Zhou, G. Qian and B. Chen, Chem. Soc. Rev., 2014, 43, 5657–5678 RSC.
- J. A. Mason, J. Oktawiec, M. K. Taylor, M. R. Hudson, J. Rodriguez, J. E. Bachman, M. I. Gonzalez, A. Cervellino, A. Guagliardi, C. M. Brown, P. L. Llewellyn, N. Masciocchi and J. R. Long, Nature, 2015, 527, 357–361 CrossRef CAS PubMed.
- B. Van de Voorde, B. Bueken, J. Denayer and D. De Vos, Chem. Soc. Rev., 2014, 43, 5766–5788 RSC.
- J.-R. Li, J. Sculley and H.-C. Zhou, Chem. Rev., 2012, 112, 869–932 CrossRef CAS PubMed.
- H. Furukawa, K. E. Cordova, M. O'Keeffe and O. M. Yaghi, Science, 2013, 341, 1230444 CrossRef PubMed.
- P. Z. Moghadam, J. F. Ivy, R. K. Arvapally, A. M. dos Santos, J. C. Pearson, L. Zhang, E. Tylianakis, P. Ghosh, I. W. H. Oswald, U. Kaipa, X. Wang, A. K. Wilson, R. Q. Snurr and M. A. Omary, Chem. Sci., 2017, 8, 3989–4000 RSC.
- N. S. Bobbitt, M. L. Mendonca, A. J. Howarth, T. Islamoglu, J. T. Hupp, O. K. Farha and R. Q. Snurr, Chem. Soc. Rev., 2017, 46, 3357–3385 RSC.
- J. Lee, O. K. Farha, J. Roberts, K. A. Scheidt, S. T. Nguyen and J. T. Hupp, Chem. Soc. Rev., 2009, 38, 1450–1459 RSC.
- T. Zhang and W. Lin, Chem. Soc. Rev., 2014, 43, 5982–5993 RSC.
- S. M. J. Rogge, A. Bavykina, J. Hajek, H. Garcia, A. I. Olivos-Suarez, A. Sepulveda-Escribano, A. Vimont, G. Clet, P. Bazin, F. Kapteijn, M. Daturi, E. V. Ramos-Fernandez, F. X. Llabres i Xamena, V. Van Speybroeck and J. Gascon, Chem. Soc. Rev., 2017, 46, 3134–3184 RSC.
- M. H. Teplensky, M. Fantham, P. Li, T. C. Wang, J. P. Mehta, L. J. Young, P. Z. Moghadam, J. T. Hupp, O. K. Farha, C. F. Kaminski and D. Fairen-Jimenez, J. Am. Chem. Soc., 2017, 139, 7522–7532 CrossRef CAS PubMed.
- P. Horcajada, T. Chalati, C. Serre, B. Gillet, C. Sebrie, T. Baati, J. F. Eubank, D. Heurtaux, P. Clayette, C. Kreuz, J.-S. Chang, Y. K. Hwang, V. Marsaud, P.-N. Bories, L. Cynober, S. Gil, G. Férey, P. Couvreur and R. Gref, Nat. Mater., 2010, 9, 172–178 CrossRef CAS PubMed.
- J. Della Rocca, D. Liu and W. Lin, Acc. Chem. Res., 2011, 44, 957–968 CrossRef CAS PubMed.
- P. Li, J. A. Modica, A. J. Howarth, L. Vargas, P. Z. Moghadam, R. Q. Snurr, M. Mrksich, J. T. Hupp and O. K. Farha, Chem, 2016, 1, 154–169 CAS.
- I. Abánades Lázaro, S. Haddad, S. Sacca, C. Orellana-Tavra, D. Fairen-Jimenez and R. S. Forgan, Chem, 2017, 2, 561–578 Search PubMed.
- S. E. Miller, M. H. Teplensky, P. Z. Moghadam and D. Fairen-Jimenez, Interface Focus, 2016, 6, 20160027 CrossRef PubMed.
- I. J. Bruno, J. C. Cole, P. R. Edgington, M. Kessler, C. F. Macrae, P. McCabe, J. Pearson and R. Taylor, Acta Crystallogr., Sect. B: Struct. Sci., 2002, 58, 389–397 CrossRef PubMed.
- C. R. Groom, I. J. Bruno, M. P. Lightfoot and S. C. Ward, Acta Crystallogr., Sect. B: Struct. Sci., Cryst. Eng. Mater., 2016, 72, 171–179 CrossRef CAS PubMed.
- CCDC, Mercury User Guide and Tutorials, https://www.ccdc.cam.ac.uk/support-and-resources/CCDCResources/Mercury_UserGuide.pdf Search PubMed.
- N. W. Ockwig, O. Delgado-Friedrichs, M. O'Keeffe and O. M. Yaghi, Acc. Chem. Res., 2005, 38, 176–182 CrossRef CAS PubMed.
- J. D. Evans, G. Fraux, R. Gaillac, D. Kohen, F. Trousselet, J.-M. Vanson and F.-X. Coudert, Chem. Mater., 2017, 29, 199–212 CrossRef CAS.
- T. F. Willems, C. H. Rycroft, M. Kazi, J. C. Meza and M. Haranczyk, Microporous Mesoporous Mater., 2012, 149, 134–141 CrossRef CAS.
- L. Sarkisov and A. Harrison, Mol. Simul., 2011, 37, 1248–1257 CrossRef CAS.
- D. Dubbeldam, S. Calero, D. E. Ellis and R. Q. Snurr, Mol. Simul., 2016, 42, 81–101 CrossRef CAS.
- T. Watanabe and D. S. Sholl, Langmuir, 2012, 28, 14114–14128 CrossRef CAS PubMed.
- J. Goldsmith, A. G. Wong-Foy, M. J. Cafarella and D. J. Siegel, Chem. Mater., 2013, 25, 3373–3382 CrossRef CAS.
- Y. G. Chung, J. Camp, M. Haranczyk, B. J. Sikora, W. Bury, V. Krungleviciute, T. Yildirim, O. K. Farha, D. S. Sholl and R. Q. Snurr, Chem. Mater., 2014, 26, 6185–6192 CrossRef CAS.
- Y. G. Chung, E. Haldoupis, B. J. Bucior, M. Haranczyk, S. Lee, H. Zhang, K. D. Vogiatzis, M. Milisavljevic, S. Ling, J. S. Camp, B. Slater, J. I. Siepmann, D. S. Sholl and R. Q. Snurr, Journal of Chemical & Engineering Data, 2019 Search PubMed.
- D. Nazarian, J. S. Camp, Y. G. Chung, R. Q. Snurr and D. S. Sholl, Chem. Mater., 2017, 29, 2521–2528 CrossRef CAS.
- T. A. Manz and D. S. Sholl, J. Chem. Theory Comput., 2010, 6, 2455–2468 CrossRef CAS PubMed.
- D. Nazarian, J. S. Camp and D. S. Sholl, Chem. Mater., 2016, 28, 785–793 CrossRef CAS.
- P. Z. Moghadam, T. Islamoglu, S. Goswami, J. Exley, M. Fantham, C. F. Kaminski, R. Q. Snurr, O. K. Farha and D. Fairen-Jimenez, Nat. Commun., 2018, 9, 1378 CrossRef PubMed.
- P. G. Boyd, A. Chidambaram, E. García-Díez, C. P. Ireland, T. D. Daff, R. Bounds, A. Gładysiak, P. Schouwink, S. M. Moosavi, M. M. Maroto-Valer, J. A. Reimer, J. A. R. Navarro, T. K. Woo, S. Garcia, K. C. Stylianou and B. Smit, Nature, 2019, 576, 253–256 CrossRef CAS PubMed.
- C. Altintas, G. Avci, H. Daglar, A. N. V. Azar, I. Erucar, S. Velioglu and S. Keskin, J. Mater. Chem. A, 2019, 7, 9593–9608 RSC.
- P. Zarabadi-Poor and R. Marek, ACS Appl. Mater. Interfaces, 2019, 11, 16261–16265 CrossRef CAS PubMed.
- G. Pizzi, A. Cepellotti, R. Sabatini, N. Marzari and B. Kozinsky, Comput. Mater. Sci., 2016, 111, 218–230 CrossRef.
- D. Ongari, A. V. Yakutovich, L. Talirz and B. Smit, ACS Cent. Sci., 2019, 5, 1663–1675 CrossRef CAS PubMed.
- A. Spek, Acta Crystallogr., Sect. C: Struct. Chem., 2015, 71, 9–18 CrossRef CAS PubMed.
- O. V. Dolomanov, L. J. Bourhis, R. J. Gildea, J. A. K. Howard and H. Puschmann, J. Appl. Crystallogr., 2009, 42, 339–341 CrossRef CAS.
- CCDC, ConQuest User Guide and Tutorials, https://www.ccdc.cam.ac.uk/support-and-resources/ccdcresources/ConQuest-UserGuide.pdf Search PubMed.
- CCDC, https://www.ccdc.cam.ac.uk/support-and-resources/support/case/?caseid=f75281ce-d3fe-472e-8438-7b6cdea5accb, 2019.
- S. Hamad, S. R. G. Balestra, R. Bueno-Perez, S. Calero and A. R. Ruiz-Salvador, J. Solid State Chem., 2015, 223, 144–151 CrossRef CAS.
- IUCr, Details of checkCIF/PLATON tests, http://journals.iucr.org/services/cif/datavalidation.html, 2020 Search PubMed.
- I. J. Bruno, G. P. Shields and R. Taylor, Acta Crystallogr., Sect. B: Struct. Sci., 2011, 67, 333–349 CrossRef CAS PubMed.
- S. Holgate, CSD Data Curation - The Human Touch, https://www.ccdc.cam.ac.uk/Community/blog/CSD-data-curation-the-human-touch/, 2020 Search PubMed.
- CCDC, The CCDC CIF Deposition Guidelines, https://www.ccdc.cam.ac.uk/Community/depositastructure/cif-deposition-guidelines/, 2020 Search PubMed.
- S. Barthel, E. V. Alexandrov, D. M. Proserpio and B. Smit, Cryst. Growth Des., 2018, 18, 1738–1747 CrossRef CAS PubMed.
- B. J. Bucior, A. S. Rosen, M. Haranczyk, Z. Yao, M. E. Ziebel, O. K. Farha, J. T. Hupp, J. I. Siepmann, A. Aspuru-Guzik and R. Q. Snurr, Cryst. Growth Des., 2019, 19, 6682–6697 CrossRef CAS.
- S. P. Ong, W. D. Richards, A. Jain, G. Hautier, M. Kocher, S. Cholia, D. Gunter, V. L. Chevrier, K. A. Persson and G. Ceder, Comput. Mater. Sci., 2013, 68, 314–319 CrossRef CAS.
- M. Pardakhti, E. Moharreri, D. Wanik, S. L. Suib and R. Srivastava, ACS Comb. Sci., 2017, 19, 640–645 CrossRef CAS PubMed.
- M. Fernandez, T. K. Woo, C. E. Wilmer and R. Q. Snurr, J. Phys. Chem. C, 2013, 117, 7681–7689 CrossRef CAS.
- M. Fernandez, P. G. Boyd, T. D. Daff, M. Z. Aghaji and T. K. Woo, J. Phys. Chem. Lett., 2014, 5, 3056–3060 CrossRef CAS PubMed.
- R. Anderson, J. Rodgers, E. Argueta, A. Biong and D. A. Gómez-Gualdrón, Chem. Mater., 2018, 30, 6325–6337 CrossRef CAS.
- G. Borboudakis, T. Stergiannakos, M. Frysali, E. Klontzas, I. Tsamardinos and G. E. Froudakis, npj Comput. Mater., 2017, 3, 40 CrossRef.
- B. J. Bucior, N. S. Bobbitt, T. Islamoglu, S. Goswami, A. Gopalan, T. Yildirim, O. K. Farha, N. Bagheri and R. Q. Snurr, Mol. Syst. Des. Eng., 2019, 4, 162–174 RSC.
- Y. G. Chung, D. A. Gómez-Gualdrón, P. Li, K. T. Leperi, P. Deria, H. Zhang, N. A. Vermeulen, J. F. Stoddart, F. You, J. T. Hupp, O. K. Farha and R. Q. Snurr, Sci. Adv., 2016, 2, e1600909 CrossRef PubMed.
Footnote |
| † Electronic supplementary information (ESI) available. See DOI: 10.1039/d0ce00299b |
| This journal is © The Royal Society of Chemistry 2020 |