 Open Access Article
SnS/N-Doped carbon composites with enhanced Li+ storage and lifetime by controlled hierarchical submicron- and nano-structuring†
Xi
Chen
,
Elena
Tervoort
,
Haijian
Huang
 ,
Tian
Liu
and
Markus
Niederberger
 *
*
Laboratory for Multifunctional Materials, Department of Materials, ETH Zurich, Vladimir-Prelog-Weg 5, 8093 Zurich, Switzerland. E-mail: markus.niederberger@mat.ethz.ch
First published on 31st October 2019
Abstract
Hollow and dense SnS sub-microspheres constructed from self-assembled nanosheets wrapped in a nitrogen-doped carbon shell were prepared by a low-cost, facile solvothermal process followed by annealing. The lithium-ion storage capacities of the hollow and dense spheres were tested and compared as anodes in lithium-ion battery half cells. The hollow microspheres showed low internal charge transfer resistance, good buffering of volume changes during lithiation and delithiation and good rate and cycling performance. After 1000 cycles, the hollow SnS composite still delivered a capacity of 420 mA h g−1 at 1.0 A g−1, which is 2.5 times higher than that of the dense spheres. The capacity retention from the second cycle on was 84% and 75%, respectively. The superior lithium storage performance of the hollow particles arise from their pronounced porosity, hierarchical architecture from the self-assembled nanosheets and well-controlled uniform carbon shells.
1. Introduction
Rechargeable lithium-ion batteries (LIBs), which have high energy densities and acceptable safety features, are the most widely used energy-storage devices since their successful commercialization in the 1990s. Intensive research has been performed to identify potential materials to replace conventional graphite anodes to improve the energy density and cycling stability.1–4 Among various candidates, tin-based compounds have attracted attention, because of their low cost, high theoretical capacity and high abundance.5–8 SnS, which has a high theoretical capacity (752 mA h g−1), is a promising candidate and thus has attracted considerable research interest.9,10 Its unique two-dimensional (2D) crystal structure, in which graphene-like atomic layers are held together by van der Waals forces enables convenient intercalation and deintercalation of Li+.11–15 However, the overall low conductivity and massive volume change of bulk SnS upon Li+ intercalation/deintercalation limit its reaction kinetics and make it difficult to retain the integrity of the composite electrode and the electrical contact between particles and the conductive matrix.Two strategies are often used either separately or in combination to tackle the issues mentioned above: nanostructuring and compositing with conductive materials. Nanostructuring has involved the design of 1D nanobelts,16 nanorods,17,18 2D nanosheets,19–24 nanoflakes,25 and 3D nanoflowers.26,27 Among the various architectural designs, hollow structures are particularly advantageous, because they shorten the Li+ and electron diffusion paths, increase the amount of electrochemically active sites by creating more electrode/electrolyte interfaces, and can better accommodate the strain induced by volume changes during cycling. However, complicated and expensive processes such as laser ablation and sacrificial templating are usually required to fabricate hollow structures.28–30 Formation of composites of SnS with conductive materials such as carbon nanotubes,31 graphene,15,32–35 and conductive polymers36,37 is an effective method for improving the conductivity. However, these conductive materials are often expensive.
Here, we report a facile and low-cost process for fabricating hierarchical hollow submicrospheres assembled from SnS nanosheets of four to six atomic layers, and protected with a uniform layer of nitrogen-doped carbon. The nanoscale thickness of the sheets ensures short Li+ and electron diffusion paths. The hollow interior enables relaxation of the volume expansion toward either the exterior or interior and this flexibility helps to maintain the structural integrity. Dense SnS spheres with the same composition and a similar morphology were also prepared for comparison to prove the morphological advantages of the hollow spheres. The electrochemical performance of the hollow SnS/nitrogen-doped carbon composite was better than that of the dense spheres in terms of specific capacity, cycling stability, and rate capability.
2. Experiments
2.1 Synthesis of SnS2 submicrospheres
In a typical synthesis of hollow SnS2 (H-SnS2) submicrospheres, 0.1 mmol of tin(II) acetate and 40 μl of 4-methoxybenzyl mercaptan were dissolved in a mixture of 3 ml of ethylene glycol, 2 ml of oleic acid and 0.5 ml of ethanol by continuous stirring for 30 min at room temperature. The precursor solution was then sealed in a 10 ml glass vessel with a Teflon cap and heated in a CEM Hybrid microwave reactor at 200 °C for 10 min. The obtained yellowish product was repeatedly rinsed with ethanol, acetone, and pyridine by centrifugation at 4000 rpm, followed by vacuum drying at 60 °C overnight to obtain H-SnS2 submicrospheres. For the synthesis of dense SnS2 (D-SnS2), the volume ratio of the three co-solvents is adjusted to 5 ml of ethylene glycol, 0.5 ml of oleic acid and 0.5 ml of ethanol.2.2 Synthesis of SnS@NC composite
H-/D-SnS2 coated with polydopamine were first prepared. 50 mg of as-obtained H-/D-SnS2 were dispersed in 40 ml of Tris-buffer (50 mM, pH = 8.5) containing 80 mg dopamine-HCl by ultrasonication for 30 min, followed by stirring for 24 h. The greenish product was collected and rinsed with Milli-Q H2O for three times and dried overnight at 60 °C. The dark green powder was then annealed under a continuous flow of N2 gas in a tube-furnace at 700 °C for 2 h with a ramping rate of 1 °C min−1. H-/D-SnS@NC were obtained after cooling down to room temperature.2.3 Characterization
Powder X-ray diffraction was applied to study the crystal structure of the obtained materials using a PANalytical Empyrean diffractometer with a Cu Kα radiation (45 kV, 40 mA). Sample morphologies were characterized by scanning electron microscopy (SEM) on LEO 1530 Gemini and high-resolution transmission electron microscopy (HRTEM) on X-FEG FEI Talos. X-ray photoelectron spectra were measured with a Sigma 2 spectrometer (Thermo Scientific) using a polychromatic Al Kα X-ray source, where binding energy was calibrated taking C 1s = 284.8 eV. Thermogravimetric analysis (TGA) was measured on a Mettler Toledo TGA/SDTA851e instrument. N2 gas sorption measurements were performed on a Quantachrome Autosorb iQ at 77 K. Prior to the measurement, the samples were outgassed at 100 °C for at least 24 h. Brunauer–Emmett–Teller (BET) method was utilized to determine the specific surface area.2.4 Electrochemical measurements
9.5 mg of the as-synthesized samples were mixed with 2 mg of carbon black (Super-P, TIMCAL) as a conductive agent and 2 mg of polyvinylidene fluoride (PVDF, Aldrich) as a binder in 1.6 ml of 1-methyl-2-pyrrolidone (NMP, Fluka) as a solvent by ball milling. 120 μl of the obtained homogeneous slurry was transferred to a Petri dish-like Ti current collector. The surface area of the electrode is ∼1.33 cm2. After drying at 80 °C overnight under vacuum, electrodes were assembled into a Swagelok-type cell in an argon-filled glove box. Pure lithium metal (99.9%, Alfa-Aesar) was used as both reference and counter electrode, separated from the active material by a fiberglass separator soaked in the electrolyte (1 M LiPF6 in 1![[thin space (1/6-em)]](https://www.rsc.org/images/entities/char_2009.gif) :
:![[thin space (1/6-em)]](https://www.rsc.org/images/entities/char_2009.gif) 1 wt% ethylene carbonate (EC)/dimethyl carbonate (DMC), Novolyte). Galvanostatic cycling and cyclic voltammetry were performed using a Biologic BCS series instrument, while impedance spectroscopy was performed with a Biologic VMP3 at room temperature. The electrodes were cycled between 0.1 and 3.0 V vs. Li/Li+ for varying specific current rates (1 C = 1.0 A g−1).
1 wt% ethylene carbonate (EC)/dimethyl carbonate (DMC), Novolyte). Galvanostatic cycling and cyclic voltammetry were performed using a Biologic BCS series instrument, while impedance spectroscopy was performed with a Biologic VMP3 at room temperature. The electrodes were cycled between 0.1 and 3.0 V vs. Li/Li+ for varying specific current rates (1 C = 1.0 A g−1).
3. Results and discussion
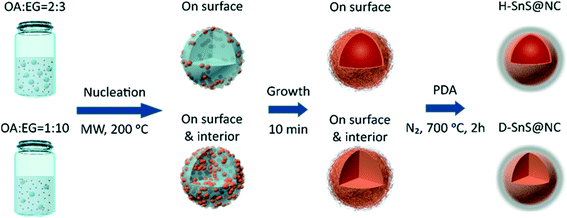
Scheme 1 shows the experimental procedure and the proposed formation mechanism for the hollow (H-SnS@NC) and dense SnS@nitrogen-doped carbon (D-SnS@NC) submicrospheres. In a first step, hollow and dense submicroparticles composed of self-assembled SnS2 nanosheets were grown by emulsion templating. Under ultrasonication, oleic acid (OA) forms droplets in ethylene glycol (EG). The number of droplets and their stability is controlled by the OA/EG volume ratio and by addition of ethanol, respectively. Due to their relatively low polarities, Sn(CH3CO2)4 and 4-methoxybenzyl mercaptan (4-MBM) both tend to dissolve in the OA droplets at room temperature. When the mixture is heated by microwave irradiation, nucleation of the tin species is promoted by the presence of EG, because 4-MBM reacts with the tin center in a ligand-exchange process and releases acetic acid, which is a polar molecule. As a result, SnS2 nuclei first form on the OA/EG interface. At a high OA/EG volume ratio (2![[thin space (1/6-em)]](https://www.rsc.org/images/entities/char_2009.gif) :
:![[thin space (1/6-em)]](https://www.rsc.org/images/entities/char_2009.gif) 3), the large amount of OA droplets provides a sufficient interfacial area to accommodate all nuclei, and therefore growth and self-assembly only take place at the interface, resulting in the formation of hollow SnS2 particles. In contrast, at a lower OA/EG volume ratio of 1
3), the large amount of OA droplets provides a sufficient interfacial area to accommodate all nuclei, and therefore growth and self-assembly only take place at the interface, resulting in the formation of hollow SnS2 particles. In contrast, at a lower OA/EG volume ratio of 1![[thin space (1/6-em)]](https://www.rsc.org/images/entities/char_2009.gif) :
:![[thin space (1/6-em)]](https://www.rsc.org/images/entities/char_2009.gif) 10, the nuclei are forced to move into the interior of the droplets, because of the insufficient interfacial area, followed by growth and assembly into dense particles.
10, the nuclei are forced to move into the interior of the droplets, because of the insufficient interfacial area, followed by growth and assembly into dense particles.
As proposed in previous literature reports, the phase transition involves the dissociation of hexagonal SnS2 in the initial stage, followed by S depletion at high temperatures:21,38,39
There are two major reasons why the polydopamine (PDA) coating should be done before the heat treatment. First, PDA can be transformed into a layer of nitrogen-doped carbon on the particle surface and enhance the overall conductivity of the electrode. But more importantly, the uniform coating of the SnS2 nanosheets prevents their melting and coalescence into bulk particles,40 preserving the unique layer structure of each nanosheet during the phase transition. Overall, the hollow and dense hierarchical structures are well retained and even strengthened during heat treatment.41,42 The heating temperature is kept at 700 °C to make sure that the formed graphitic carbon layer has sufficient conductivity. At the same time, we found that the ramping rate (1 °C min−1) has to be carefully adjusted to avoid the collapse of the hollow structure.
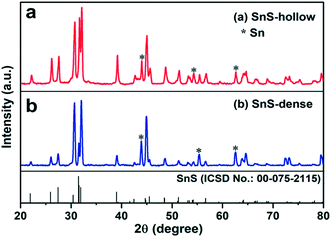
Fig. 1 and S1† show the X-ray diffraction (XRD) patterns of the intermediate SnS2 and the final H-SnS@NC and D-SnS@NC. All the diffraction peaks in Fig. S1† can be well indexed to hexagonal SnS2 (ICSD no.: 00-021-1231). The transformation of SnS2 to SnS by heat treatment at 700 °C (Fig. 1) is confirmed, because all the characteristic peaks can be indexed to the orthorhombic phase of SnS (ICSD no. 00-075-2115). Exceptions are three impurity peaks at 44.0°, 54.3°, and 62.7°, which arise from metallic Sn. The Sn impurity is the product of complete reduction of SnS by carbon.
We used thermogravimetric analysis (TGA) in air to determine the carbon content of H-SnS@NC and D-SnS@NC. The results are shown in Fig. S2.† For H-SnS@NC, the 4.6% weight loss below 350 °C is attributed to removal of adsorbed H2O. The oxidation of C to CO2 between 380 and 520 °C results in a weight loss of 48.5%. A slight weight gain was detected between 600 to 800 °C caused by the oxidation of the metallic Sn. A simple calculation showed that the composition of H-SnS@NC was SnS (46.4 wt%), C (49.7 wt%) and Sn (3.9 wt%). Analogously, the composition of D-SnS@NC was determined as SnS (34.7 wt%), C (64.2 wt%) and Sn (1.1 wt%). The 14.5 wt% higher carbon content of the dense sample leads to a slightly larger specific surface area (292 m2 g−1) compared with that of 275 m2 g−1 for H-SnS@NC (Fig. S3†).
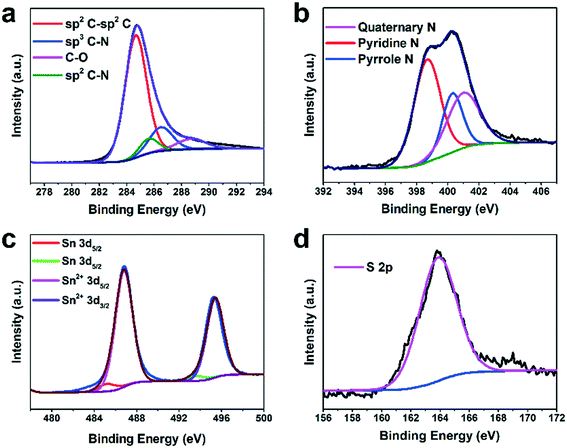
The chemical composition of H-SnS@NC was further analyzed by X-ray photoelectron spectroscopy (XPS). The XPS survey spectrum in Fig. S4† shows the presence of C, N, O, S, and Sn. Among the four fitted peaks in the C 1s spectrum in Fig. 2a, the peak at 284.7 eV has the highest intensity and shows the predominance of graphitic carbon. The two minor peaks at 285.7 and 286.5 eV indicate the presence of sp2 and sp3 bonds between carbon and nitrogen, respectively. The peak at 288.4 eV represents C–O, and its low intensity confirms the nearly complete transformation of the PDA coating. The N 1s spectrum in Fig. 2b show the presence of quaternary N (401.1 eV), pyridinic N (398.7 eV), and pyrrolic N (400.4 eV), and indicate successful nitrogen doping of the carbon shell. In the Sn 3d spectra shown in Fig. 2c the peaks at 495.2 and 486.7 eV are assigned to Sn 3d3/2 and Sn 3d5/2, respectively, of Sn2+ in SnS. Two minor peaks from Sn0 3d5/2 and Sn0 3d3/2 were detected at 485.3 eV and 493.7 eV, respectively, which supports the TGA data that the content of the metallic Sn impurity is very low. Only S 2p3/2 is observed in the S 2p spectrum (Fig. 2d), proving the presence of SnS.6,37,40,43,44
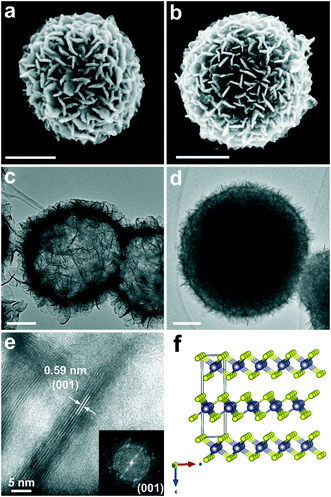
The scanning electron microscopy (SEM) images of the intermediates H-SnS2 and D-SnS2 are shown in Fig. 3a and b. The H-SnS2 sub-micron-sized particles with diameters of 400–600 nm consist of self-assembled nanosheets that are interconnected with each other on the particle surface. The SEM image of D-SnS2 does not differ significantly from that of H-SnS2, except for a slightly larger average diameter and a broader size distribution (400–800 nm). The transmission electron microscopy (TEM) image in Fig. 3c shows that the entire submicron H-SnS2 particle is hollow and consists of a shell of nanosheets. In contrast, the TEM image of D-SnS2 points to a dense structure in the interior (Fig. 3d). The high-resolution TEM (HRTEM) image and the fast Fourier transform analysis in Fig. 3e clearly show that the H-SnS2 nanosheets are arranged into stacks of six to eight layers. The total thickness is around 5 nm with an interplanar spacing of approximately 0.59 nm, which corresponds to the distance between the (001) planes of hexagonal SnS2, as shown in the side view in Fig. 3f.
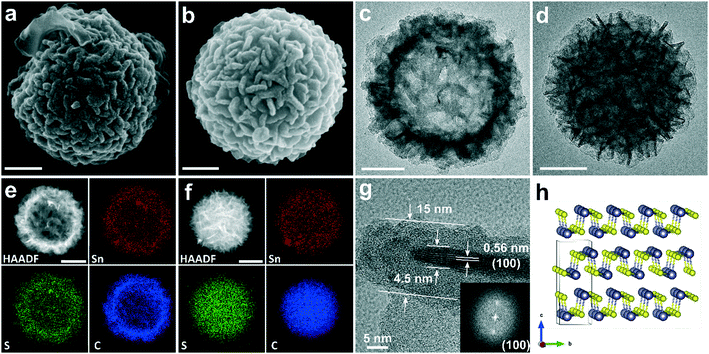
The morphologies of H-SnS@NC and D-SnS@NC obtained after heat treatment of H-SnS2 and D-SnS2 were examined by SEM and TEM (Fig. 4). The SEM image in Fig. 4a shows that the surface features of the H-SnS@NC microparticles are retained after carbon coating, but the thickness of the nanosheets is larger than in the case of H-SnS2. Overview SEM images at low magnifications of H-SnS@NC (Fig. S5a†) and D-SnS@NC (Fig. S5b†) proved the uniformity of the as-obtained particles. Brighter color contrast is still observed in the middle part of the particle in the TEM image in Fig. 4c, suggesting that the hollow structure did not collapse at high temperatures probably due to the slow temperature-ramping rate and the stabilizing effect of the carbon shell. The high-angle annular dark-field imaging HAADF and energy-dispersive X-ray spectroscopy (EDX) mapping in Fig. 4e for Sn, S, and C show a weaker signal intensity in the middle, which confirms the porous structure. The elements are uniformly distributed within the particle shell, indicating good compositional homogeneity. Fig. 4g shows an HRTEM image of a carbon-coated single nanosheet. The thickness of the SnS nanosheet is similar to that of SnS2, but the interplanar spacing is 0.56 nm, which corresponds to the (100) plane (Fig. 4h). The carbon shell has a thickness of about 5 nm. Therefore, the total thickness of the carbon-coated SnS is 15 nm, which corresponds well to the surface features observed in SEM. Such a morphology is beneficial when H-SnS@NC is used as anode material in a LIB. The electrolyte can penetrate the shell, and because of the hollow structure, the nanosheets exposed to the interior and to the exterior are all directly in contact with Li+. This results in a short Li+ diffusion path length equal to half of this thickness (around 7.5 nm), ensuring an efficient redox reaction. The SEM image of D-SnS@NC (Fig. 4b) is similar to that of H-SnS@NC (Fig. 4a), but the lack of strong contrast differences in the TEM image (Fig. 4d) points towards a dense interior. The HAADF and EDX mapping in Fig. 4f confirm this observation. To provide further experimental proof of the hollow and dense structural features respectively, we cut the particles with a focused ion beam. SEM images of the cross-sections are shown in Fig. S6a–d,† and the EDX line scans of the element profiles along the particle diameter are shown in Fig. S6e–h.† The hole in the cross-sections and downward line scan profile curves for H-SnS2 and H-SnS@NC clearly confirm the hollow structure.
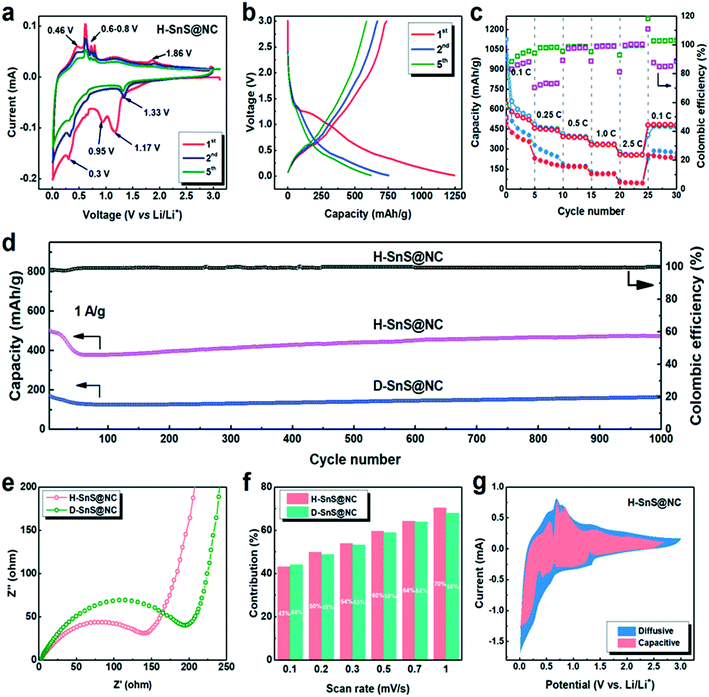
The Li+ storage properties of anodes fabricated from H-SnS@NC and D-SnS@NC composites were investigated in a two-electrode cell with Li metal as the counter electrode (Fig. 5). First, cyclic voltammetry (CV) between 0.01 and 3 V was performed to gain an understanding of the lithiation and delithiation process in the H-SnS@NC electrodes. The results are shown in Fig. 5a. In the first cathodic scan, a peak was observed at 1.17 V. This peak was not observed in subsequent cycles and it corresponds to the formation of LixSnS from the reaction of SnS with Li (eqn (1)), which is then reduced to metallic tin at 0.95 V (eqn (2)). The weak peak at around 0.7 V is attributed to an alloying reaction that forms LixSn (x ranges from 0.57 to 1, eqn (3)), followed by the formation of the completely alloyed product Li4.4Sn, indicated by the peak at 0.3 V (eqn (4)). In the following anodic scan, the peak at 0.46 V and several sharp peaks between 0.6–0.8 V point to the de-alloying process of Li4.4Sn that forms Sn particles (eqn (5)). A minor peak is detected at around 1.86 V, indicating that Sn particles are oxidized to SnS by reacting with the Li2S matrix (eqn (6)).
| SnS + xLi+ + xe− → LixSnS | (1) |
| LixSnS + (2 − x)Li+ + (2 − x)e− → Li2S + Sn | (2) |
| Sn + xLi+ + xe− → LixSn(0.57 < x < 1.0) | (3) |
| Sn + xLi+ + xe− → LixSn(1.0 < x < 4.4) | (4) |
| Li4.4S → 4.4Li+ + Sn | (5) |
| Li2S + Sn → SnS + 2Li+ + 2e− | (6) |
From the second cycle on a cathodic peak appeared at 1.33 V, assigned to the reduction of SnS and the formation of Sn and Li2S. It is suggested that the Sn particles formed in the previous cathodic cycle (eqn (2)) catalyze the reaction, and this leads to a higher reaction voltage. The intensities of the cathodic peaks at 0.7 and 0.3 V, and all the anodic peaks in the second cycle, were lower than the corresponding peaks in the first cycle due to solid electrolyte interface (SEI) formation. The position of the anodic peak at 1.86 V remained the same, which confirmed that the conversion and alloying reactions are reversible. The CV curve of D-SnS@NC in Fig. S7a† shows a similar voltage profile, but a larger capacity loss, indicating higher polarization, because of a longer Li+ diffusion pathway as a result of the dense structure.
Charge/discharge tests were performed for H-SnS@NC electrodes in the voltage range 0.01–3.0 V at 0.1 C (1 C = 1000 mA g−1). The results are shown in Fig. 5b. The initial discharge and charge capacities were 1250 and 750 mA h g−1, corresponding to an initial coulombic efficiency of 60%. The capacity loss is mainly attributed to the formation of the SEI. In the fifth cycle, a reversible capacity of 550 mA h g−1 was obtained. The galvanostatic discharge–charge curves for D-SnS@NC electrodes are plotted in Fig. S7b.† The discharge capacity decreases from 1004 mA h g−1 (1st cycle) to 507 mA h g−1 (2nd cycle) and to 402 mA h g−1 (5th cycle). These values are much lower than in the case of the H-SnS@NC electrode, presumably due to the difficulties of the Li+ and the electrolyte to reach the core of the particle, and thus to involve the internal part of the particles in the electrochemical process. The rate performances of H-SnS@NC and D-SnS@NC were compared in Fig. 5c to show the merit of the hollow structure in kinetic terms. For the H-SnS@NC electrode, the specific capacities were 530, 450, 380, 320, and 290 mA h g−1 at 0.1, 0.25, 0.5, 1.0, and 2.5 C, respectively, and these values are much higher than those for D-SnS@NC. After high rate cycling, the battery was cycled again at 0.1 C and a capacity of 530 mA h g−1 was recovered. D-SnS@NC delivered a much lower capacity at the same rates. At 2.5 C a capacity of only 25 mA h g−1 was achieved, which corresponds to 15% of the value for H-SnS@NC at the same rate. The coulombic efficiency (the ratio between the discharge and the charge capacity in the same cycle) of H-SnS@NC reached almost 100% already after the first 5 cycles at 0.1 C and remained stable in the following cycles, whereas D-SnS@NC showed a significantly lower efficiency at 0.1 C and 0.25 C. The hollow interior improves the rate performance by reducing the lengths of the electron and Li+ diffusion pathways. More importantly, much higher cycling stability was observed for the H-SnS@NC electrode, when both electrodes were cycled at 1 C for 1000 cycles (Fig. 5d). For H-SnS@NC, a rapid capacity drop from 500 to 370 mA h g−1 occurred in the first 50 cycles. This might be due to the slow diffusion of the electrolyte into the hollow interior during this period, which leads to continuous formation of an SEI in the particle interior. However, the electrode soon stabilized once the SEI completely covered all the electrochemically active sites on the exterior and on the interior surfaces of the particles, and a stable pathway for the electrolyte was created. In the next 600 cycles, we observed a slow and slight increase in the capacity to around 420 mA h g−1. This reversible capacity was retained for up to 1000 cycles with a coulombic efficiency of nearly 100%. The cycling stability of the D-SnS@NC electrode was equally good, however, with a specific capacity of only 170 mA h g−1 after 1000 cycles, almost 2.5 times smaller than that for the H-SnS@NC electrode. This observation confirms the positive effect of the hollow structure regarding volume-change buffering and charge-transfer enhancement.
To gain a better understanding of the electrochemical behavior of the H-SnS@NC and D-SnS@NC composites, electrochemical impedance spectroscopy (EIS) was performed in the frequency range 10 Hz to 100 kHz. The semi-circles in the medium-frequency range in the Nyquist plots in Fig. 5e can be used to describe the charge transfer resistance between the electrolyte and the active materials. The smaller circle radius of the H-SnS@NC particles shows an enhanced charge-transfer performance because the electrolyte contact with the hollow sphere from both outer and interior side provides larger interfacial area. In the low-frequency range, the steep straight lines for both samples indicate a high diffusion rate of Li+ within the electrode material.35,45–48 As a result, the beneficial kinetics that arise from the unique hollow structure explain the better cycling and rate performances of the hollow sample.
Finally, we investigated the pseudocapacitive contribution of the H-SnS@NC and D-SnS@NC electrodes to further explain the highly stable cycling performance. We quantitatively determined the capacitive contribution to the CV plots at different scan rates (from 0.2 to 10 mV), as described by Dunn et al.:49,50
| i(V) = k1v + k2v1/2 |
At a specific voltage (V), the current (i) is a combination of two terms: (k1v) from the contribution of the capacitive behavior and (k2v1/2) from the diffusion-controlled process, which varies with the scan rate. Fig. 5f shows that the capacitive contributions are similar for the two samples at different scan rates, both reach about 70% at 10 mV s−1. This value is higher than that for a typical conversion mechanism but lower than that for typical pseudocapacitive materials.25 This result suggests that we developed an architecture, which offers both a high reversibility of the conversion reaction, giving a high capacity, and partial capacitive behavior, leading to good cycling stability. Fig. 5g shows a comparison of the voltage profiles of the capacitive contributions at 1 mV s−1 with the entire CV plots. Despite the dominating occupation of the area, there are still negative peaks at the voltage at which the redox reactions take place. Accordingly, the materials show a balanced and beneficial combination of capacitive and diffusive behavior.
4. Conclusion
In summary, hollow and dense SnS hierarchical submicroparticles with nitrogen-doped carbon shells were prepared via a facile and cheap solvothermal synthesis route followed by heat treatment. Compared with the dense spheres, the particles with hollow interiors gave superior electrochemical performances with excellent specific capacity, cycling stability, and rate capability as a direct result of the unique hollow architecture composed of self-assembled nanosheets and uniform carbon shells. These advantages make H-SnS@NC a promising candidate as anode material for advanced LIBs.Author contributions
The manuscript was written through contributions of all authors. All authors have given approval to the final version of the manuscript.Conflicts of interest
There are no conflicts to declare.Acknowledgements
The authors acknowledge ETH Zurich (ETH Research Grant ETH-13 16-1) for financial support. We thank the Scientific Center for Optical and Electron Microscopy (Scope M) of ETH Zurich for providing the TEM facilities. We thank G. Cossu and Prof. A. Rossi for providing the XPS equipment. Haijian Huang and Tian Liu acknowledge China Scholarship Council for financial support.References
- N. S. Choi, Z. Chen, S. A. Freunberger, X. Ji, Y. K. Sun, K. Amine, G. Yushin, L. F. Nazar, J. Cho and P. G. Bruce, Angew. Chem., Int. Ed., 2012, 51, 9994–10024 CrossRef CAS PubMed.
- B. Kang and G. Ceder, Nature, 2009, 458, 190–193 CrossRef CAS PubMed.
- L. Ji, Z. Lin, M. Alcoutlabi and X. Zhang, Energy Environ. Sci., 2011, 4, 2682–2699 RSC.
- J. B. Goodenough and K.-S. Park, J. Am. Chem. Soc., 2013, 135, 1167–1176 CrossRef CAS PubMed.
- Q. Wu, L. Jiao, J. Du, J. Yang, L. Guo, Y. Liu, Y. Wang and H. Yuan, J. Power Sources, 2013, 239, 89–93 CrossRef CAS.
- J. Shan, Y. Liu, P. Liu, Y. Huang, Y. Su, D. Wu and X. Feng, J. Mater. Chem. A, 2015, 3, 24148–24154 RSC.
- J. w. Seo, J. t. Jang, S. w. Park, C. Kim, B. Park and J. Cheon, Adv. Mater., 2008, 20, 4269–4273 CrossRef CAS.
- Q. Lian, G. Zhou, X. Zeng, C. Wu, Y. Wei, C. Cui, W. Wei, L. Chen and C. Li, ACS Appl. Mater. Interfaces, 2016, 8, 30256–30263 CrossRef CAS PubMed.
- M. M. Nassary, J. Alloys Compd., 2005, 398, 21–25 CrossRef CAS.
- S. S. Hegde, A. G. Kunjomana, K. A. Chandrasekharan, K. Ramesh and M. Prashantha, Phys. B, 2011, 406, 1143–1148 CrossRef CAS.
- W. Kang, Y. Wang and J. Xu, J. Mater. Chem. A, 2017, 5, 7667–7690 RSC.
- Y. Liu, Y. Li, H. Kang, T. Jin and L. Jiao, Mater. Horiz., 2016, 3, 402–421 RSC.
- X.-L. Gou, J. Chen and P.-W. Shen, Mater. Chem. Phys., 2005, 93, 557–566 CrossRef CAS.
- Y. Li, J. P. Tu, X. H. Huang, H. M. Wu and Y. F. Yuan, Electrochim. Acta, 2006, 52, 1383–1389 CrossRef CAS.
- S.-C. Zhu, H.-C. Tao, X.-L. Yang, L.-L. Zhang and S.-B. Ni, Ionics, 2015, 21, 2735–2742 CrossRef CAS.
- J. Lu, C. Nan, L. Li, Q. Peng and Y. Li, Nano Res., 2013, 6, 55–64 CrossRef CAS.
- A. M. Tripathi and S. Mitra, RSC Adv., 2013, 4, 10358–10366 RSC.
- P. He, Y. Fang, X. Y. Yu and X. Lou, Angew. Chem., Int. Ed., 2017, 56, 12202–12205 CrossRef CAS PubMed.
- T.-J. Kim, C. Kim, D. Son, M. Choi and B. Park, J. Power Sources, 2007, 167, 529–535 CrossRef CAS.
- J.-G. Kang, J.-G. Park and D.-W. Kim, Electrochem. Commun., 2010, 12, 307–310 CrossRef CAS.
- T. Zhou, W. Pang, C. Zhang, J. Yang, Z. Chen, H. Liu and Z. Guo, ACS Nano, 2014, 8, 8323–8333 CrossRef CAS PubMed.
- X. Xie, M. Mao, S. Qi and J. Ma, CrystEngComm, 2019, 21, 3755–3769 RSC.
- L. Wang, X. Xie, K. N. Dinh, Q. Yan and J. Ma, Coord. Chem. Rev., 2019, 397, 138–167 CrossRef CAS.
- D. Wu, C. Wang, M. Wu, Y. Chao, P. He and J. Ma, J. Energy Chem., 2020, 43, 24–32 CrossRef.
- J. Sheng, L. Yang, Y.-E. Zhu, F. Li, Y. Zhang and Z. Zhou, J. Mater. Chem. A, 2017, 5, 19745–19751 RSC.
- S. Li, J. Zheng, Z. Hu, S. Zuo, Z. Wu, P. Yan and F. Pan, RSC Adv., 2015, 5, 72857–72862 RSC.
- D. D. Vaughn, O. D. Hentz, S. Chen, D. Wang and R. E. Schaak, Chem. Commun., 2012, 48, 5608–5610 RSC.
- X. Lou, L. A. Archer and Z. Yang, Adv. Mater., 2008, 20, 3987–4019 CrossRef CAS.
- M.-Y. Sun, J. Yang, T. Lin and X.-W. Du, RSC Adv., 2012, 2, 7824–7828 RSC.
- X. Y. Yu, L. Yu and X. Lou, Adv. Energy Mater., 2016, 6, 1501333 CrossRef.
- Y. Chen, B. Wang, T. Hou, X. Hu, X. Li, X. Sun, S. Cai, H. Ji and C. Zheng, Chin. Chem. Lett., 2018, 29, 187–190 CrossRef CAS.
- M. Zhang, D. Lei, X. Yu, L. Chen, Q. Li, Y. Wang, T. Wang and G. Cao, J. Mater. Chem., 2012, 22, 23091–23097 RSC.
- H.-C. Tao, X.-L. Yang, L.-L. Zhang and S.-B. Ni, J. Electroanal. Chem., 2014, 728, 134–139 CrossRef CAS.
- C. Zhu, P. Kopold, W. Li, P. A. van Aken, J. Maier and Y. Yu, Adv. Sci., 2015, 2, 1500200 CrossRef PubMed.
- B. Zhao, Z. Wang, F. Chen, Y. Yang, Y. Gao, L. Chen, Z. Jiao, L. Cheng and Y. Jiang, ACS Appl. Mater. Interfaces, 2017, 9, 1407–1415 CrossRef CAS PubMed.
- G. Wang, J. Peng, L. Zhang, J. Zhang, B. Dai, M. Zhu, L. Xia and F. Yu, J. Mater. Chem. A, 2014, 3, 3659–3666 RSC.
- J. Liu, M. Gu, L. Ouyang, H. Wang, L. Yang and M. Zhu, ACS Appl. Mater. Interfaces, 2016, 8, 8502–8510 CrossRef CAS PubMed.
- N. Mahmood, C. Zhang and Y. Hou, Small, 2013, 9, 1321–1328 CrossRef CAS PubMed.
- H. Wiedemeier and G. Pultz, Z. Anorg. Allg. Chem., 1983, 499, 130–144 CrossRef CAS.
- D. Youn, S. K. Stauffer, P. Xiao, H. Park, Y. Nam, A. D. Dolocan, G. Henkelman, A. Heller and C. Mullins, ACS Nano, 2016, 10, 10778–10788 CrossRef CAS PubMed.
- C. Lei, F. Han, D. Li, W.-C. Li, Q. Sun, X.-Q. Zhang and A.-H. Lu, Nanoscale, 2012, 5, 1168–1175 RSC.
- Z. Cai, L. Xu, M. Yan, C. Han, L. He, K. M. Hercule, C. Niu, Z. Yuan, W. Xu, L. Qu, K. Zhao and L. Mai, Nano Lett., 2015, 15, 738–744 CrossRef CAS PubMed.
- I.-T. Cho, U. Myeonghun, S.-H. Song, J.-H. Lee and H.-I. Kwon, Semicond. Sci. Technol., 2014, 29, 45001 CrossRef.
- S. Hofmann, Surf. Interface Anal., 1986, 9, 3–20 CrossRef CAS.
- R. Ruffo, R. Fathi, D. Kim, Y. Jung, C. M. Mari and D. Kim, Electrochim. Acta, 2013, 108, 575–582 CrossRef CAS.
- Y. Zhu, Y. Xu, Y. Liu, C. Luo and C. Wang, Nanoscale, 2012, 5, 780–787 RSC.
- S. H. Choi and Y. C. Kang, ACS Appl. Mater. Interfaces, 2015, 7, 24694–24702 CrossRef CAS PubMed.
- S. Choi and Y. Kang, ChemSusChem, 2013, 6, 2111–2116 CrossRef CAS PubMed.
- V. Augustyn, P. Simon and B. Dunn, Energy Environ. Sci., 2014, 7, 1597–1614 RSC.
- T. Brezesinski, J. Wang, S. H. Tolbert and B. Dunn, Nat. Mater., 2010, 9, 146 CrossRef CAS PubMed.
Footnote |
| † Electronic supplementary information (ESI) available: Powder X-ray diffraction patterns of intermediate H- and D-SnS2; thermogravimetric analysis curve of H- and D-SnS@NC; nitrogen adsorption and desorption isotherms of H- and D-SnS2, H- and D-SnS@NC; X-ray photoelectron survey spectrum of H-SnS@NC; low-magnification scanning electron microscopy images of H- and D-SnS@NC; scanning electron microscopy images of focused-ion-beam cut cross-sections and energy-dispersive X-ray spectroscopy element profile line scans of H- and D-SnS2, H- and D-SnS@NC; cyclic voltammetry and galvanostatic cycling of D-SnS@NC; cycling performance of H-SnS@NC annealed at 450 °C and 600 °C; scanning electron microscopy images of H-SnS@NC annealed at 850 °C or annealed with a heating rate of 5 °C; powder X-ray diffraction patterns of H-SnS@NC annealed in Ar or N2; scanning electron microscopy images of H- and D-SnS@NC after cycling. See DOI: 10.1039/c9ce01147a |
| This journal is © The Royal Society of Chemistry 2020 |

