
 Open Access Article
 This Open Access Article is licensed under a
 Creative Commons Attribution 3.0 Unported Licence
Correction: Facile preparation of phospholipid–amorphous calcium carbonate hybrid nanoparticles: toward controllable burst drug release and enhanced tumor penetration
Cheng
Wang
a,
Xuerong
Liu
a,
Shaoqing
Chen
a,
Fuqiang
Hu
a,
Jihong
Sun
*b and
Hong
Yuan
*a
aCollege of Pharmaceutical Sciences, Zhejiang University, 866 Yuhangtang Road, Hangzhou, 310058, China. E-mail: yuanhong70@zju.edu.cn
bSir Run Run Shaw Hospital, School of Medicine, Zhejiang University, No. 3 Qingchun East Road, Hangzhou, 310016, China. E-mail: braversun@sina.com
First published on 7th September 2020
Abstract
Correction for ‘Facile preparation of phospholipid–amorphous calcium carbonate hybrid nanoparticles: toward controllable burst drug release and enhanced tumor penetration’ by Cheng Wang et al., Chem. Commun., 2018, 54, 13080–13083, DOI: 10.1039/C8CC07694D.
The authors regret that some incorrect images were included in the original article. Fig. S2, S9C and S13 in the ESI were incorrect due to errors in image processing. These images have been replaced with the correct data and an updated version of the ESI has now been uploaded. Fig. 3 and 4 in the main article were also affected, and these corrected figures are presented here. This does not affect the results or conclusions of the article.
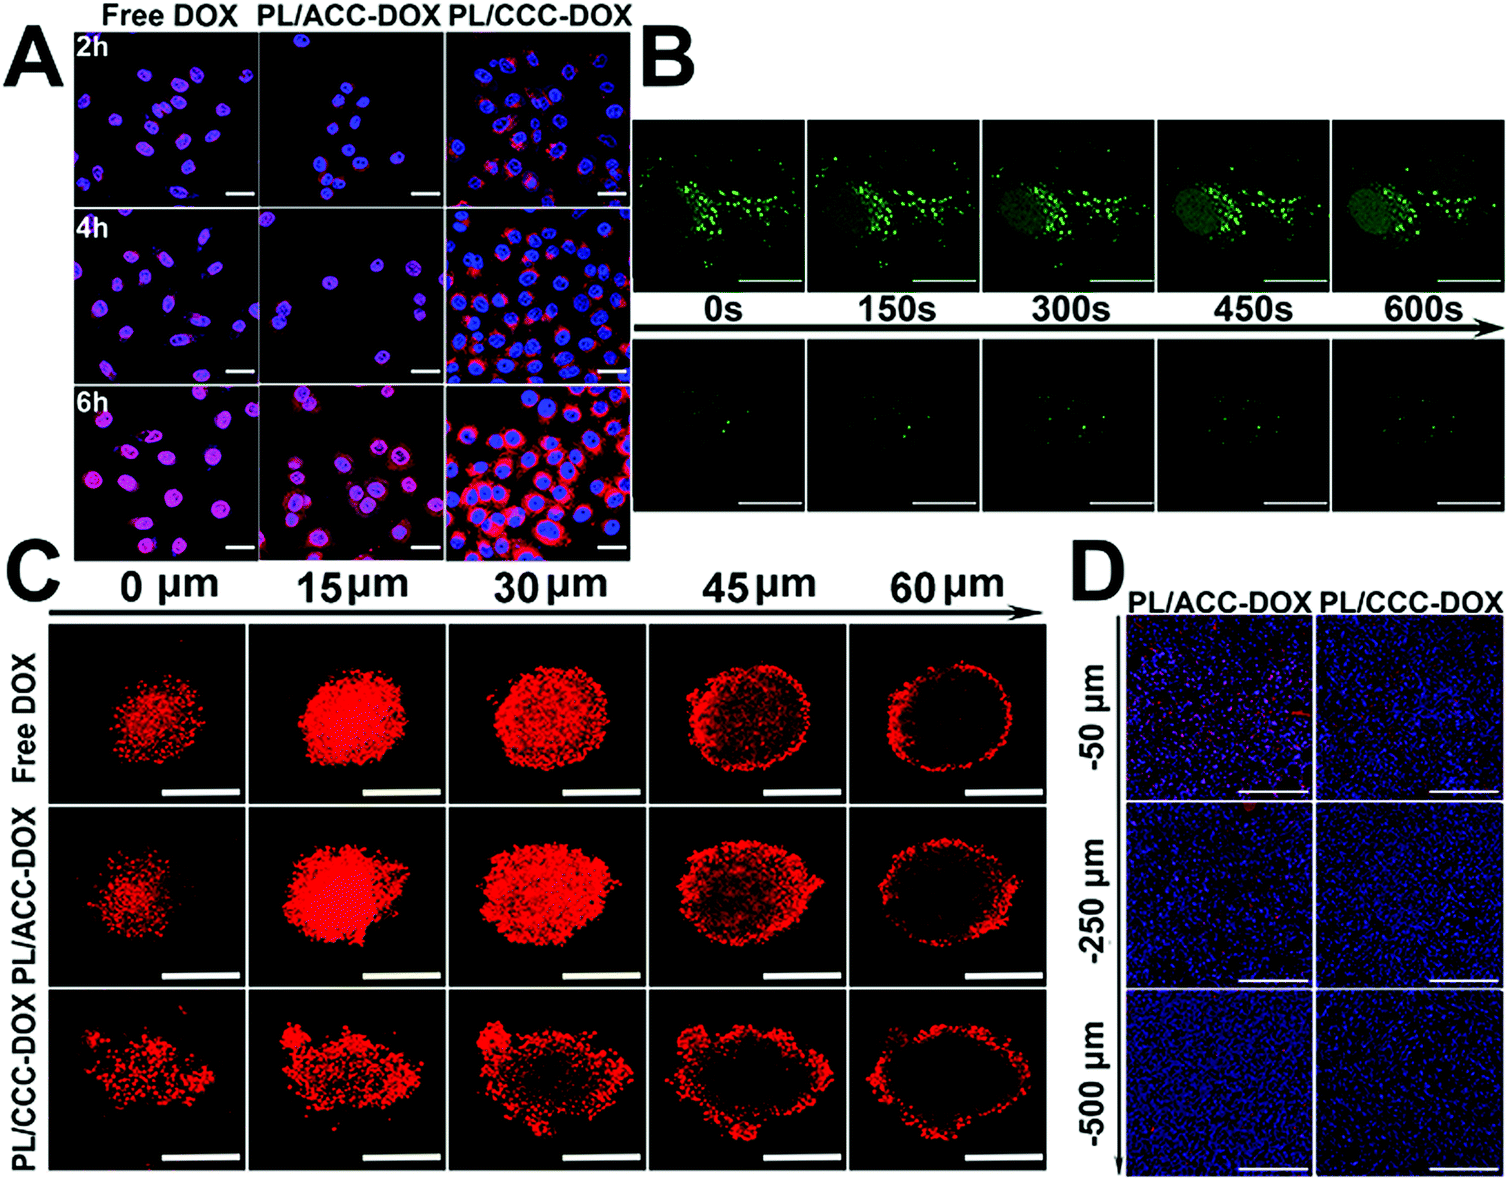 | ||
| Fig. 3 Intracellular drug localization, drug release and enhanced drug penetration of PL/ACC–DOX. (A) Time dependent intracellular drug localization of different formulations in HeLa cells. For each panel, blue: Hoechst 33342 stained nuclei; red: DOX. Scale bar: 20 μm. (B) Time-dependent variation of intracellular Ca2+ concentration in HeLa cells treated with PL/ACC–DOX (upper) and PL/CCC–DOX (lower). Scale bar: 20 μm. (C) In vitro penetration of DOX into the MCTS after incubation with different formulations for 24 h. Scale bar: 200 μm. (D) The sliced tumor tissues at different depths below the superficial layer were recorded. The nuclei were stained with DAPI (blue). Scale bar: 200 μm. | ||
 | ||
| Fig. 4 In vitro cytotoxicity and in vivo antitumor assays of PL/ACC–DOX. (A) Cell viabilities of HeLa cells incubated with different formulations at different DOX concentrations for 24 and 48 h. Results are presented as mean ± S.D. (n = 3). (B) The diameter changes of MCTS after treatment with different formulations for 5 days (n = 3). The tumor volume (C) and survival rate (D) analyses of HeLa tumor-bearing BALB/c nude mice after intravenous administration of different formulations. The measurement of tumor volumes was repeated every 2 days for two weeks. Dose: 2 mg DOX/kg (n = 6). (E) Representative images (200×) of ex vivo tumor sections assayed by HE staining and immunohistology using TUNEL and Ki67 antibodies. **P < 0.01, PL/ACC–DOX versus PL/CCC–DOX. | ||
The Royal Society of Chemistry apologises for these errors and any consequent inconvenience to authors and readers.
| This journal is © The Royal Society of Chemistry 2020 |