 Open Access Article
Heparin sensing based on multisite-binding induced highly ordered perylene nanoaggregates†
Gyan H.
Aryal‡
a,
Ganesh R.
Rana‡
a,
Fei
Guo
b,
Kenneth W.
Hunter
a and
Liming
Huang
 *a
*a
aDepartment of Microbiology and Immunology, School of Medicine, University of Nevada, Reno, NV 89557, USA. E-mail: huang@med.unr.edu
bDepartment of Molecular and Cellular Biology, University of California, Davis, Davis, CA 95616-8665, USA
First published on 2nd October 2020
Abstract
Highly ordered perylene nanoaggregates with ultra-low fluorescence were employed for the selective and sensitive fluorescence sensing of heparin. A supramolecular host–guest complex was used as a displacement probe to improve the sensitivity.
The design of new chemical and biological sensors for biologically important molecules has received enormous attention in recent years.1 Heparin is known as the foremost clinical anticoagulant and a life-saving drug with more than 500 million doses prescribed worldwide annually.2 Heparin is a heterogeneous mixture of highly negatively charged linear biopolymers with repeating trisulfated disaccharide units and has an average molecular weight of 13
![[thin space (1/6-em)]](https://www.rsc.org/images/entities/char_2009.gif) 000 to 15
000 to 15![[thin space (1/6-em)]](https://www.rsc.org/images/entities/char_2009.gif) 000 Daltons.3 It is critical to maintain therapeutic levels of heparin to prevent thrombosis, while minimizing the risks of bleeding. The most widely used laboratory assay for monitoring heparin is activated partial thromboplastin time (aPTT) or activated clotting time assay (aCTA).4 However, these methods are inaccurate, expensive, and time-consuming. Thus, simple, rapid, and inexpensive methods for monitoring heparin levels are highly desired.
000 Daltons.3 It is critical to maintain therapeutic levels of heparin to prevent thrombosis, while minimizing the risks of bleeding. The most widely used laboratory assay for monitoring heparin is activated partial thromboplastin time (aPTT) or activated clotting time assay (aCTA).4 However, these methods are inaccurate, expensive, and time-consuming. Thus, simple, rapid, and inexpensive methods for monitoring heparin levels are highly desired.
Fluorescent displacement probes based on host–guest complexes of macrocycles (e.g. cyclodextrins, calixarenes, and cucurbit[n]urils (CB[n])) and fluorescent dyes have recently attracted attention due to their notable advantages.5 For instance, these probes utilize self-assembly of host and guest molecules through multiple non-covalent interactions without complicated and expensive covalent labeling procedures. In addition, the fluorescence signal from these probes is reversible in response to certain target molecules, allowing them to sense many biologically and environmentally important analytes.6 The sensitivity of fluorescent displacement probes is highly dependent on the binding affinity of the complexes as well as the fluorescence changes in response to a target. Different strategies have been applied in designing new fluorescent displacement probes for the sensitive detection of different targets of interest, including structural modifications of guest molecules to enhance their binding affinities.7 In this work, a new perylene derivative PDI1 containing two rigid and cationic pyridinium side chains (Fig. 1) was prepared. Based on our previous work,7 we felt that the formation of strong host–guest CB[8]:PDI1 complexes would enhance the initial fluorescence of the probe (up to 600% increase), resulting in improved sensitivity. It was hypothesized that the multisite-binding of heparin (HEP) with PDI1via strong electrostatic and π–π interactions would lead to highly ordered HEP:PDI1 nano-aggregates, resulting in significant self-quenching of fluorescence. Herein we demonstrate that the CB[8]:PDI1 complex can serve as a fluorescent displacement probe for the highly sensitive detection of HEP through the competitive multisite-binding of HEP to PDI1 over CB[8]. A detection limit of 2.4 ng mL−1 (∼0.13 nM) for HEP was achieved, which is comparable to that of most reported methods.8
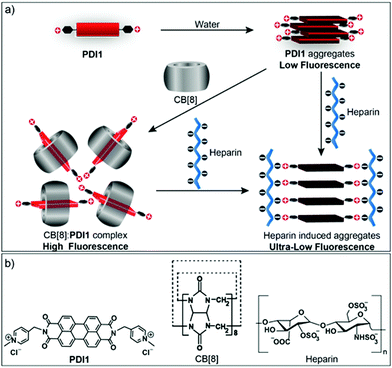 | ||
| Fig. 1 (a) Schematic illustration of the formation of host–guest CB[8]:PDI1 complex and heparin induced highly ordered aggregates. (b) The chemical structures of PDI1, CB[8], and heparin. | ||
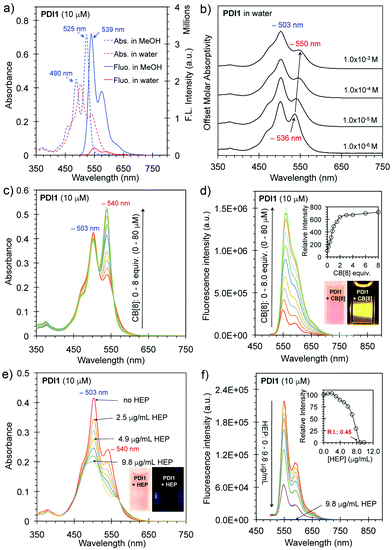
PDI1 was prepared in three reaction steps (imidization, quaternization, and anion exchange) from a perylene dianhydride (Scheme S1, ESI†). The detailed synthetic procedure and characterization are provided in the ESI.†PDI1 is very soluble in common polar solvents (e.g. water, MeOH, CH3CN, and DMSO) due to its hydrophilic pyridinium side-chains with permanent positive charges. In methanol, PDI1 (10 μM) exhibits two absorption peaks with λmax at ∼490 and ∼525 nm and emits strongly in the range of 500–600 nm with a λmax at ∼539 nm, indicating the presence of non-aggregated monomers of PDI1 in methanol (Fig. 1a).9 In comparison, PDI1 (10 μM) in water shows a different absorption spectrum with λmax at ∼503 nm and a shoulder peak at 540 nm, and a low fluorescence emission with λmax at ∼550 nm, owing to the self-quenching of H-aggregates in water.10 The quantum yield of PDI1 (10 μM) in water was calculated to be only 4.3% without considering reabsorption at high concentrations. The absorption of PDI1 in different concentrations in water indicates that the ratio of the absorption at ∼503 nm and ∼540 increases as the concentration increases from 1 × 10⁻⁶ M to 1.0 × 10⁻³ M (Fig. 2b), suggesting an increased H-aggregation at a higher concentration.11
The host–guest complexation between CB[8] and PDI1 was investigated in detail using UV-vis and fluorescence spectroscopy. As shown in Fig. 2c, the addition of CB[8] to PDI1 (10 μM) caused a gradual increase in the absorption at 540 nm with increased A540/A503 ratios. The fluorescence intensity of PDI1 at λmax increased gradually as the concentration of CB[8] increased and a maximum enhancement (∼600% increase) was reached with 3.0 equivalents of CB[8], suggesting efficient deaggregation of PDI1 aggregates upon encapsulation with CB[8] through hydrophobic and electrostatic interactions (Fig. 2d).9 The Job plot indicates a maximum at a molar fraction of the guest equal to 0.5, indicating the formation of a 1![[thin space (1/6-em)]](https://www.rsc.org/images/entities/char_2009.gif) :
:![[thin space (1/6-em)]](https://www.rsc.org/images/entities/char_2009.gif) 1 host–guest complex for PDI1 with CB8 (Fig. S1, ESI†). The formation of CB[8]
1 host–guest complex for PDI1 with CB8 (Fig. S1, ESI†). The formation of CB[8]![[thin space (1/6-em)]](https://www.rsc.org/images/entities/char_2009.gif) :
:![[thin space (1/6-em)]](https://www.rsc.org/images/entities/char_2009.gif) PDI1 1
PDI1 1![[thin space (1/6-em)]](https://www.rsc.org/images/entities/char_2009.gif) :
:![[thin space (1/6-em)]](https://www.rsc.org/images/entities/char_2009.gif) 1 complex was further confirmed using mass spectroscopy ([CB[8]
1 complex was further confirmed using mass spectroscopy ([CB[8]![[thin space (1/6-em)]](https://www.rsc.org/images/entities/char_2009.gif) :
:![[thin space (1/6-em)]](https://www.rsc.org/images/entities/char_2009.gif) PDI1 + 3H]: observed mass 1936.84 Da, calculated mass 1936.29 Da, Fig. S2, ESI†). The binding affinity (Ka) of the CB[8]:PDI1 complex in water as determined using fluorescence titration was calculated to be ∼2.6 × 10⁵ M−1 using a 1
PDI1 + 3H]: observed mass 1936.84 Da, calculated mass 1936.29 Da, Fig. S2, ESI†). The binding affinity (Ka) of the CB[8]:PDI1 complex in water as determined using fluorescence titration was calculated to be ∼2.6 × 10⁵ M−1 using a 1![[thin space (1/6-em)]](https://www.rsc.org/images/entities/char_2009.gif) :
:![[thin space (1/6-em)]](https://www.rsc.org/images/entities/char_2009.gif) 1 binding model with the Origin program (Fig. S3, ESI†).12 It is about 2.6 times the binding affinity of a previously reported CB[8]:PDI complex, probably because of the pyridium effect.9
1 binding model with the Origin program (Fig. S3, ESI†).12 It is about 2.6 times the binding affinity of a previously reported CB[8]:PDI complex, probably because of the pyridium effect.9
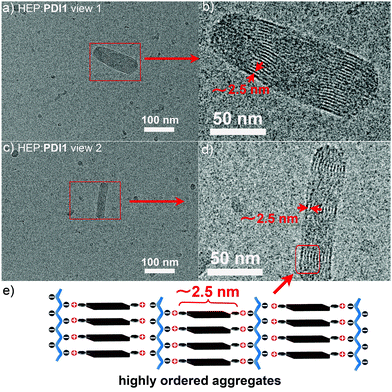
The multisite-binding of HEP with PDI1 in water was investigated using UV-vis and fluorescence spectroscopy. The size and surface properties of HEP:PDI1 aggregates were investigated using cryo-electron microscopy (cryo-EM) and dynamic light scattering (DLS). As shown in Fig. 2e, the addition of HEP to PDI1 (10 μM) caused a gradual decrease of the absorption at λmax (503 nm) and the peak at λmax decreased about 50% in the presence of 9.8 μg mL−1 (or ∼0.54 μM, ∼38 μM negative charges) of HEP.13 The fluorescence intensity of PDI1 at λmax (550 nm) decreased gradually as the concentration of HEP increased and the intensity dropped to about 0.45% of the initial intensity in the presence of 9.8 μg mL−1 of HEP (Fig. 2f). The QY was calculated to be only 0.04%, which is extremely low. The ratio of the fluorescence intensity of PDI1vs. HEP:PDI1 and CB[8]:PDI1vs. HEP:PDI1 is greater than 200 and 1000, respectively. These results suggest possible formation of highly ordered non-fluorescent HEP:PDI1 aggregates. The cryo-EM imaging of a HEP:PDI1 solution revealed the formation of nanobelt-shaped aggregates (∼40 nm in width) with uniformly aligned interior alternating strips. The light (∼2.5 nm) and dark stems are from the hydrophobic aromatic cores with higher electron density and the charged backbones with lower electron density, respectively (Fig. 3 and Fig. S4, ESI†). These observations support the proposed structure of highly ordered HEP:PDI1 aggregates (Fig. 3e). To our knowledge, this is the first time perylene H-aggregates formed in a diluted aqueous solution have been visualized. The DLS analysis revealed the presence of HEP:PDI1 nano-aggregates with a size distribution peak (by volume) at ∼40 nm and a zeta potential distribution peak at −55 mV (Fig. S5 and S6, ESI†), suggesting high stability of negatively charged nano-aggregates in water. In comparison, cryo-EM images of PDI1 only in water showed long filaments (Fig. S7, ESI†) and the DLS analysis revealed two size distribution peaks at ∼150 nm and ∼700 nm with a high polydispersity index (PDI) of 1.0 compared to HEP:PDI1 nano-aggregates with a PDI of 0.37. This suggests that the PDI1 sample is polydisperse. In addition, the mean surface zeta potential was measured to be +47 mV, indicating positively charged PDI1 aggregates (Fig. S6, ESI†). The stability of HEP:PDI1 nanoaggregates was further investigated using a temperature study. As shown in Fig. S8 (ESI†), no significant change was observed when the sample was heated to 65 °C, suggesting high stability of HEP:PDI1 aggregates at high temperature, presumably due to the strong electrostatic interactions between highly negatively charged HEP and positively charged PDI1 aggregates. In the control experiment with PDI1 only, the monomer peak at 540 nm increased as the temperature increased from 25 to 65 °C, suggesting gradual deaggregation with increasing temperatures.9
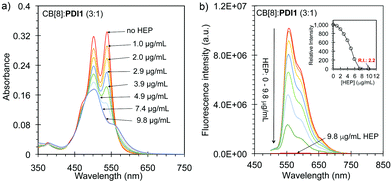
Further studies were performed to explore HEP sensing using the CB[8]:PDI1 complex as the displacement probe. As shown in Fig. 4a, the absorption of the CB[8]:PDI1 complex (3![[thin space (1/6-em)]](https://www.rsc.org/images/entities/char_2009.gif) :
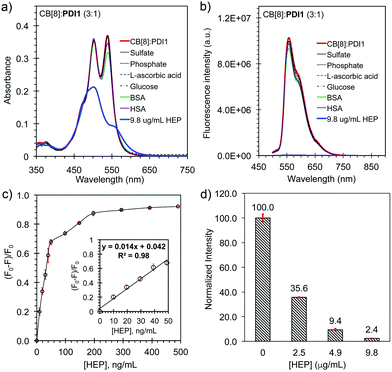
:![[thin space (1/6-em)]](https://www.rsc.org/images/entities/char_2009.gif) 1, 10 μM PDI1) decreased gradually with increased A500/A540 ratio as the concentration of HEP increased from 0 to 9.8 μg mL−1. The fluorescence intensity of the complex decreased gradually as the concentration of HEP increased and dropped about 99.7% in the presence of 9.8 μg mL−1 of HEP, suggesting a complete displacement of CB8 by HEP through the formation of non-fluorescent HEP:PDI1 nanoaggregates (Fig. 4b). The selectivity of the displacement probe for HEP over other common anions and molecules was further investigated. As shown Fig. 5a and b, the addition of excess sulfate, phosphate, L-ascorbic acid, glucose, BSA, or HSA did not cause a significant change on either the UV-vis absorption or the fluorescence emission. In contrast, the addition of 9.8 μg mL−1 of HEP caused a 50% drop of the absorption and a 99.7% drop of the fluorescence emission. This study suggested the good selectivity of the probe to HEP. The sensitivity of the displacement probe for HEP was performed using a low concentration of PDI1 (100 nM) with excess CB[8] (100 equiv., 10 μM) in a Tris-buffer (pH 7.4). The fluorescence titration curve shows a linear relation between the fluorescence change and the concentration of HEP in the range of 0 to 49 ng mL−1 with a correlation coefficient of 0.98 (Fig. 5c and Fig. S9, ESI†). The detection limit (LOD) was calculated to be 2.4 ng mL−1 (or ∼0.13 nM or 0.5 mU mL−1) (LOD = 3σ/K), which is 4000 times lower than a recommended clinical dose amount (10
1, 10 μM PDI1) decreased gradually with increased A500/A540 ratio as the concentration of HEP increased from 0 to 9.8 μg mL−1. The fluorescence intensity of the complex decreased gradually as the concentration of HEP increased and dropped about 99.7% in the presence of 9.8 μg mL−1 of HEP, suggesting a complete displacement of CB8 by HEP through the formation of non-fluorescent HEP:PDI1 nanoaggregates (Fig. 4b). The selectivity of the displacement probe for HEP over other common anions and molecules was further investigated. As shown Fig. 5a and b, the addition of excess sulfate, phosphate, L-ascorbic acid, glucose, BSA, or HSA did not cause a significant change on either the UV-vis absorption or the fluorescence emission. In contrast, the addition of 9.8 μg mL−1 of HEP caused a 50% drop of the absorption and a 99.7% drop of the fluorescence emission. This study suggested the good selectivity of the probe to HEP. The sensitivity of the displacement probe for HEP was performed using a low concentration of PDI1 (100 nM) with excess CB[8] (100 equiv., 10 μM) in a Tris-buffer (pH 7.4). The fluorescence titration curve shows a linear relation between the fluorescence change and the concentration of HEP in the range of 0 to 49 ng mL−1 with a correlation coefficient of 0.98 (Fig. 5c and Fig. S9, ESI†). The detection limit (LOD) was calculated to be 2.4 ng mL−1 (or ∼0.13 nM or 0.5 mU mL−1) (LOD = 3σ/K), which is 4000 times lower than a recommended clinical dose amount (10![[thin space (1/6-em)]](https://www.rsc.org/images/entities/char_2009.gif) 000 units/68 kg patient or 2.0 units per mL in blood) and superior to most HEP detection methods reported previously (Table S1, ESI†), suggesting the high sensitivity of the probe (Fig. 5c inset and Fig. S10, ESI†).8,14 The detection of HEP in human serum was further demonstrated using standard addition of HEP to human serum samples. As shown in Fig. 5d, the presence of 2.5, 4.9, and 9.8 μg mL−1 of HEP in a Tris buffer with 1% serum caused a drop of the fluorescence intensity from 100 to about 35.6, 9.4, and 2.4, respectively. This study suggested the potential clinical application of the CB[8]:PDI1 complex as a fluorescence displacement probe for monitoring HEP in human serum samples.
000 units/68 kg patient or 2.0 units per mL in blood) and superior to most HEP detection methods reported previously (Table S1, ESI†), suggesting the high sensitivity of the probe (Fig. 5c inset and Fig. S10, ESI†).8,14 The detection of HEP in human serum was further demonstrated using standard addition of HEP to human serum samples. As shown in Fig. 5d, the presence of 2.5, 4.9, and 9.8 μg mL−1 of HEP in a Tris buffer with 1% serum caused a drop of the fluorescence intensity from 100 to about 35.6, 9.4, and 2.4, respectively. This study suggested the potential clinical application of the CB[8]:PDI1 complex as a fluorescence displacement probe for monitoring HEP in human serum samples.
In summary, we have designed and synthesized a new functionalized perylene derivative PDI1 with pyridium side chains. CB[8] binding with PDI1 leads to highly fluorescent host–guest CB[8]:PDI1 complexes through hydrophobic and electrostatic interactions. HEP multisite-binding with PDI1 leads to highly ordered HEP:PDI1 nano-aggregates with ultra-low fluorescence (QY: 0.04%). More interestingly, the morphology of these highly ordered HEP:PDI1 nano-aggregates in a dilute solution was directly visualized using cryo-EM for the first time. We further demonstrated the application of the CB[8]:PDI1 complex as a fluorescent displacement probe for the sensitive detection of HEP and a detection limit of 2.4 ng mL−1 (∼0.13 nM) was achieved. Our study suggested the potential application of the CB[8]:PDI1 complexes as a simple, rapid, and inexpensive probe for the sensitive detection of HEP. Beyond sensing applications, the general supramolecular approach for highly ordered nano-aggregates using the multisite-binding strategy via non-covalent interactions is expected to be valuable in the development of new highly organized materials.
This project was supported by University of Nevada-Reno (Grant No. 1310043-03 and No. 2000978). The UC Davis BioEM Facility is supported by the user fees, the Department of Molecular and Cellular Biology, the College of Biosciences, the Office of Research and the Provost's Office. The Technical Director, Dr Fei Guo, is supported by discretionary funds provided by Professor Jodi Nunnari (MCB). The K3 and DED detectors were purchased from funding support provided by the Department of Molecular and Cellular Biology, College of Biological Sciences and grant support provided by R00-GM080249 (J. Al-Bassam).
Conflicts of interest
There are no conflicts to declare.Notes and references
- (a) X. Sun and T. D. James, Chem. Rev., 2015, 115, 8001–8037 CrossRef CAS; (b) J. Dong and M. Zhao, Trends Anal. Chem., 2016, 80, 190–203 CrossRef CAS; (c) J. Chan, S. C. Dodani and C. J. Chang, Nat. Chem., 2012, 4, 973–984 CrossRef CAS.
- N. Mackman, Nature, 2008, 451, 914 CrossRef CAS.
- S. M. Bromfield, E. Wilde and D. K. Smith, Chem. Soc. Rev., 2013, 42, 9184–9195 RSC.
- (a) J. Bowers and J. J. Ferguson, Clin. Cardiol., 1994, 17, 357–361 CrossRef CAS; (b) T. J. Cheng, T. M. Lin, T. H. Wu and H. C. Chang, Anal. Chim. Acta, 2001, 432, 101–111 CrossRef CAS.
- (a) X.-L. Ni, X. Xiao, H. Cong, Q.-J. Zhu, S.-F. Xue and Z. Tao, Acc. Chem. Res., 2014, 47, 1386–1395 CrossRef CAS; (b) L. C. Smith, D. G. Leach, B. E. Blaylock, O. A. Ali and A. R. Urbach, J. Am. Chem. Soc., 2015, 137, 3663–3669 CrossRef CAS; (c) S. Sonzini, J. A. McCune, P. Ravn, O. A. Sherman and C. F. van der Walle, Chem. Commun., 2017, 53, 8842–8845 RSC; (d) M. Nilam, Ch Huang, S. Karmacharya, G. H. Aryal, L. Huang, W. M. Nau and K. I. Assaf, ChemistrySelect, 2020, 5, 5850–5854 CrossRef CAS.
- (a) G. Ghale and W. M. Nau, Acc. Chem. Res., 2014, 47, 2150–2159 CrossRef CAS; (b) S. Sonzini, J. A. McCune, P. Ravn, O. A. Sherman and C. F. van der Walle, Chem. Commun., 2017, 53, 8842–8845 RSC; (c) G. H. Aryal, K. W. Hunter and L. Huang, Org. Biomol. Chem., 2018, 16, 7425–7429 RSC.
- (a) G. H. Aryal, K. L. Assaf, K. W. Hunter, W. M. Nau and L. Huang, Chem. Commun., 2017, 53, 9242–9245 RSC; (b) G. H. Aryal, R. Vik, K. I. Assaf, K. W. Hunter, L. Huang, J. Jayawickramarajah and W. M. Nau, ChemistrySelect, 2018, 3, 4699–4704 CrossRef CAS; (c) G. H. Aryal, K. Lu, G. Chen, K. W. Hunter and L. Huang, Chem. Commun., 2019, 55, 13912–13915 RSC.
- (a) N. H. Mudliar, P. M. Dongre and P. K. Singh, Sens. Actuators, B, 2019, 127089 CrossRef CAS; (b) H. Liu, P. Song, R. Wei, K. Li and A. Tong, Talanta, 2014, 118, 348–352 CrossRef CAS; (c) J. Zheng, T. Ye, J. Chen, L. Xu, X. Ji, C. Yang and Z. He, Biosens. Bioelectron., 2017, 90, 245–250 CrossRef CAS; (d) L. Cai, R. Zhan, K. Y. Pu, X. Qi, H. Zhang, W. Huang and B. Liu, Anal. Chem., 2011, 83, 7849–7855 CrossRef CAS; (e) S. Y. Hung and W. L. Tseng, Biosens. Bioelectron., 2014, 57, 186–191 CrossRef CAS; (f) Z. Liu, Q. Ma, X. Wang, Z. Lin, H. Zhang, L. Liu and X. Su, Biosens. Bioelectron., 2014, 54, 617–622 CrossRef CAS; (g) P. Guo, Y. Wang and Q. Zhuang, Sens. Actuators, B, 2019, 126873 CrossRef CAS.
- F. Biedermann, E. Elmalen, I. Ghosh, W. M. Nau and O. A. Sherman, Angew. Chem., Int. Ed., 2012, 51, 7739–7743 CrossRef CAS.
- F. Wurthner, C. R. Saha-Moller, B. Fimmel, S. Ogi, P. Leowanawat and D. Schmidt, Chem. Rev., 2016, 116, 962–1052 CrossRef.
- (a) L. Huang, S.-W. Tam-Chang, W. Seo and K. Rove, Adv. Mater., 2007, 19, 4149–4152 CrossRef CAS; (b) S.-W. Tam-Chang and L. Huang, Chem. Commun., 2008, 1957–1967 RSC.
- (a) H. Bakirci, X. Zhang and W. M. Nau, J. Org. Chem., 2005, 70, 39–46 CrossRef CAS; (b) W. M. Nau and X. Zhang, J. Am. Chem. Soc., 1999, 121, 8022–8032 CrossRef CAS.
- A. Shvarev and E. Bakker, J. Am. Chem. Soc., 2003, 125, 11192–11193 CrossRef CAS.
- (a) D. MacDougall and W. B. Crummett, Anal. Chem., 1980, 52, 2242–2249 CrossRef CAS; (b) B. Zhang, L. Huang, M. Tang, K. W. Hunter, Y. Feng, Q. Sun, J. Wang and G. Chen, Microchim. Acta, 2018, 185, 385 CrossRef.
Footnotes |
| † Electronic supplementary information (ESI) available: Experimental procedures, characterization data, optical properties, UV-vis spectra, fluorescence spectra, DLS data, cryo-EM images, and fluorescence titration. See DOI: 10.1039/d0cc05943a |
| ‡ These authors contributed equally to this work. |
| This journal is © The Royal Society of Chemistry 2020 |

