 Open Access Article
Bulk ionic screening lengths from extremely large-scale molecular dynamics simulations†
Johannes
Zeman
 a,
Svyatoslav
Kondrat
 bcd and
Christian
Holm
 *a
*a
aInstitute for Computational Physics, University of Stuttgart, D-70569 Stuttgart, Germany. E-mail: holm@icp.uni-stuttgart.de
bDepartment of Complex Systems, Institute of Physical Chemistry, Polish Academy of Sciences, 01-224 Warsaw, Poland
cMax-Planck-Institut für Intelligente Systeme, Heisenbergstraße 3, 70569 Stuttgart, Germany
dIV. Institut für Theoretische Physik, Universität Stuttgart, Pfaffenwaldring 57, 70569 Stuttgart, Germany
First published on 7th December 2020
Abstract
Recent experiments have reported anomalously large screening lengths of interactions between charged surfaces confining concentrated electrolytes and ionic liquids. Termed underscreening, this effect was ascribed to bulk properties of dense ionic systems. Herein, we study bulk ionic screening with extremely large-scale molecular dynamics simulations, allowing us to assess the range of distances relevant to the experiments. Our results yield two screening lengths satisfying distinct scaling relations. However, with an accuracy of 10−5kBT in interionic potentials of mean force, we find no signs of underscreening, suggesting that other than bulk effects might be at play in the experiments.
Concentrated electrolytes and room-temperature ionic liquids (ILs) are playing an increasingly important role in science and technology, with applications ranging from organic synthesis, catalysis and analytical chemistry to electrochemical energy storage.1–4 Tailoring their properties requires a fundamental understanding of the intra- and intermolecular mechanisms governing their internal structure and dynamics. A puzzling observation, attributed to the bulk properties of concentrated electrolytes and ionic liquids, is the so-called underscreening, which is an anomalously large decay length of electrostatic interactions mediated by these liquids, as reported by recent surface force balance (SFB) experiments.5–9
For dilute electrolytes, the decay length is well described by the Debye–Hückel theory10 with the Debye screening length  where ε0 is the vacuum permittivity, εr the relative dielectric permittivity of a homogeneous background medium, kB the Boltzmann constant, T the absolute temperature, ρi and zi the number density and the valency of species i, and e the elementary charge. In the high-concentration regime, classical liquid state theories predict a damped oscillatory behavior, which is either core- or electrostatics-dominated, with the screening length exceeding λD and growing with increasing electrolyte concentration.11–14 The aforementioned SFB experiments reported the emergence of a screening length λS roughly an order of magnitude larger than the ones predicted by classical theories.5–9 In these experiments, the force was measured between two atomically flat, charged surfaces, confining neat ILs or electrolytes, and λS was extracted by fitting the force to a monotonic, exponentially decaying function of surface separation. All analyzed experimental data for λSversus ion concentration collapsed onto a single curve if appropriately rescaled. The corresponding scaling relation15,16
 | (1) |
Herein, we report on long-range screening in selected bulk ionic systems obtained by extremely large-scale molecular dynamics (MD) simulations in volumes that encompass several of the experimentally measured screening lengths. As an example of a neat IL, we investigate 1-butyl-3-methylimidazolium hexafluorophosphate ([C4C1Im]+[PF6]−) as there exist well-tested MD force fields for both all-atom and coarse-grained representations of this IL. We also perform all-atom simulations of aqueous sodium chloride (NaCl) solutions with concentrations ranging from 1 to 5.2 mol l−1. Finally, we conduct a series of simulations of 1-butyl-3-methylimidazolium bis(trifluoromethylsulfonyl)imide ([C4C1Im]+[NTF2]−) in a racemic propylene carbonate (PC) mixture (equal amounts of (R)- and (S)-propylene carbonate) for IL mole fractions between x = 0.05 and x = 1 (pure [C4C1Im]+[NTF2]−). This system is similar to the solution of 1-butyl-1-methylpyrrolidinium bis(trifluoromethylsulfonyl)imide ([C4C1Pyrr]+[NTF2]−) in PC studied in ref. 9. All system compositions are listed in Section S1 of the ESI.†
Simulations have been performed with the GROMACS 2016.3 simulation package17 in the NpT ensemble using cubic boxes under periodic boundary conditions at temperature T = 300 K and pressure p = 1 bar (simulation parameters are listed in Section S3 of the ESI†). For ILs, we employed the 0.8*OPLS-2009IL all-atom force field of Doherty et al.18 and the ILM2 force field of Roy and Maroncelli19 for the coarse-grained description of [C4C1Im]+[PF6]−. To simulate aqueous NaCl solutions, we used the KBFF ion parameters of Weerasinghe and Smith20 in conjunction with the extended simple point charge (SPC/E) water model.21 To describe the PC interactions for the simulations of [C4C1Im]+[NTF2]− in PC, we used the parameters provided by Takeuchi et al.22
From the simulation trajectories, we computed radial distribution functions (RDFs) gXY(r) (X and Y denote ionic species). For our large-scale ionic systems, the computation of RDFs with GROMACS analysis tools would have taken several years to complete. We have therefore developed our own optimized analysis tool based on MDAnalysis23,24 and MPI for Python,25–27 allowing the evaluation of RDFs on hundreds of CPUs in parallel.28
In spatially homogeneous systems, the effective interaction between ions X and Y is described by the potential of mean force (PMF), which is related to the RDF by wXY(r) = −kBT![[thin space (1/6-em)]](https://www.rsc.org/images/entities/char_2009.gif) ln(gXY(r)). If the observed long-range decay5–9 is a property of bulk ionic liquids, one can expect the same asymptotic decay in an effective ion–ion interaction potential,29 and hence, in the corresponding PMF. Our further discussion will therefore be based on the analysis of PMFs.
ln(gXY(r)). If the observed long-range decay5–9 is a property of bulk ionic liquids, one can expect the same asymptotic decay in an effective ion–ion interaction potential,29 and hence, in the corresponding PMF. Our further discussion will therefore be based on the analysis of PMFs.
Before discussing our results, it is important to stress that the experimentally observed transition between the damped oscillatory and the ‘under-screened’ monotonic regime occurred at separations between 4 and 7 nm for ILs, and up to 3 nm for NaCl.9,30 Thus, simulated systems have to be sufficiently large to allow the evaluation of PMFs far beyond these separations. Furthermore, ILs exhibit slow structural relaxations, necessitating simulation times of several hundred nanoseconds.31 Unlike previous work,32 our simulations strictly fulfill both requirements (see Section S2.3 of the ESI† for a comparison of PMFs for different simulation times). Since the magnitude of underscreening is expected to be small, possibly interfering with statistical errors, we also performed rigorous error analyses for all data series, taking temporal correlations into account.28
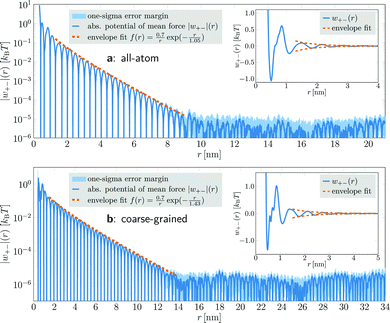
For distances up to r ≈ 8.5 nm, the PMF is well-described by an exponentially damped oscillatory hyperbolic decay
 | (2) |
In coarse-grained simulations of [C4C1Im]+[PF6]−, the box edge length was almost 50 nm and the system comprised 358![[thin space (1/6-em)]](https://www.rsc.org/images/entities/char_2009.gif) 296 ion pairs (1
296 ion pairs (1![[thin space (1/6-em)]](https://www.rsc.org/images/entities/char_2009.gif) 433
433![[thin space (1/6-em)]](https://www.rsc.org/images/entities/char_2009.gif) 184 interaction sites). The PMFs were calculated for distances up to 34 nm (Fig. 1b). They exhibit the same qualitative behavior as the all-atom model, but yield a larger decay length λS = 1.43 nm, which can be attributed to the coarse-grained description. Due to the larger number of ions in the system, the increased statistical accuracy allowed us to resolve the oscillatory decay at distances up to 13 nm. For larger distances, the PMF again enters a region of almost constant noise level.
184 interaction sites). The PMFs were calculated for distances up to 34 nm (Fig. 1b). They exhibit the same qualitative behavior as the all-atom model, but yield a larger decay length λS = 1.43 nm, which can be attributed to the coarse-grained description. Due to the larger number of ions in the system, the increased statistical accuracy allowed us to resolve the oscillatory decay at distances up to 13 nm. For larger distances, the PMF again enters a region of almost constant noise level.
Next, we analyze a 4.43 mol l−1 aqueous NaCl solution. This system comprised 216![[thin space (1/6-em)]](https://www.rsc.org/images/entities/char_2009.gif) 000 ion pairs and 2
000 ion pairs and 2![[thin space (1/6-em)]](https://www.rsc.org/images/entities/char_2009.gif) 458
458![[thin space (1/6-em)]](https://www.rsc.org/images/entities/char_2009.gif) 296 water molecules (7
296 water molecules (7![[thin space (1/6-em)]](https://www.rsc.org/images/entities/char_2009.gif) 806
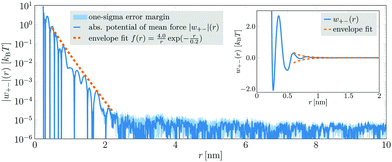
806![[thin space (1/6-em)]](https://www.rsc.org/images/entities/char_2009.gif) 888 atoms in total) in a simulation box with an edge length of 43.25 nm. The cation–anion PMF obtained from a 200 ns simulation run is displayed in Fig. 2. Although in this case a superposition of several damped oscillatory functions was needed to fit the PMFs (cf.eqn (3)), up to 2.2 nm their envelope could still be approximated by a single decay (dashed orange line in Fig. 2). The extracted decay length λS = 0.2 nm is again consistent with classical theories.11–14 For distances exceeding 2.2 nm, the PMF becomes very noisy and no distinct oscillations are discernible. In this region, the PMF's envelope may seem to follow a long-ranged decay. However, this decay is entirely due to statistical noise, which decreases with distance. It can be shown that the noise in the PMF of an ideal gas, comprising the same number of particles in the same volume, exhibits the very same decay.28 Hence, in this case, there is also no anomalously long-ranged monotonic decay of interionic interactions detectable within an accuracy of ≈10−5kBT.
888 atoms in total) in a simulation box with an edge length of 43.25 nm. The cation–anion PMF obtained from a 200 ns simulation run is displayed in Fig. 2. Although in this case a superposition of several damped oscillatory functions was needed to fit the PMFs (cf.eqn (3)), up to 2.2 nm their envelope could still be approximated by a single decay (dashed orange line in Fig. 2). The extracted decay length λS = 0.2 nm is again consistent with classical theories.11–14 For distances exceeding 2.2 nm, the PMF becomes very noisy and no distinct oscillations are discernible. In this region, the PMF's envelope may seem to follow a long-ranged decay. However, this decay is entirely due to statistical noise, which decreases with distance. It can be shown that the noise in the PMF of an ideal gas, comprising the same number of particles in the same volume, exhibits the very same decay.28 Hence, in this case, there is also no anomalously long-ranged monotonic decay of interionic interactions detectable within an accuracy of ≈10−5kBT.
To study the concentration dependence of the screening lengths, we simulated aqueous NaCl electrolytes for ion concentrations ranging from 1.16 to 5.19 mol l−1. Each system comprised 3750 ion pairs and a concentration-dependent number of water molecules. In addition, we conducted all-atom simulations of [C4C1Im]+[NTf2]− in PC at various concentrations. As there has been no sign of anomalously large screening lengths, we chose to use smaller simulation boxes in favor of covering a larger number of IL concentrations. With the exception of the two lowest concentrations, all systems contained 500 ion pairs and a suitably adjusted number of PC molecules. For each system, we performed up to four independent simulation runs with more than 1 μs per run.
Unlike for neat [C4C1Im]+[PF6]−, these systems required a superposition of several oscillatory exponentially damped hyperbolas
 | (3) |
 | ||
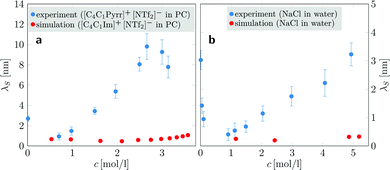
| Fig. 3 Concentration-dependent screening lengths λS obtained from MD simulations compared to those obtained from experimental SFB measurements for similar ionic species. (a) Experimentally determined electrostatic screening lengths of [C4C1Pyrr]+[NTf2]− in PC (blue dots) compared to simulation results of [C4C1Im]+[NTf6]− in PC (red dots). (b) Screening lengths of aqueous NaCl solutions (experiment: blue dots; simulation: red dots). Experimental data are taken from ref. 9. | ||
Determining scaling relations for the correlation lengths, akin to eqn (1), requires the knowledge of an average ion diameter d and the Debye length λD. For [C4C1Im]+[NTf2]−, we used the number of ion pairs NIP and the simulation box volume V to determine  ; for NaCl we took d = 0.294 nm from ref. 9. Calculating λD requires the knowledge of the static relative dielectric permittivity εr of a background medium. We computed εr of the entire system, as in ref. 15, by using the Einstein–Helfand method.33 The obtained values of εr compare well with the available experimental data for pure PC34 and pure [C4C1Im]+[PF6]−.35 For aqueous NaCl, our εr is systematically lower than the experimental values, due to the SPC/E model underestimating the permittivity of water.36 Nevertheless, the concentration-dependent trend is well reproduced (cf.ref. 37). The values of εr are listed in Section S2.2 of the ESI.†
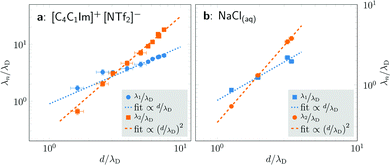
Fig. 4 shows the ratio λn/λD (n = 1, 2) as a function of d/λD with λn obtained from fitting the PMFs to eqn (3). The asymptotic linear and quadratic scaling
 | (4) |
 | ||
| Fig. 4 Scaling of the concentration-dependent screening lengths of [C4C1Im]+[NTf2]− in propylene carbonate (left) and NaCl in water (right) as determined by fits of eqn (3) to cation–anion PMFs w+−(r). The ratio of the screening λn to the concentration-dependent Debye length λD is shown as a function of the average ion diameter d divided by λD. For both substances, we see two decay lengths, each corresponding to a distinct wavelength 2π/ωn, and both exhibiting a power law dependence. For both systems, the asymptotic decay length ratio for high concentrations λ2/λD is proportional to (d/λD)2. | ||
In conclusion, our extremely large-scale MD simulations of concentrated electrolytes and neat ionic liquids allowed us to calculate interionic PMFs with unprecedented precision and to analyze their behavior in a range of distances relevant to experiments.5–9 We revealed the existence of two screening lengths showing linear and quadratic scaling, eqn (4). However, within a PMF accuracy of 10−5kBT, we observed no evidence for an anomalously long-ranged, monotonic decay in effective ionic interactions. These results demonstrate that underscreening is unlikely an equilibrium bulk property of concentrated ionic systems.
We finish by noting that, so far, there is no theory of bulk ionic systems consistent with underscreening and cubic scaling (eqn (1) with α = 3).38–41 Interestingly, most recent SFB results, while showing extremely large decay lengths, have demonstrated inconsistencies with the cubic scaling for [EMIM]+[EtSO4]−.42,43 Furthermore, to our knowledge, only one atomic force microscopy (AFM) study44 reported underscreening, and only at elevated temperatures, while other AFM measurements have not.6 Thus, a careful examination of underscreening, preferentially by complementary experimental techniques appears necessary, while other than bulk ionic effects may need to be considered to explain the SFB results of ref. 5–9.
We acknowledge support through DFG grant no. INST 37/935-1 FUGG and the High Performance Computing Center Stuttgart, Germany. C. H. acknowledges financial contributions from the DFG (German Research Foundation) under Germany's Excellence Strategy – EXC 2075 – 390740016.
Conflicts of interest
There are no conflicts to declare.References
- R. D. Rogers and K. R. Seddon, Science, 2003, 302, 792–793 CrossRef.
- S. Pandey, Anal. Chim. Acta, 2006, 556, 38–45 CrossRef CAS.
- R. Hayes, G. G. Warr and R. Atkin, Chem. Rev., 2015, 115, 6357–6426 CrossRef CAS.
- Z. Lei, B. Chen, Y.-M. Koo and D. R. MacFarlane, Chem. Rev., 2017, 117, 6633–6635 CrossRef.
- M. A. Gebbie, M. Valtiner, X. Banquy, E. T. Fox, W. A. Henderson and J. N. Israelachvili, Proc. Natl. Acad. Sci. U. S. A., 2013, 110, 9674–9679 CrossRef CAS.
- T. Baimpos, B. R. Shrestha, S. Raman and M. Valtiner, Langmuir, 2014, 30, 4322–4332 CrossRef CAS.
- R. M. Espinosa-Marzal, A. Arcifa, A. Rossi and N. D. Spencer, J. Phys. Chem. Lett., 2014, 5, 179–184 CrossRef CAS.
- M. A. Gebbie, H. A. Dobbs, M. Valtiner and J. N. Israelachvili, Proc. Natl. Acad. Sci. U. S. A., 2015, 112, 7432–7437 CrossRef CAS.
- A. M. Smith, A. A. Lee and S. Perkin, J. Phys. Chem. Lett., 2016, 7, 2157–2163 CrossRef CAS.
- P. Debye and E. Hückel, Phys. Z, 1923, 24, 185–206 CAS.
- P. Attard, Phys. Rev. E: Stat., Nonlinear, Soft Matter Phys., 1993, 48, 3604–3621 CrossRef CAS.
- R. Evans, R. J. F. Leote de Carvalho, J. R. Henderson and D. C. Hoyle, J. Chem. Phys., 1994, 100, 591–603 CrossRef CAS.
- R. J. F. Leote de Carvalho and R. Evans, Mol. Phys., 1994, 83, 619–654 CrossRef.
- L. M. Varela, M. García and V. Mosquera, Phys. Rep., 2003, 382, 1–111 CrossRef CAS.
- A. A. Lee, C. S. Perez-Martinez, A. M. Smith and S. Perkin, Phys. Rev. Lett., 2017, 119, 026002 CrossRef.
- A. A. Lee, C. S. Perez-Martinez, A. M. Smith and S. Perkin, Faraday Discuss., 2017, 199, 239–259 RSC.
- M. J. Abraham, T. Murtola, R. Schulz, S. Páll, J. C. Smith, B. Hess and E. Lindahl, SoftwareX, 2015, 1, 19–25 CrossRef.
- B. Doherty, X. Zhong, S. Gathiaka, B. Li and O. Acevedo, J. Chem. Theory Comput., 2017, 13, 6131–6145 CrossRef CAS.
- D. Roy and M. Maroncelli, J. Phys. Chem. B, 2010, 114, 12629–12631 CrossRef CAS.
- S. Weerasinghe and P. E. Smith, J. Chem. Phys., 2003, 119, 11342–11349 CrossRef CAS.
- H. J. C. Berendsen, J. R. Grigera and T. P. Straatsma, J. Phys. Chem., 1987, 91, 6269–6271 CrossRef CAS.
- M. Takeuchi, Y. Kameda, Y. Umebayashi, S. Ogawa, T. Sonoda, S.-i. Ishiguro, M. Fujita and M. Sano, J. Mol. Liq., 2009, 148, 99–108 CrossRef CAS.
- N. Michaud-Agrawal, E. J. Denning, T. B. Woolf and O. Beckstein, J. Comput. Chem., 2011, 32, 2319–2327 CrossRef CAS.
- R. J. Gowers, M. Linke, J. Barnoud, T. J. E. Reddy, M. N. Melo, S. L. Seyler, J. Domański, D. L. Dotson, S. Buchoux, I. M. Kenney and O. Beckstein, Proceedings of the 15th Python in Science Conference, 2016, pp. 98–105.
- L. D. Dalcín, R. R. Paz and M. Storti, J. Parallel Distrib. Comput., 2005, 65, 1108–1115 CrossRef.
- L. D. Dalcín, R. R. Paz, M. Storti and J. D'Elía, J. Parallel Distrib. Comput., 2008, 68, 655–662 CrossRef.
- L. D. Dalcín, R. R. Paz, P. A. Kler and A. Cosimo, Adv. Water Resour., 2011, 34, 1124–1139 CrossRef.
- J. Zeman, S. Kondrat and C. Holm, to be published.
- R. Kjellander, J. Chem. Phys., 2018, 148, 193701 CrossRef.
- M. A. Gebbie, A. M. Smith, H. A. Dobbs, A. A. Lee, G. G. Warr, X. Banquy, M. Valtiner, M. W. Rutland, J. N. Israelachvili, S. Perkin and R. Atkin, Chem. Commun., 2017, 53, 1214–1224 RSC.
- S. Gabl, C. Schröder and O. Steinhauser, J. Chem. Phys., 2012, 137, 094501 CrossRef.
- S. W. Coles, C. Park, R. Nikam, M. Kanduč, J. Dzubiella and B. Rotenberg, J. Phys. Chem. B, 2020, 124, 1778–1786 CAS.
- C. Schröder, M. Haberler and O. Steinhauser, J. Chem. Phys., 2008, 128, 134501 CrossRef.
- J.-F. Côté, D. Brouillette, J. E. Desnoyers, J.-F. Rouleau, J.-M. St-Arnaud and G. Perron, J. Solution Chem., 1996, 25, 1163–1173 CrossRef.
- C. Daguenet, P. J. Dyson, I. Krossing, A. Oleinikova, J. Slattery, C. Wakai and H. Weingärtner, J. Phys. Chem. B, 2006, 110, 12682–12688 CrossRef CAS.
- M. Sega and C. Schröder, J. Phys. Chem. A, 2015, 119, 1539–1547 CrossRef CAS.
- A. Peyman, C. Gabriel and E. H. Grant, Bioelectromagnetics, 2007, 28, 264–274 CrossRef CAS.
- R. M. Adar, S. A. Safran, H. Diamant and D. Andelman, Phys. Rev. E: Stat., Nonlinear, Soft Matter Phys., 2019, 100, 042615 CrossRef CAS.
- N. Gavish, D. Elad and A. Yochelis, J. Phys. Chem. Lett., 2018, 9, 36–42 CrossRef CAS.
- B. Rotenberg, O. Bernard and J.-P. Hansen, J. Phys.: Condens. Matter, 2018, 30, 054005 CrossRef.
- R. Kjellander, Soft Matter, 2019, 15, 5866–5895 CAS.
- M. Han and R. M. Espinosa-Marzal, J. Phys. Chem. C, 2018, 122, 21344–21355 CrossRef CAS.
- M. Han and R. M. Espinosa-Marzal, ACS Appl. Mater. Interfaces, 2019, 11, 33465–33477 CrossRef CAS.
- N. Hjalmarsson, R. Atkin and M. W. Rutland, Chem. Commun., 2017, 53, 647–650 RSC.
Footnote |
| † Electronic supplementary information (ESI) available. See DOI: 10.1039/d0cc05023g |
| This journal is © The Royal Society of Chemistry 2020 |


