
 Open Access Article
 This Open Access Article is licensed under a
 Creative Commons Attribution 3.0 Unported Licence
Synthesis of TiO2−x/W18O49 hollow double-shell and core–shell microspheres for CO2 photoreduction under visible light†
Jeannie Z. Y.
Tan
 *a,
Stelios
Gavrielides
a,
Meltiani
Belekoukia
a,
Warren A.
Thompson
a,
Leila
Negahdar
bc,
Fang
Xia
d,
M. Mercedes
Maroto-Valer
a and
Andrew M.
Beale
bc
*a,
Stelios
Gavrielides
a,
Meltiani
Belekoukia
a,
Warren A.
Thompson
a,
Leila
Negahdar
bc,
Fang
Xia
d,
M. Mercedes
Maroto-Valer
a and
Andrew M.
Beale
bc
aResearch Centre for Carbon Solutions (RCCS), Heriot-Watt University, Edinburgh EH14 4AS, UK. E-mail: j.tan@hw.ac.uk
bDepartment of Chemistry, UCL, 20 Gordon Street, London, WC1H 0AJ, UK
cUK Catalysis Hub, Research Complex at Harwell, Rutherford Appleton Laboratory, Harwell, Oxfordshire OX11 0FA, UK
dCollege of Science, Health, Engineering and Education, Murdoch University, Murdoch, Western Australia 6150, Australia
First published on 27th August 2020
Abstract
TiO2−x/W18O49 with core–shell or double-shelled hollow microspheres were synthesized through a facile multi-step solvothermal method. The formation of the hollow microspheres with a double-shell was a result of the Kirkendall effect during the solvothermal treatment with concentrated NaOH. The advanced architecture significantly enhanced the electronic properties of TiO2−x/W18O49, improving by more than 30 times the CO2 photoreduction efficiency compared to the pristine W18O49. Operando DRIFTS measurements revealed that the yellow TiO2−x was a preferable CO2 adsorption and conversion site.
Over recent years, a great deal of effort has been dedicated to reducing anthropogenic CO2 concentrations. Amongst the many strategies considered for this purpose, photocatalytic conversion of CO2 and H2O is regarded as one of the most promising solutions, since it not only utilises CO2, but also generates value added chemicals, such as CO and other hydrocarbons.1,2 However, the low selectivity and conversion efficiency of CO2 photoreduction renders the process currently unviable for commercialisation. Perhaps the most promising way to further improve the efficiency of CO2 photoreduction, is to fabricate more efficient photocatalysts. Recently, the synthesis of metal oxides with oxygen vacancies has received increasing attention.3 Compared with vacancy-free counterparts, such metal oxides possess improved optical properties and electrical conductivity, which leads to enhanced separation of photogenerated electron–hole pairs, resulting in overall improvement of the photocatalytic efficiency.4–6
A variety of approaches have been employed to introduce oxygen vacancies into TiO2, among which high temperature calcination in an inert gas environment has proven particularly successful. For example, the reduction of TiO2 anatase was achieved through hydrogenation in a 5% H2/95% Ar environment heated at 450 °C for 7 h.7 The resultant ‘vacancy-rich’ titania possessed a yellow colour, revealing an extension of the frequency of absorption into the visible region when compared with P25 TiO2, which is white in colour.
In addition, the use of advanced architectures, including core–shell,8 and multi-shelled hollow micro/nanostructures,9–11 has been shown to have a positive effect, enhancing the photocatalytic efficiency. For example, Hong et al. fabricated an Ag core with TiO2 shells (14.8 μmol g−1), which revealed a higher gas–solid CO2 photoreduction under a solar simulator when compared to the as-prepared TiO2 nanoparticles (3.9 μmol g−1) and Ag deposited on TiO2 (4.4 μmol g−1) after 3 h.12 Another recent study demonstrated the fabrication of metal–organic framework (MOF) encapsulated Au@PtAg co-catalysts.13 The advanced nanostructure of the assembled noble metals and MOF shell promoted the separation of photogenerated electron–hole pairs and CO2 adsorption, respectively, leading to enhanced CO production from CO2, improved selectivity towards CO and stability for the gas phase CO2 photoreduction.
To incorporate the optical properties (i.e., enhancement in visible light absorption through oxygen vacancies) into a photocatalyst with advanced architecture, we have proposed and developed both core–shell nanoparticles and hollow microspheres with a double-shell. The novelty of this method is the fabrication of both a core and the shell comprising oxygen deficient materials (i.e., TiO2−x/W18O49) without the use of a co-catalyst. Since nanostructured W18O49 had been demonstrated to photoreduce CO2 effectively, a similar synthesis approach was adopted to fabricate the shell layer of the nanoparticles.14
The core–shell TiO2−x/W18O49 was fabricated by a combination of solvothermal and calcination methods. Briefly, TiO2 microspheres were synthesized by a solvothermal method (Step 1). The resultant TiO2 microspheres were calcined, producing a yellowish orange powder, denoted as TiO2−x (Step 2). Next, a thin SiO2 layer was coated onto the TiO2−x microspheres as a protective layer for the core material (Step 3). Subsequently, a layer of W18O49 was coated onto the SiO2 layer by solvothermal treatment (Step 4). Finally, the SiO2 was removed by hydrothermal etching in concentrated aqueous NaOH solution (Step 5). The resulting samples were denoted as TW6h, TW12h and TW24h, where the number indicated the time (hours) taken in Step 4. A detailed description of the synthesis procedure can be found in the ESI.†
The fabricated TiO2−x consisted of highly crystallised anatase phase (JCPDS card no. 21-1272, Fig. S1A(a), ESI†). The TiO2−x had a spherical shape and possessed a rough surface (Fig. S2a and b, ESI†). Taking a closer look under TEM, the TiO2−x (diameter ∼120 nm, Fig. S2c, ESI†) was self-assembled from many bean-like TiO2−x nanoparticles (∼20 nm, Fig. S2d, ESI†). The selected-area electron diffraction pattern (SAED, inset of Fig. S2d, ESI†) revealed that each bean-like nanoparticle was highly crystallised with an interlayer spacing of ∼1.9 nm, matching the interplanar distance of the (200) plane of anatase.
In Step 4, the solvothermal treatment time was manipulated. The crystallinity of the W18O49 layer was observed to initially increase and subsequently decreased with the solvothermal treatment time (Fig. S1A(b–e), ESI†). No W18O49 peak was observed after 6 h of solvothermal treatment; this was probably due to the small amount of W18O49 crystallised on the core nanoparticles (Fig. 1c). When the hydrothermal time was extended to 12 h, a weak W18O49 peak at 23.7° started to emerge (Fig. S1A(c), ESI†). Meanwhile, the characteristic peaks of WO3 were also observed in the TW12h sample (JCPDS card no.: 3-1035, discussed in next paragraph).15 Prolonging the solvothermal treatment time to 24 h resulted in a further decrease of the intensity of TiO2−x as well as the WO3 peaks (Fig. S1A(d), ESI†).
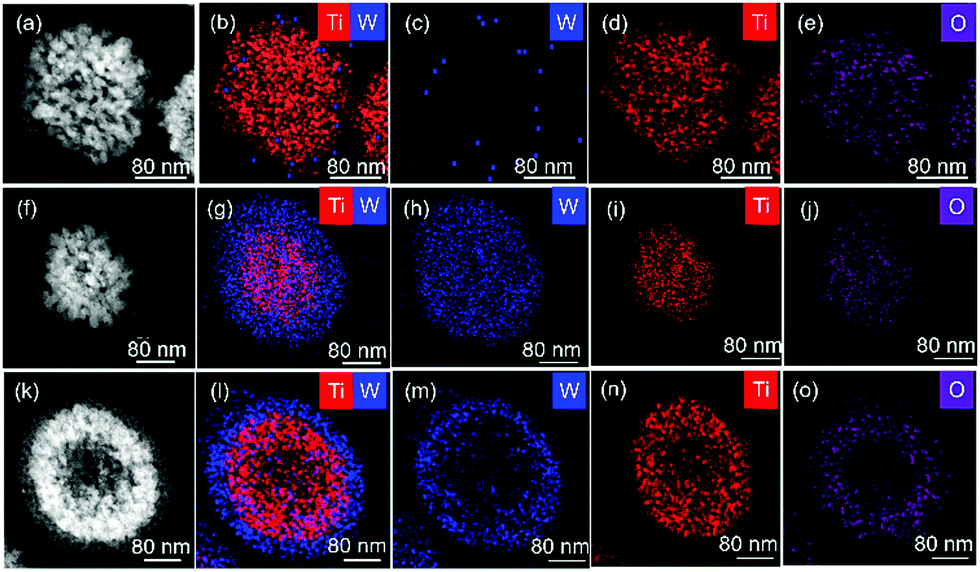 | ||
| Fig. 1 TEM images of TW6h (a), TW12h (f) and TW24h (k) nanoparticles and the corresponding TEM-EDX mapping of the nanospheres (b–e, g–j and k–o, respectively). | ||
Raman spectroscopy was used to further investigate the effect of solvothermal time towards the formation of W18O49 and/or WO3 on the TiO2−x nanoparticles. The characteristic bands of the anatase polymorph of TiO2−x were revealed in the Raman spectrum (Fig. S1B(a), ESI†). When W18O49 was incorporated via solvothermal treatment for 6 h, the Raman feature of the anatase phase was maintained (Fig. S1B(b), ESI†). Further increasing the solvothermal time to 12 h, the anatase band centred at 141 cm−1 was reduced dramatically compared to sample TW6h (Fig. S1B(c), ESI†).16 This observation was paralleled with the observations made with the laboratory-based PXRD (Fig. S1A(c), ESI†). In addition, the characteristic bands of WO3, centred at 397, 517, 637, 691 and 886 cm−1 were also observed. When the solvothermal time was extended to 24 h, the intensity of the anatase peak (141 cm−1) increased again (Fig. S1B(d), ESI†). This observation was in contradiction with the laboratory-based PXRD results, as shown in Fig. S1A(d) (ESI†). This discrepancy was very likely attributed to the increase of the WO3 crystallinity with the solvothermal time.16,17 Furthermore, the co-existence of W18O49 and WO3 phases led to an indistinguishable Raman pattern after 200 cm−1 in sample TW24h (Fig. S1B(e), ESI†).
The synthesis process of Step 4 was characterised using in situ and time resolved synchrotron-based PXRD. The crystallised TiO2 coated with SiO2 was mixed with the precursor solution of W18O49 prior to the time resolved PXRD (Fig. S3a, ESI†). A broad peak of a poorly crystalline precursor centred at ∼8° was observed initially (Fig. S3a, ESI†). When the sample was heated, the broad peak lost its intensity over time, suggesting that the W precursor was consumed (Fig. S3b, ESI†). Meanwhile, peaks corresponding to W18O49 started to emerge, indicating the occurrence of nucleation and crystallisation of W18O49 at the expense of the W precursor. When the temperature reached 180 °C, the intensity of the W18O49 peaks increased and was maintained throughout the experiment. Similar observation was obtained in the small angle region (q = 0.12 Å−1, Fig. S3c, ESI†). The emergence of this peak was attributed to the scattering of the nanocrystals from the newly formed tungstate, in agreement with the observation under TEM-EDX (Fig. 1).
When the TiO2−x was treated in the WCl6 solution for 6 h using solvothermal treatment, the rough surface in the TiO2 could still be seen under SEM (Fig. S4a, ESI†). When prolonging the solvothermal time to 12 h, the surface of the particles became smooth and a layered structure within each nanoparticle was seen (Fig. S4b, ESI†). The microtomed TW12h exhibited a core–shell structure. The core possessed a similar structure as observed in the TiO2−x and a visibly porous shell layer of ∼30 nm thick was observed (Fig. S4e, ESI†). Further extending to 24 h, the size of the nanoparticles increased to ∼300 nm (Fig. S4c, ESI†). Although the thickness of the shell layer was maintained at ∼30 nm, the diameter of the core with a hollow void increased to ∼200 nm (Fig. S4f, ESI†).
The microtomed TW6h nanoparticle was dominated by Ti while W was scarcely distributed on the surface as shown in TEM-EDX (Fig. 1b). This observation supported the result obtained in Raman, in which the weak shoulder peak centred at 115.6 cm−1 was assigned to the characteristic band of W18O49. When TiO2−x was treated in WCl6 solution for 12 h, the TW12h sample revealed a core–shell structure consisting of self-assembled spherical TiO2−x nanoparticles as the core and a visibly porous W18O49 shell (Fig. 1f–j). Further increasing the solvothermal time to 24 h, the TiO2−x nanospheres exhibited a hollow structure (diameter ∼80 nm), resulting in a double layered shell (Fig. 1k–o). The outer layer of the nanosphere consisted of ∼30 nm of W; whereas the thickness of the second layer was ∼60 nm of Ti. From the results obtained, a growth mechanism was proposed. When the time for solvothermal treatment in Step 4 increased, the time for the crystallisation of W18O49 was prolonged, and thus, more pores were created (Fig. 1k). Consequently, the strong alkaline NaOH used in Step 5 could enter the core of the microspheres. The highly concentrated NaOH aqueous solution then broke some of the Ti–O bonds of the TiO2−x under the autogeneous pressure in the autoclave.18 Hence, the influx of concentrated NaOH into the TW12h and TW24h particles was speculated to lead to the dissolution of TiO2−x. However, the outflow of dissolved titania was probably restricted by the W18O49 shell layer. As a result, the re-crystallisation of titania occurred within the microsphere at the edges of the core TiO2−x nanoparticle. As a result, a hollow structure in the TiO2−x core was formed due to imbalanced mass transport, which is known as the Kirkendall effect, leading to an increase in the diameter of the core TiO2 nanosphere.19
The yellowish orange TiO2−x exhibited an enhanced absorbance between 400 and 600 nm when compared to P25 (Fig. S5A, ESI†). The enhancement of absorbance in the TiO2−x sample was due to the presence of Ti3+ and Ti2+ moieties, as evidenced by the XPS studies (Fig. S6a, ESI†). When the W shell was incorporated onto the as-prepared TiO2, the high resolution Ti spectrum of TW6h did not show significant change compared to the as-prepared TiO2−x (Fig. S6b, ESI†). However, the high resolution Ti spectrum of TW12h exhibited only four deconvoluted peaks, which centred at 462.1, 457.3 (attributed to the 2p3/2 of Ti3+), 458.8 and 464.0 eV (attributed to the 2p3/2 and 2p1/2 of Ti4+, Fig. S5B, ESI†). The disappearance of Ti2+ was very likely due to the dissolution and re-crystallisation reaction that occurred in Step 5. As a result, the absorbance at 400–500 nm for the TW12h and TW24h samples was slightly lower than that of the pristine TiO2−x and TW6h (Fig. S5A, ESI†).
The enhancement of light absorbance at 500–600 nm in the TWxh and W18O49 samples was attributed to the oxygen vacancies contributed by W18O49. The presence of oxygen vacancies within the TWxh samples was evidenced in the high resolution O 1s spectrum (Fig. S5C, ESI†). The O 1s spectrum was deconvoluted into three peaks, which centred at 529.1, 530.1 and 531.0 eV. The peak centred at 531.0 eV was attributed to the O related defects, such as oxygen vacancies and oxygen interstitials, and was probably contributed by TiO2−x and W18O49.20,21 Whereas the peaks centred at 529.1 and 530.1 eV were attributed to the lattice O of Ti–O and W–O, respectively.22 The high resolution W 4d5/2 and 4d3/2 peaks centred at 247.2 and 259.7 eV revealed typical W6+ spectra; while the peaks centred at 243.3 and 256.9 eV corresponded to the W5+ moiety (Fig. S5D, ESI†).21
The synthesized samples revealed outstanding performance in CO2 photoreduction under visible light (Table 1). After irradiation for 2 h, sample TW6h produced the highest amount of CO. Prolonged solvothermal treatment significantly reduced the performance of TW12h and TW24h. However, they are still performing better than pristine TiO2−x and no product was observed from P25 under the same conditions. Without using expensive co-catalyst (e.g., Pt, Ru), the photoproduction of CO using TiO2−x/W18O49 was higher than the photocatalyst with co-catalyst (i.e., 0.8% Pt on TiO2–SiO2 produced 1.3 μmol gcatalyst−1 h−1 of CO,23 mononuclear C5H5–RuH complex oxo-bridged TiO2 hybrid produced ∼5 μmol gcatalyst−1 h−1 of CH424), as reported in the literature.
| Sample name | CO production (μmol gcatalyst−1) |
|---|---|
| P25 | 0 |
| Pristine W18O49 | 0.228 |
| Pristine TiO2−x | 0.714 |
| TW6h | 7.944 |
| TW12h | 1.074 |
| TW24h | 0.738 |
The presence of oxygen vacancies revealed enhanced electronic properties. The superior performance of TW6h was further evidenced in the high current density response under solar irradiation (Fig. S7, ESI†). However, the responded current density decreased when the solvothermal time was increased from 6 to 24 h. This was probably due to the reduction in the amount of oxygen vacancies as a result of dissolution and re-crystallisation reactions occurring in the TW12h and TW24h samples (Fig. 1, Fig. S5C, F and G, ESI†) as well as the formation of WO3 (Fig. S1, ESI†).
The superior photocatalytic performance of the TiO2−x compared to P25 could be correlated with the amount and chemical states of CO2 adsorbed as evidenced in operando DRIFTS results (Fig. S8, ESI†). Operando DRIFTS results indicated that P25 had insignificant adsorption throughout the experiment. Therefore, no product was expected from P25 which is in line with the results obtained in the CO2 photoreduction under visible light irradiation.
The pristine TiO2−x revealed a strong band at around 2342 cm−1, which corresponds to gas phase CO2, when CO2 was fed into the reactor at 24 °C in the dark (Fig. S8b, ESI†).25–27 Since the surface of TiO2−x also provided active sites for water splitting, a large amount of adsorbed species will suppress H2 production from water splitting, thus providing high selectivity towards CO formation.28 The bands at around 1620, 1420 and 1296 cm−1 were assigned to the asymmetric CO3 stretching vibration [νas(CO3)], symmetric CO3 stretching vibration [νs(CO3)], and O–H deformation vibration [δ(O–H)], of monodentate bicarbonate species (m-HCO3−), respectively.29–31 The intensity of these bands (i.e., TiO2−x sample) was much higher than that of P25 in the dark. However, the intensity of these bands in sample TiO2−x decreased immediately upon light irradiation. At the same time, the bands at around 1577 and 1396 cm−1, which were assigned to the νas(CO2) and νs(CO2) of the bidentate formate species (b-HCO2−), grew in intensity (Fig. S8d, ESI†).30–32 This indicated that CO2 molecules adsorbed on the surface of TiO2−x mainly as m-HCO3− and converted into b-HCO2−, which plays a key role in providing high photocatalytic activity as the intermediate species for CO photoreduction with water upon light irradiation.31,33 When the reaction temperature was increased to 80 °C, the intensity of the b-HCO2− bands continued to increase (Fig. S8f, ESI†). This indicated that the conversion of m-HCO3− into the b-HCO2− was enhanced at increased temperature. In other words, the operando DRIFT suggested that the desorption of CO was effective, allowing the subsequent adsorption of CO2 in the configuration of m-HCO3− on the surface of the photocatalyst as illustrated in the proposed reaction scheme (Scheme S1, ESI†). The pristine TiO2−x and TWxh samples also exhibited higher CO production when compared to the pristine W18O49. Hence, the synergistic effect of a core–shell structure in TiO2−x/W18O49 and the presence of Ti2+ and Ti3+ in the pristine TiO2−x and TW6h samples had enhanced the electronic properties of the TWxh samples (Fig. S7, ESI†), resulting in an enhancement in the photocatalytic reduction of CO2 under visible light irradiation (Scheme S2, ESI†).
In conclusion, core–shell and double-shelled hollow microspheres of TiO2−x/W18O49 were synthesized with different durations of solvothermal treatment. The TiO2−x extended the light absorption up to 500 nm when compared to commercial titania (P25), whereas W18O49 further enhanced the absorption to 500–650 nm. TiO2−x and TW6h samples exhibited superior photocatalytic reduction of CO2 compared to P25 and pristine W18O49. Overall, the microstructure of TiO2−x/W18O49 revealed a positive effect on CO2 photoreduction efficiency.
The authors acknowledge the financial support provided by the Engineering and Physical Sciences Research Council (EP/K021796/1) and the Research Centre for Carbon Solutions (RCCS) at Heriot-Watt University. The electron microscopy facility in the School of Chemistry, University of St. Andrews, which is supported by the EPSRC Capital for Great Technologies Grant EP/L017008/1, is acknowledged. In situ synchrotron-based PXRD was conducted at the Australian Synchrotron, Victoria, Australia. UK Catalysis Hub is kindly thanked for resources and support provided via the membership of the UK Catalysis Hub Consortium and funded by current EPSRC grants: EP/R026939/1 and EP/R026815/1. The authors would like to thank Dr June Callison and Dr Nitya Ramanan for their great help and support during DRIFTS experiments.
Conflicts of interest
There are no conflicts to declare.Notes and references
- N. S. Lewis, Science, 2016, 351, 6271 CrossRef.
- M. G. Walter, E. L. Warren, J. R. McKone, S. W. Boettcher, Q. Mi, E. A. Santori and N. S. Lewis, Chem. Rev., 2010, 110, 6446–6473 CrossRef.
- X. Chen, L. Liu and F. Huang, Chem. Soc. Rev., 2015, 44, 1861–1885 RSC.
- R. R. Hasiguti and E. Yagi, Phys. Rev. B: Condens. Matter Mater. Phys., 1994, 49, 7251–7256 CrossRef CAS.
- H. Lu, B. Zhao, R. Pan, J. Yao, J. Qiu, L. Luo and Y. Liu, RSC Adv., 2014, 4, 1128–1132 RSC.
- N. Liu, C. Schneider, D. Freitag, M. Hartmann, U. Venkatesan, J. Müller, E. Spiecker and P. Schmuki, Nano Lett., 2014, 14, 3309–3313 CrossRef CAS.
- J.-Y. Shin, J. H. Joo, D. Samuelis and J. Maier, Chem. Mater., 2012, 24, 543–551 CrossRef.
- J. Z. Y. Tan, F. Xia and M. M. Maroto-Valer, ChemSusChem, 2019, 5246–5252 CrossRef.
- J. Qi, X. Lai, J. Wang, H. Tang, H. Ren, Y. Yang, Q. Jin, L. Zhang, R. Yu, G. Ma, Z. Su, H. Zhao and D. Wang, Chem. Soc. Rev., 2015, 44, 6749–6773 RSC.
- D. Mao, J. Wan, J. Wang and D. Wang, Adv. Mater., 2019, 31, 1802874 CrossRef.
- J. Wang, J. Wan, N. Yang, Q. Li and D. Wang, Nat. Rev. Chem., 2020, 4, 159–168 CrossRef.
- D. Hong, L.-M. Lyu, K. Koga, Y. Shimoyama and Y. Kon, ACS Sustainable Chem. Eng., 2019, 7, 18955–18964 CrossRef CAS.
- Y. Su, H. Xu, J. Wang, X. Luo, Z.-l. Xu, K. Wang and W. Wang, Nano Res., 2019, 12, 625–630 CrossRef CAS.
- G. Xi, S. Ouyang, P. Li, J. Ye, Q. Ma, N. Su, H. Bai and C. Wang, Angew. Chem., Int. Ed., 2012, 51, 2395–2399 CrossRef CAS.
- F. Liu, X. Chen, Q. Xia, L. Tian and X. Chen, RSC Adv., 2015, 5, 77423–77428 RSC.
- B. Pal, B. L. Vijayan, S. G. Krishnan, M. Harilal, W. J. Basirun, A. Lowe, M. M. Yusoff and R. Jose, J. Alloys Compd., 2018, 740, 703–710 CrossRef CAS.
- H. Yoon, M. G. Mali, M.-w. Kim, S. S. Al-Deyab and S. S. Yoon, Catal. Today, 2016, 260, 89–94 CrossRef CAS.
- Y. Yang, S. Liao, W. Shi, Y. Wu, R. Zhang and S. Leng, RSC Adv., 2017, 7, 10885–10890 RSC.
- H. Cheng, B. Huang, Y. Liu, Z. Wang, X. Qin, X. Zhang and Y. Dai, Chem. Commun., 2012, 48, 9729–9731 RSC.
- S. K. Gupta, C. Reghukumar, M. Keskar and R. M. Kadam, J. Lumin., 2016, 177, 166–171 CrossRef.
- Z. Fang, S. Jiao, Y. Kang, G. Pang and S. Feng, ChemistryOpen, 2017, 6, 261–265 CrossRef.
- T. Lu, R. Zhang, C. Hu, F. Chen, S. Duo and Q. Hu, Phys. Chem. Chem. Phys., 2013, 15, 12963–12970 RSC.
- C. Dong, M. Xing and J. Zhang, J. Phys. Chem. Lett., 2016, 7, 2962–2966 CrossRef CAS.
- H. Huang, J. Lin, G. Zhu, Y. Weng, X. Wang, X. Fu and J. Long, Angew. Chem., Int. Ed., 2016, 55, 8314–8318 CrossRef CAS.
- C. J. Keturakis, F. Ni, M. Spicer, M. G. Beaver, H. S. Caram and I. E. Wachs, ChemSusChem, 2014, 7, 3459–3466 CrossRef CAS.
- H. Takano, Y. Kirihata, K. Izumiya, N. Kumagai, H. Habazaki and K. Hashimoto, Appl. Surf. Sci., 2016, 388, 653–663 CrossRef CAS.
- P. Deshlahra, B. Tiwari, G. H. Bernstein, L. E. Ocola and E. E. Wolf, Surf. Sci., 2010, 604, 79–83 CrossRef CAS.
- Y. Kato, M. Yamamoto, M. Akatsuka, R. Ito, A. Ozawa, Y. Kawaguchi, T. Tanabe and T. Yoshida, Surf. Interface Anal., 2019, 51, 40–45 CrossRef CAS.
- G. Busca and V. Lorenzelli, Mater. Chem., 1982, 7, 89–126 CrossRef CAS.
- S. E. Collins, M. A. Baltanás and A. L. Bonivardi, J. Catal., 2004, 226, 410–421 CrossRef CAS.
- H. Tsuneoka, K. Teramura, T. Shishido and T. Tanaka, J. Phys. Chem. C, 2010, 114, 8892–8898 CrossRef CAS.
- S. E. Collins, M. A. Baltanás and A. L. Bonivardi, J. Phys. Chem. B, 2006, 110, 5498–5507 CrossRef CAS.
- M. Yamamoto, T. Yoshida, N. Yamamoto, T. Nomoto, Y. Yamamoto, S. Yagi and H. Yoshida, J. Mater. Chem. A, 2015, 3, 16810–16816 RSC.
Footnote |
| † Electronic supplementary information (ESI) available: Experimental procedure, SEM and TEM images, laboratory and synchrotron PXRD patterns, Raman, XPS and PEC measurement results. See DOI: 10.1039/d0cc04036c |
| This journal is © The Royal Society of Chemistry 2020 |