 Open Access Article
Creative Commons Attribution 3.0 Unported Licence
Visual discrimination of aromatic acid substitution patterns by supramolecular nanocooperativity†
Mykola
Kravets
 a,
Grzegorz
Sobczak
 a,
Nazar
Rad
 a,
Iwona
Misztalewska-Turkowicz
 b,
Oksana
Danylyuk
 a and
Volodymyr
Sashuk
 *a
*a
aInstitute of Physical Chemistry of the Polish Academy of Sciences, Kasprzaka 44/52, 01-224 Warsaw, Poland. E-mail: vsashuk@ichf.edu.pl; Web: http://groups.ichf.edu.pl/sashuk
bUniversity of Bialystok, Faculty of Chemistry, Ciołkowskiego 1K, 15-245 Bialystok, Poland
First published on 17th June 2020
Abstract
Physicochemical and, in particular, visual recognition of positional isomers, due to their similar appearance and properties, is an extremely challenging task. Here we present an easy-to-prepare assay for the naked-eye differentiation of all possible isomers of phthalic acids. The desired optical response is attained through specific non-covalent interactions between the acids and a cationic macrocyclic host. These interactions are then translated to and amplified by gold nanoparticles which subsequently aggregate to various extents producing a color palette.
Phthalic acids are the simplest aromatic dicarboxylic acids and one of the most important chemical commodities.1 Phthalic acid (o-isomer) is utilized, among others, for the production of dyes, perfumes and pharmaceuticals. Isophthalic acid (m-isomer) is a component of firefighter's gear and astronaut space suits. Terephthalic acid (p-isomer) is most known for being a precursor for polyethylene terephthalate (PET). Their total global market size is expected to hit $100 billion in a few years. Such a large demand not only improves the quality of life but also creates serious environmental problems leading to the pollution of soil,2 air3 and water.4 Although the toxicity of these acids is generally low, continuous exposure may increase the risk of reproductive and developmental disorders in humans.5
Phthalic acids appear as colorless crystals with similar physicochemical properties. Therefore, their fast detection is greatly complicated. So far, electrochemical,6 colorimetric7,8 and fluorescent9–11 probes based on host–guest interactions were developed. However, most of them recognize only single isomers,6–10 and only one probe distinguishes two isomers among three.11 This shows that the typical supramolecular approach is inefficacious. Ideally, a color test with one probe for all isomers would be most useful and versatile.
Pillar[n]pyridiniums (PPs) are a new family of prismatically shaped oligocationic macrocycles, introduced by us recently, capable of recognizing anionic species including carboxylic acids.12,13 We noted that pillar[6]pyridinium (P6P), a mid-sized member of this class, although it has no preference in binding phthalic isomers, with one of them (terephthalic acid) undergoes aggregation.13 This strikingly differs it from the previous probes and was attributed to the opposite directionality of carboxylic groups that sewed the macrocycles into insoluble polymeric chains. Herein, we demonstrate that this phenomenon is more general and independent of the size of the macrocyclic cavity. Pillar[4]pyridinium (P4P), which is too small to accommodate any of these acids, induces the same effect. Moreover, when such a macrocycle is put on the gold nanoparticle surface, all three isomers can be visualized and recognized by the naked eye.
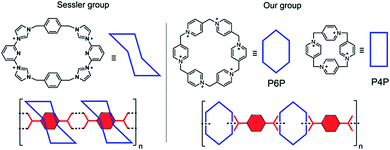
The precipitation of terephthalic acid upon complexation was first described by the Sessler group for an imidazolium based cationic macrocycle known as a Texas-sized box.14 However, the formation of a precipitate was observed only when terephthalic acid was in a monoprotonated form. This was accounted for by the entrance of the acid inside the macrocyclic cavity and the emergence of pseudo polyrotaxanes held by hydrogen bonds. In the case of P6P, this scenario is unlikely. First, the content of the monoprotonated form (pKa2 = 4.82) in our experiments (pH = 7.2) was far below 1 mol%. Second, NMR and DFT data suggested binding outside the P6P cavity. The only reasonable explanation for the observed behavior is the formation of sandwich-type complexes sustained by electrostatic interactions (Fig. 1).
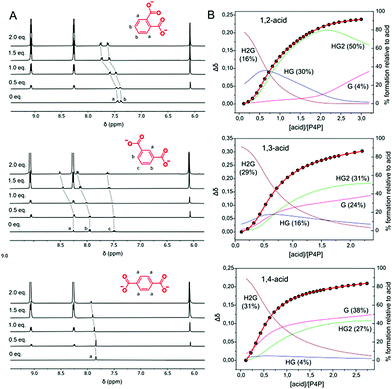
We hypothesized that P4P, due to its much smaller size, would bind in a similar fashion not only terephthalic acid but also phthalic and isophthalic acids. The experiments were carried out analogously as for P6P. The host (6.3 mM) and the guest (3.1 mM) solutions in water were buffered with Tris (50 mM, pH = 7.2) and mixed with each other. First, P4P solution was portionwise added to the acid solutions. The precipitation was observed only for terephthalic and isophthalic acids. In particular, it occurred heavily in the case of 1,4-isomer. For this acid, the precipitate formed for practically the whole range of molar ratios, whereas for 1,3-acid the precipitate became apparent only at the ratios close to equimolar. In parallel, the process was monitored by 1H NMR. In all cases, the aromatic signals of the acids shifted downfield, corroborating the complexation on the cavity periphery (Fig. 2). Then, the procedure was changed and P4P was titrated with the acids (Fig. S1–S3, ESI†). To avoid precipitation and precisely measure the binding strengths, the solutions were diluted (5-fold for 1,3-acid and almost 8-fold for 1,4-acid). When the titration points were plotted, sigmoid curves were obtained, indicating the effect of cooperativity (Fig. 2). The data were best fitted to a mixed 1![[thin space (1/6-em)]](https://www.rsc.org/images/entities/char_2009.gif) :
:![[thin space (1/6-em)]](https://www.rsc.org/images/entities/char_2009.gif) 1, 2
1, 2![[thin space (1/6-em)]](https://www.rsc.org/images/entities/char_2009.gif) :
:![[thin space (1/6-em)]](https://www.rsc.org/images/entities/char_2009.gif) 1 and 1
1 and 1![[thin space (1/6-em)]](https://www.rsc.org/images/entities/char_2009.gif) :
:![[thin space (1/6-em)]](https://www.rsc.org/images/entities/char_2009.gif) 2 binding model (for other models, see Fig. S4–S16, ESI†). The highest content of HG complex (30%) was observed for 1,2-acid, while the lowest (4%) for 1,4-acid. The dominant complex for 1,3-acid has a 1
2 binding model (for other models, see Fig. S4–S16, ESI†). The highest content of HG complex (30%) was observed for 1,2-acid, while the lowest (4%) for 1,4-acid. The dominant complex for 1,3-acid has a 1![[thin space (1/6-em)]](https://www.rsc.org/images/entities/char_2009.gif) :
:![[thin space (1/6-em)]](https://www.rsc.org/images/entities/char_2009.gif) 2 host–guest stoichiometry, whereas 1,4-acid prefers to assemble into a 2
2 host–guest stoichiometry, whereas 1,4-acid prefers to assemble into a 2![[thin space (1/6-em)]](https://www.rsc.org/images/entities/char_2009.gif) :
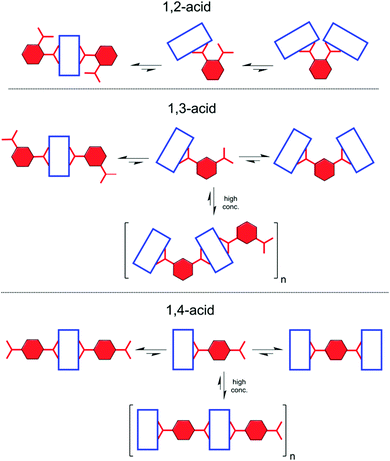
:![[thin space (1/6-em)]](https://www.rsc.org/images/entities/char_2009.gif) 1 complex (for detailed speciation, see Fig. 2B). Evidently, this is concerned with the directionality of the carboxylic acid groups. When the acid termini are opposite to each other (1,4-acid), there is almost no difference whether two hosts will connect to one guest, or vice versa. As a result, successive host–guest subunits join easily, especially at high concentrations, to a growing supramolecular chain, giving insoluble aggregates. When the angle between the anionic groups is shortening, steric constraints come into play. Whereas 1,3-acid is still prone to multiple connections, for 1,2-acid this possibility is lacking, resulting in no precipitate (Fig. 3).
1 complex (for detailed speciation, see Fig. 2B). Evidently, this is concerned with the directionality of the carboxylic acid groups. When the acid termini are opposite to each other (1,4-acid), there is almost no difference whether two hosts will connect to one guest, or vice versa. As a result, successive host–guest subunits join easily, especially at high concentrations, to a growing supramolecular chain, giving insoluble aggregates. When the angle between the anionic groups is shortening, steric constraints come into play. Whereas 1,3-acid is still prone to multiple connections, for 1,2-acid this possibility is lacking, resulting in no precipitate (Fig. 3).
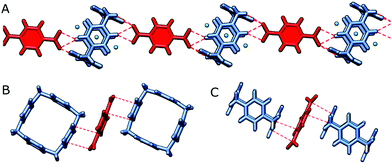
We have been fortunate to grow single crystals of P4P with 1,4-acid. The propensity of this acid to linear arrangement is also evident in the solid state (Fig. 4). The supramolecular chain composed of alternate tetracations and dianions is facilitated, besides pure electrostatic attraction, by charge-assisted hydrogen bonding of (C–H)+⋯O− type. Additional dianions satisfying electroneutrality of the supramolecular assembly are intercalated between outer skeletons of two neighbouring macrocycle in the crystal lattice.
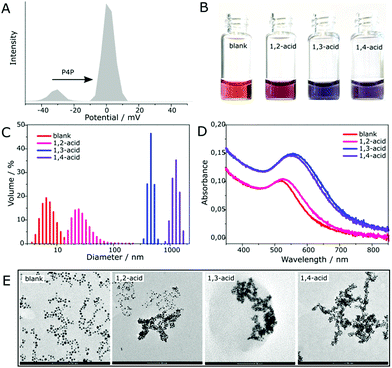
As observing the amount of precipitate formed or not formed is not a reliable means of qualitative assessment of an acid isomer responsible for it, we sought for an auxiliary that would transduce these changes into a more perceivable signal. Our attention was drawn to gold nanoparticles (AuNPs) which are characterized by a plethora of colors depending on their size and the connectivity between them.15 To realize the intended idea, we prepared a gold sol (0.75 mM, in terms of gold atoms) with a mean particle size of ca. 5 nm (Fig. S17, ESI†). The AuNPs in this sol bore a negative charge as being stabilized by anions left after the reduction of gold(III) chloride with a 5-fold excess of sodium borohydride. Addition of P4P to it (in a 4![[thin space (1/6-em)]](https://www.rsc.org/images/entities/char_2009.gif) :
:![[thin space (1/6-em)]](https://www.rsc.org/images/entities/char_2009.gif) 1 molar ratio) caused little changes in color appearance (final CAuNP = 0.69 mM), while zeta potential measurements revealed the inversion of charge (from −26 mV to +1 mV) (Fig. 5A). This indicated that the macrocycle efficiently docked on the NP surface and slightly destabilized the resulting colloid. The AuNPs were, however, stable for the next 24 h, which was sufficient to carry out all the planned experiments. The colloidal solution was then divided into 300 μL portions. To each one was added a single isomer (in the form of sodium salt, 5 mM, 140 μL). Accordingly, the blank solution was diluted with the same volume of pure water. The color change occurred almost instantaneously (Fig. S17, ESI†). As time elapsed, the differences became more pronounced. After 1 h, all of the solutions had different fades of purple – pink (1,2-isomer), blue (1,3-isomer) and violet (1,4-isomer) (Fig. 5B). The next day, the acid-containing samples turned grey as the nanoparticles aggregated. DLS measurements showed that during the initial period the average hydrodynamic size of the particles in the solution was increased from 7 nm (blank) to 30 nm (1,2-isomer), 460 nm (1,3-isomer) and 1270 nm (1,4-isomer), correspondingly (Fig. 5C). This was supported by TEM images (Fig. 5E) in which partially aggregated NPs for 1,2-acid, and fully aggregated NPs for 1,3- and 1,4-acids are seen (for SEM pictures showing the actual scale of aggregation see Fig. S20 and S21, ESI†). Moreover, the latter exhibits clear worm-like topology. That is, the way the NPs aggregate is the same as P4P binds the acids in the solution. The only discrepancy was the color matching of the samples to the size of the aggregated NPs. Blue, which is usually an indication of the most aggregated state, appeared in the sample (1,3-acid), where the aggregation was mediocre. UV-vis spectra revealed that the colors correspond to the interparticle distance in the aggregates rather than to their size (Fig. 5D). According to plasmon ruler,16–18 with decreasing the distance between NPs, their absorption intensity increases, while the absorption band shifts towards the red region, which manifests in the reflectance mode as blue. It follows that the aggregated NPs are located closest in the presence of 1,3-isomer (λmax = 556 nm), at a slightly longer distance when mixed with 1,4-acid (λmax = 551 nm), and the most distant in the presence of 1,2-acid (λmax = 528 nm). For comparison, dispersed NPs have λmax = 517 nm.
1 molar ratio) caused little changes in color appearance (final CAuNP = 0.69 mM), while zeta potential measurements revealed the inversion of charge (from −26 mV to +1 mV) (Fig. 5A). This indicated that the macrocycle efficiently docked on the NP surface and slightly destabilized the resulting colloid. The AuNPs were, however, stable for the next 24 h, which was sufficient to carry out all the planned experiments. The colloidal solution was then divided into 300 μL portions. To each one was added a single isomer (in the form of sodium salt, 5 mM, 140 μL). Accordingly, the blank solution was diluted with the same volume of pure water. The color change occurred almost instantaneously (Fig. S17, ESI†). As time elapsed, the differences became more pronounced. After 1 h, all of the solutions had different fades of purple – pink (1,2-isomer), blue (1,3-isomer) and violet (1,4-isomer) (Fig. 5B). The next day, the acid-containing samples turned grey as the nanoparticles aggregated. DLS measurements showed that during the initial period the average hydrodynamic size of the particles in the solution was increased from 7 nm (blank) to 30 nm (1,2-isomer), 460 nm (1,3-isomer) and 1270 nm (1,4-isomer), correspondingly (Fig. 5C). This was supported by TEM images (Fig. 5E) in which partially aggregated NPs for 1,2-acid, and fully aggregated NPs for 1,3- and 1,4-acids are seen (for SEM pictures showing the actual scale of aggregation see Fig. S20 and S21, ESI†). Moreover, the latter exhibits clear worm-like topology. That is, the way the NPs aggregate is the same as P4P binds the acids in the solution. The only discrepancy was the color matching of the samples to the size of the aggregated NPs. Blue, which is usually an indication of the most aggregated state, appeared in the sample (1,3-acid), where the aggregation was mediocre. UV-vis spectra revealed that the colors correspond to the interparticle distance in the aggregates rather than to their size (Fig. 5D). According to plasmon ruler,16–18 with decreasing the distance between NPs, their absorption intensity increases, while the absorption band shifts towards the red region, which manifests in the reflectance mode as blue. It follows that the aggregated NPs are located closest in the presence of 1,3-isomer (λmax = 556 nm), at a slightly longer distance when mixed with 1,4-acid (λmax = 551 nm), and the most distant in the presence of 1,2-acid (λmax = 528 nm). For comparison, dispersed NPs have λmax = 517 nm.
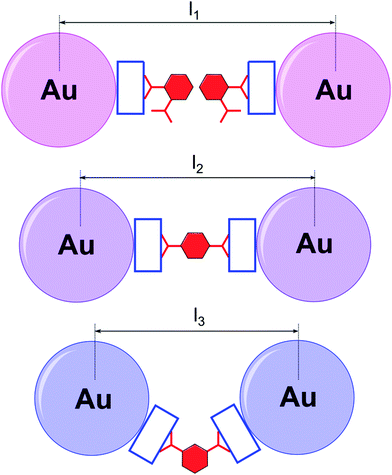
Based on this, a plausible mechanism of the aggregation is as follows (Fig. 6). The sample containing 1,2-isomer undergoes aggregation due to partial hydrophobization of the NP surface by pendant phenyl termini. Therefore, it is not as heavy as in the remaining samples, where supramolecular cross-linking takes place. The spacing between the aggregated NPs remains quite large as they are separated by two phenyl rings, and the final color does not differ much from red. When 1,3- and 1,4-isomers are employed, the NPs approach one another to a distance of a single acid molecule. Thus, the sharp change in the position of the adsorption band was observed. The difference in optical response stems from the geometry of the carboxylic groups. For the 1,3-isomer, the interparticle gap is a bit shorter, and therefore, the color of the aggregates is more bluish. The spacings calculated based on this mechanism correlate well with those determined from TEM images (Fig. S22–S24, ESI†). The measured surface-to-surface interparticle distance is 1.96 nm for 1,2-acid (calculated 2.09 nm), 1.70 nm for 1,4-acid (calculated 1.56 nm) and 1.29 nm for 1,3-acid (calculated 1.34 nm). The method we developed is very sensitive. The detection limit is about 5 × 10⁻⁵ M for 1,2-acid, 1 × 10⁻⁶ M for 1,3-acid, and 5 × 10⁻⁶ for 1,4-acid (Fig. S25–S27, ESI†). It is worth emphasizing that the NPs differentiate phthalic acids only when covered with P4P. Functionalization of the gold sol with a positively charged aliphatic thiol ligand (TMA) causes no changes in color appearance for any of these acids (Fig. S28–S33, ESI†). This indicates the important role of host–guest interactions in the NP self-assembly.
In summary, we developed a versatile supramolecular sensor for identifying substitution patterns in dicarboxylic aromatic acids. After integration of this sensor with gold nanoparticles, polychromatic visualization of the recognition process becomes possible. Our system definitely stands out from other similar sensing platforms, which usually distinguish only selected isomers or related chemical compounds.19–25 We ascribe this peculiarity to a tiny size of P4P, the smallest so far reported cationic box, which is the basic part of this system, and is able to adapt and interact with the carboxylic groups in different spatial arrangements. We foresee that the recognition potential of P4P can be applicable to other anionic groups as well as hydrocarbon scaffolds, which is the subject of ongoing research in our lab.
This work was financed by the National Science Centre of Poland (grant OPUS 12 no. 2016/23/B/ST5/02937). TEM pictures were taken in the Center of Synthesis and Analysis BioNanoTechno of University of Bialystok, and the equipment was funded by the EU as part of the Operational Program Development of Eastern Poland 2007–2013, project: POPW.01.03.00-20-034/09-00.
Conflicts of interest
There are no conflicts to declare.References
- P. M. Lorz, F. K. Towae, W. Enke, R. Jäckh, N. Bhargava and W. Hillesheim, Ullmann's Encyclopedia of Industrial Chemistry, 2007 Search PubMed.
- W. Tan, Y. Zhang, X. He, B. Xi, R. Gao, X. Mao, C. Huang, H. Zhang, D. Li, Q. Liang, D. Cui and A. N. Alshawabkeh, Sci. Rep., 2016, 6, 31987 CrossRef CAS PubMed.
- X. He, X. H. H. Huang, K. S. Chow, Q. Wang, T. Zhang, D. Wu and J. Z. Yu, ACS Earth Space Chem., 2018, 2, 147 CrossRef CAS.
- X. Liu, J. Shi, T. Bo, H. Zhang, W. Wu, Q. Chen and X. Zhan, Environ. Pollut., 2014, 184, 262 CrossRef CAS PubMed.
- M. Matsumoto, M. Hirata-Koizumi and M. Ema, Regul. Toxicol. Pharmacol., 2008, 50, 37 CrossRef CAS PubMed.
- J. Yoon, J. R. Jadhav, J. M. Kim, M. Cheong, H.-S. Kim and J. Kim, Chem. Commun., 2014, 50, 7670 RSC.
- Y.-P. Yen and K.-W. Ho, Tetrahedron Lett., 2006, 47, 7357 CrossRef CAS.
- A. Chatterjee, D. J. Oh, K. M. Kim, K.-S. Youk and K. H. Ahn, Chem. – Asian J., 2008, 3, 1962 CrossRef CAS PubMed.
- Z. Zhang, M. I. Hashim, C.-H. Wu, J. I. Wu and O. Š. Miljanić, Chem. Commun., 2018, 54, 11578 RSC.
- D.-B. Qin, F.-B. Xu, X.-J. Wan, Y.-J. Zhao and Z.-Z. Zhang, Tetrahedron Lett., 2006, 47, 5641 CrossRef CAS.
- W. Chen, C. Guo, Q. He, X. Chi, V. M. Lynch, Z. Zhang, J. Su, H. Tian and J. L. Sessler, J. Am. Chem. Soc., 2019, 141, 14798 CrossRef CAS PubMed.
- S. Kosiorek, B. Rosa, T. Boinski, H. Butkiewicz, M. P. Szymański, O. Danylyuk, A. Szumna and V. Sashuk, Chem. Commun., 2017, 53, 13320 RSC.
- S. Kosiorek, H. Butkiewicz, O. Danylyuk and V. Sashuk, Chem. Commun., 2018, 54, 6316 RSC.
- H.-Y. Gong, B. M. Rambo, E. Karnas, V. M. Lynch and J. L. Sessler, Nat. Chem., 2010, 2, 406 CrossRef CAS PubMed.
- S. K. Ghosh and T. Pal, Chem. Rev., 2007, 107, 4797 CrossRef CAS.
- K. H. Su, Q. H. Wei, X. Zhang, J. J. Mock, D. R. Smith and S. Schultz, Nano Lett., 2003, 3, 1087 CrossRef CAS.
- P. K. Jain, W. Huang and M. A. El-Sayed, Nano Lett., 2007, 7, 2080 CrossRef CAS.
- Q. L. Weichun Zhang and M. Qiu, Opt. Express, 2013, 21, 172 CrossRef PubMed.
- Y. Yao, Y. Zhou, J. Dai, S. Yue and M. Xue, Chem. Commun., 2014, 50, 869 RSC.
- H. Li, D.-X. Chen, Y.-L. Sun, Y. B. Zheng, L.-L. Tan, P. S. Weiss and Y.-W. Yang, J. Am. Chem. Soc., 2013, 135, 1570 CrossRef CAS PubMed.
- Y. Tauran, M. Grosso, A. Brioude, R. Kassab and A. W. Coleman, Chem. Commun., 2011, 47, 10013 RSC.
- X. Chen, S. G. Parker, G. Zou, W. Su and Q. Zhang, ACS Nano, 2010, 4, 6387 CrossRef CAS PubMed.
- C. Han, L. Zeng, H. Li and G. Xie, Sens. Actuators, B, 2009, 137, 704 CrossRef CAS.
- G. Patel and S. Menon, Chem. Commun., 2009, 3563 RSC.
- D. Xiong, M. Chen and H. Li, Chem. Commun., 2008, 880 RSC.
Footnote |
| † Electronic supplementary information (ESI) available: 1H NMR titration experiments, UV-Vis spectra, DLS data, SEM images, and photographs for TMA coated AuNPs. CCDC 1995776. For ESI and crystallographic data in CIF or other electronic format see DOI: 10.1039/d0cc03633a |
| This journal is © The Royal Society of Chemistry 2020 |

