
Reduction of carbon dioxide at a plasmonically active copper–silver cathode†
Elizabeth R.
Corson
 ab,
Ananya
Subramani
ab,
Jason K.
Cooper
b,
Robert
Kostecki
bc,
Jeffrey J.
Urban
bd and
Bryan D.
McCloskey
*abc
ab,
Ananya
Subramani
ab,
Jason K.
Cooper
b,
Robert
Kostecki
bc,
Jeffrey J.
Urban
bd and
Bryan D.
McCloskey
*abc
aDepartment of Chemical and Biomolecular Engineering, University of California, Berkeley, California 94720, USA. E-mail: bmcclosk@berkeley.edu
bJoint Center for Artificial Photosynthesis, Lawrence Berkeley National Laboratory, Berkeley, California 94720, USA
cEnergy Storage and Distributed Resources Division, Lawrence Berkeley National Laboratory, Berkeley, California 94720, USA
dThe Molecular Foundry, Lawrence Berkeley National Laboratory, Berkeley, California 94720, USA
First published on 23rd July 2020
Abstract
Electrochemically deposited copper nanostructures were coated with silver to create a plasmonically active cathode for carbon dioxide (CO2) reduction. Illumination with 365 nm light, close to the peak plasmon resonance of silver, selectively enhanced 5 of the 14 typically observed copper CO2 reduction products while simultaneously suppressing hydrogen evolution. At low overpotentials, carbon monoxide was promoted in the light and at high overpotentials ethylene, methane, formate, and allyl alcohol were enhanced upon illumination; generally C1 products and C2/C3 products containing a double carbon bond were selectively promoted under illumination. Temperature-dependent product analysis in the dark showed that local heating is not the cause of these selectivity changes. While the exact plasmonic mechanism is still unknown, these results demonstrate the potential for enhancing CO2 reduction selectivity at copper electrodes using plasmonics.
Carbon dioxide (CO2) reduction can prevent emission of CO2 into the atmosphere while simultaneously generating valuable products to be used as renewable fuels and chemical precursors. The key challenge in CO2 reduction is selectively producing multiple-carbon-containing compounds that have higher energy density or higher value than single carbon (C1) products like methane or carbon monoxide (CO). Copper (Cu) catalysts are well known for their ability to form many two- and three-carbon products (C2 and C3), but these products are formed concurrently and often with low faradaic efficiencies (FE).1
Recently we have explored the use of localized surface plasmon resonance (LSPR) in roughened or nanostructured silver (Ag) electrodes to address poor CO2 reduction selectivity.2,3 Nanostructured plasmonic metals exhibit peak plasmon resonance at a specific wavelength of light that can be tuned by changing the size, shape, and composition of the nanostructures.4 The LSPR can decay to form energetic electron–hole pairs and can generate strong local electric fields, both of which can interact with adsorbates at the cathode surface and influence electrochemical reactions.4,5 We have shown that an illuminated, plasmonically active Ag cathode enhances all CO2 reduction products, increasing the formation of CO, formate, and methanol while simultaneously suppressing undesired hydrogen (H2) evolution.2,3 Here we investigate a plasmonically active Cu–Ag cathode, combing nanostructured Cu, that has catalytic activity for multi-carbon-containing CO2 reduction products, with highly plasmonic Ag in an effort to create a more selective catalyst. We explore the changes in product distribution in the light and the dark and with temperature in a custom temperature-controlled photoelectrochemical cell6 to determine if the plasmonic activity of Ag combined with the catalytic properties of Cu can direct CO2 reduction towards the formation of select valuable products.
Cu nanocorals were electrochemically formed on the surface of a Ag foil following the procedure reported by Gurudayal et al., where a high current density results in the formation of H2 bubbles that define the nanofeature morphology.7,8 We selected the nanocoral morphology to study here given their sharp features that should serve to enhance the LSPR (Fig. 1B). Despite the bare Cu nanocorals having high optical absorbance across the visible spectrum (Fig. S1, ESI†), the photocurrent density was small (Fig. S4C, ESI†). To enhance the plasmonic photocurrent, 10 nm of Ag was deposited by electron-beam (e-beam) evaporation, forming the “cathode” (Fig. S5, ESI†). This was expected to improve the cathodic photocurrent because Ag has been theoretically shown to produce a bimodal distribution of high-energy electrons and holes, whereas Cu photoexcitation results in a hole-dominant energy distribution.9 Scanning electron microscopy (SEM) images show a heterogeneous coverage of Cu features ranging from 10 nm to 2 μm in size with no apparent change observed by SEM in the Cu features after 1 to 4 days of electrochemical experiments (Fig. 1C and Fig. S6, ESI†). The energy-dispersive X-ray spectroscopy (EDS) image in Fig. 1B shows the dominant Cu composition of the nanocorals and the tilted EDS image in Fig. S7E (ESI†) more clearly shows the 10 nm Ag layer. X-ray diffraction (XRD) indicates that both Ag and Cu are polycrystalline (Fig. S8, ESI†). X-ray photoelectron spectroscopy (XPS) shows a decrease in the ratio of Ag to Cu after 180 minutes of chronoamperometry (CA) at −1.0 VRHE (V vs. the reversible hydrogen electrode) (Fig. S9, ESI†).
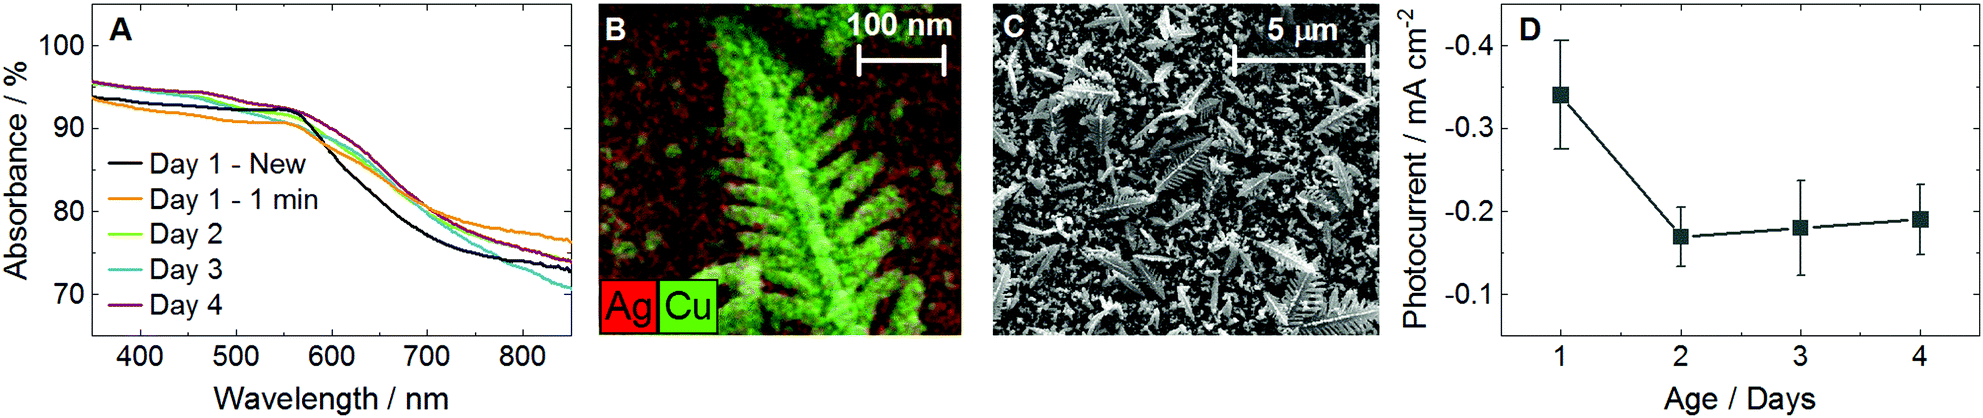 | ||
| Fig. 1 Characterization of the cathode stability. (A) UV-visible (UV-vis) absorbance of plasmonically active cathodes as-prepared, after 1 minute of chronoamperometry (CA) at −1.0 VRHE, and after 2, 3, and 4 days of electrochemical experiments. Different cathodes were measured for each day. (B) Energy-dispersive X-ray spectroscopy (EDS) of a nanocoral feature on the surface of the cathode after 3 days of electrochemical experiments. (C) Scanning electron microscopy (SEM) of the cathode surface after 4 days of electrochemical experiments. (D) Photocurrent over time during CA at −0.78 VRHE with 365 nm LED illumination at 170 mW cm−2. Error bars represent one standard deviation of experiments performed in triplicate. See Fig. S1–S3 for further UV-vis plots, Fig. S4 for more photocurrent plots, and Fig. S6 and S7 for additional SEM and EDS images (ESI†). | ||
The absorbance measured by UV-visible spectroscopy (UV-vis) showed a flattening of the observable plasmonic peak at 560 nm after just 1 minute of CA at −1.0 VRHE, but thereafter remained relatively constant over 4 days of electrolysis (Fig. 1A and Fig. S2, ESI†). While the peak at 560 nm matches the plasmon resonance of Cu, it was found that photocurrent measurements were maximized under 365 nm illumination, close to the plasmon resonance of Ag (Fig. S3, ESI†). Fig. S4D (ESI†) shows that the decreasing photocurrent density from 365 to 525 nm followed the absorbance trend measured by UV-vis, but where the absorbance only dropped by 2% in this range the photocurrent was diminished by 90%. Thus, all experiments in this study performed in the “light” were conducted with a 365 nm light-emitting diode (LED) at 170 mW cm−2. The peak photocurrent of a new cathode, −0.34 mA cm−2, decreased after exposure to electrolysis but stabilized over 4 days of use at −0.18 mA cm−2, nearly twice the peak photocurrent of bare Cu nanocorals, −0.10 mA cm−2 (Fig. 1D and Fig. S4C, ESI†). We observed that the gaseous product distribution at −0.8 VRHE in the dark and the light was constant over 3 days of electrolysis (Fig. S10, ESI†). From the XPS, photocurrent, UV-vis, and product distribution trends over time we conclude that the e-beam deposited Ag does initially reorganize during electrolysis but stabilizes in a structure that is distinct from, and more plasmonically active than, bare Cu nanocorals.
The product distribution was investigated from −0.6 to −1.0 VRHE under dark and light conditions at 22 °C in 0.1 M potassium bicarbonate (KHCO3) continuously sparged by CO2. 15 products were detected, but only 5 were selectively enhanced upon illumination. The FE of majority species (>1%) is shown in Fig. 2 with the corresponding partial current densities shown in Fig. S11 (ESI†). The FE and partial current densities of minority species can be found in Fig. S12 and S13 (ESI†). All detected products are listed in Table S1 (ESI†). Of the 14 products reported by Gurudayal et al. on bare Cu nanocorals,7 only ethylene glycol was not detected in this study. We measured two additional products, gycolaldehyde and acetone, which have previously been reported as CO2 reduction products on Cu foil.1 While there are variations in the dark product distribution between our study and that of Gurudayal et al.,7 the most notable difference is an increase in CO production, as expected from the addition of Ag.
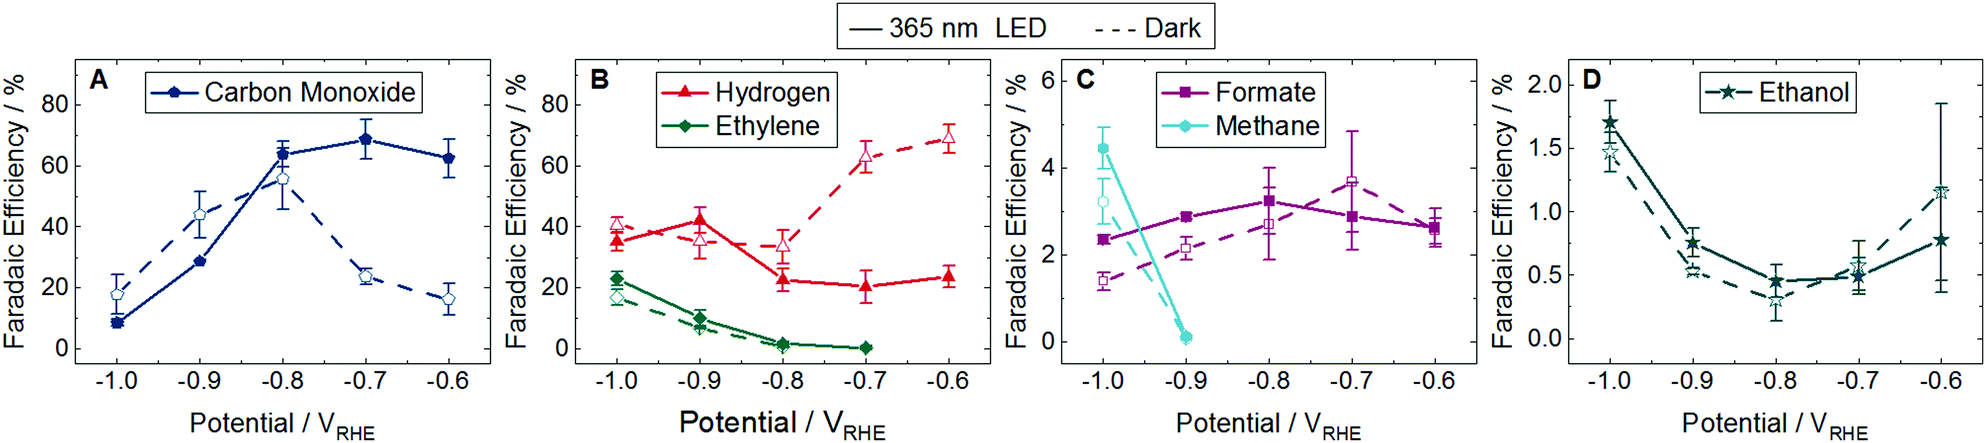 | ||
| Fig. 2 Faradaic efficiency (FE) of major products from −0.6 to −1.0 VRHE at 22 °C. Dashed lines with unfilled symbols show results performed in the dark and solid lines with filled symbols show results performed under continuous illumination using a 365 nm LED with an intensity of 170 mW cm−2. No points are plotted if the product was not detected. Products shown are (A) carbon monoxide, (B) hydrogen and ethylene, (C) formate and methane, and (D) ethanol. Fig. S11 in the ESI† shows the partial current densities for these major products. The FE and partial current densities of the minority products methanol, glycolaldehyde, acetaldehyde, ethane, hydroxyacetone, acetone, allyl alcohol, propionaldehyde, and n-propanol are shown in Fig. S12 and S13 in the ESI,† respectively. Error bars represent one standard deviation of experiments performed in triplicate. | ||
At low overpotentials (−0.6 and −0.7 VRHE) CO production was enhanced in the light and H2 was suppressed. While there was no difference in H2 production in the dark and light at high overpotentials (−0.8, −0.9, and −1.0 VRHE), a suppression of CO FE and partial current density was observed in the light at −0.9 and −1.0 VRHE. At these same potentials we find an enhancement of ethylene, methane, formate, and allyl alcohol. These CO, H2, and formate trends in the light are similar to those reported on a plasmonically active Ag cathode.3 However, where Creel et al.3 found that all CO2 reduction products were enhanced in the light, we find that the illuminated Cu–Ag cathode is only selective to 5 of the 14 CO2 reduction products.
CO is widely cited as an intermediate in the reaction pathway to ethylene and methane.10 While the exact reaction pathways of C3 products are unknown,1 it has been shown that CO can be reduced to propionaldehyde, n-propanol, and allyl alcohol.11,12 This consumption of CO to create further reduced products may account for the decrease in CO production in the light at these high overpotentials.
While 4 of the 5 major CO2 reduction species were influenced by the light, ethanol showed no difference between the light and the dark at any applied potential (Fig. 2D and Fig. S11D, ESI†). Many of the minority products were only produced at potentials cathodic to −1.0 VRHE and all but allyl alcohol have overlapping error bars, indicating no distinction between the light and the dark (Fig. S12 and S13, ESI†). Of the minority products, only methanol was detected at every applied potential investigated. There was no difference between methanol results in the light and the dark, and the FE remained below 0.15%. This is in contrast to the results on a plasmonically active Ag cathode, where methanol was only formed in the light at up to 2% FE.3
Chemical groupings reveal some trends in the selectivity of CO2 reduction products. C1 products (CO, formate, and methane) are generally enhanced in the light, with the exception of methanol. Of C2 products, only ethylene production is promoted in the light while no significant change is observed in ethanol, glycolaldehyde, acetaldehyde, or ethane. Of C3 products, only allyl alcohol showed a significant increase in the light, with no difference measured between the light and the dark for propionaldehyde, acetone, n-propanol, or hydroxyacetone.
We also look for trends by functional groups. Alkanes show mixed results with methane enhanced in the light but no change for ethane. The only alkene, ethylene, is promoted in the light. The primary alcohols—methanol, ethanol, and n-propanol—showed no difference between light and dark, but allyl alcohol, which has a double carbon bond like ethylene, was enhanced in the light. No aldehydes were influenced by the light (glycolaldehyde, acetaldehyde, and propionaldehyde). Finally, ketones experienced no difference between the light and the dark, namely acetone and hydroxyacetone, which also have a hydroxyl functional group like the alcohols.
It is possible for plasmons to decay into phonons, resulting in localized heating that can influence product selectivity.5 To determine if localized heating was a contributing factor, we measured the product distribution at −0.6 and −1.0 VRHE in the dark at 14, 22, and 35 °C in otherwise identical conditions. The FE of majority species are shown in Fig. 3 with the corresponding partial current densities shown in Fig. S14 (ESI†). The FE and partial current densities of minority species can be found in Fig. S15 and S16 (ESI†). At −0.6 VRHE CO production in dark conditions showed no trends with temperature (Fig. 3A), as opposed to the increase in CO FE in the light (Fig. 2A). H2 formation at −0.6 VRHE increased with increasing temperature (Fig. 3B), opposite of the decrease in H2 production observed in the light (Fig. 2B). At −1.0 VRHE CO production increased with increasing temperature (Fig. 3A), in direct contrast with the decrease in CO observed in the light (Fig. 2A). Similarly, the production of ethylene, methane, formate, and allyl alcohol decreased with increasing temperature at −1.0 VRHE (Fig. 3B, C, and Fig. S15G, ESI†), the opposite trend observed in the light (Fig. 2B, C, and Fig. S12G, ESI†). Because the product distribution changes caused by the light do not match the product selectivity at elevated temperatures, we conclude that localized heating from plasmon decay is not contributing to the enhancement of CO2 reduction in the light.
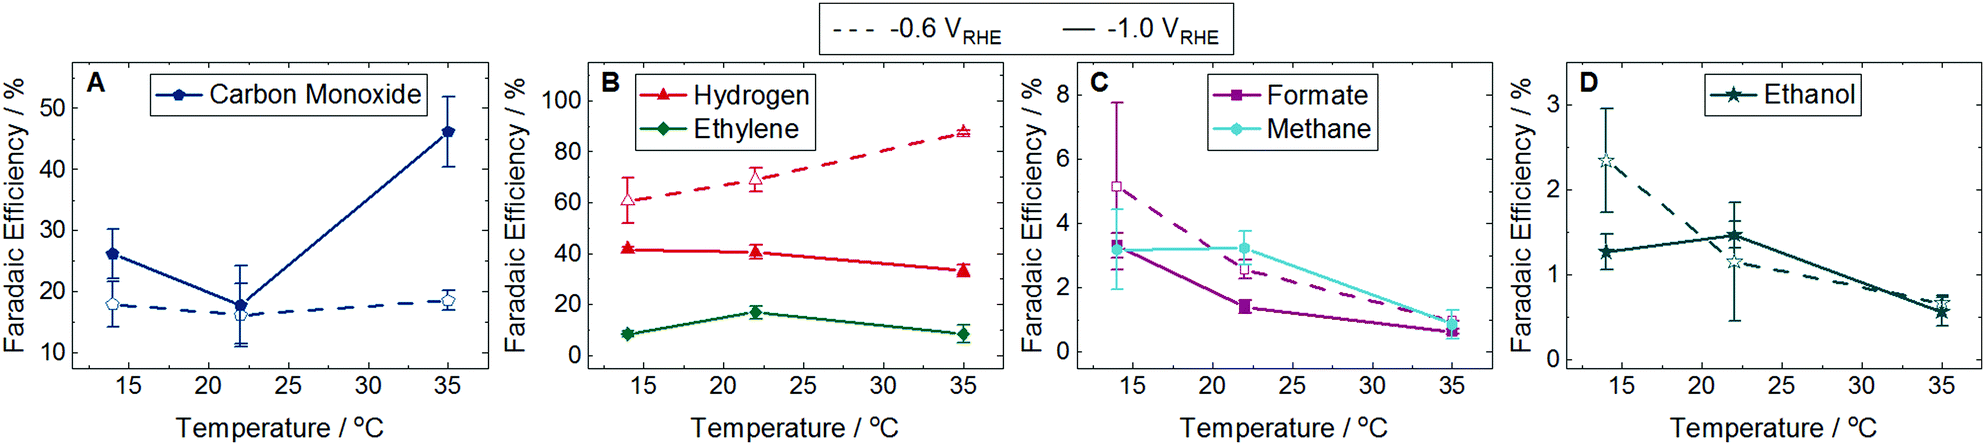 | ||
| Fig. 3 Faradaic efficiency (FE) of major products at 14, 22, and 35 °C in the dark. Dashed lines with unfilled symbols show results performed at −0.6 VRHE and solid lines with filled symbols show results performed at −1.0 VRHE. Products shown are (A) carbon monoxide, (B) hydrogen and ethylene, (C) formate and methane, and (D) ethanol. Fig. S14 in the ESI† shows the partial current densities for these major products. Ethylene and methane were not detected at any temperature at −0.6 VRHE. The FE and partial current densities of the minority products methanol, glycolaldehyde, acetaldehyde, ethane, hydroxyacetone, acetone, allyl alcohol, propionaldehyde, and n-propanol are shown in Fig. S15 and S16 in the ESI,† respectively. Error bars represent one standard deviation of experiments performed in triplicate. | ||
In addition, we measured the photocurrent at different intensities of 365 nm LED illumination while applying −0.78 VRHE during normal CO2 reduction conditions (Fig. S4E, ESI†). The photocurrent increased linearly with increasing light intensity which, because we would expect an exponential dependence in the case of heating, further demonstrates an athermal plasmonic mechanism.13
Other possible plasmonic mechanisms include a permanent or temporary hot electron transfer to an unoccupied molecular orbital (MO) of an adsorbate, or an enhancement of the local electric field (Fig. S18, ESI†).4,5 In prior work using in situ infrared spectroscopy at a plasmonically active Ag cathode we showed that the increase in CO production at low overpotentials was likely due to an enhanced desorption of CO in the light.14 This can be understood through a desorption induced by electronic transitions (DIET) mechanism, where an excited metal–CO complex gains enough energy to overcome the activation barrier for desorption before the hot electron decays back to the metal.4 Because the CO selectivity trends in the light are very similar on this Cu–Ag cathode, it is possible that this DIET mechanism also explains the enhanced CO production in the light at −0.6 and −0.7 VRHE. In the same study we found that light increased the bond strength of bicarbonate (HCO3−) at the surface, likely as a result of the enhanced local electric field.14 This would cause an increase in the local pH, depleting the concentration of protons at the surface and thus suppressing H2 evolution.15 Again, because H2 evolution is also suppressed in the light on this Cu–Ag cathode, the same local electric field mechanism may account for this behavior. However, there is not enough experimental evidence at this time to conclusively determine the plasmonic mechanism influencing CO or H2 selectivity.
This additional increase in the local pH in the light may explain the results observed at low overpotentials, but it cannot account for the behavior at high overpotentials. Hori et al. showed that in higher pH environments methane formation is suppressed and ethylene production is enhanced.16 However, we find that both ethylene and methane are enhanced in the light at −1.0 VRHE. Because formate, methane, and ethylene represent branching pathways in the CO2 reduction reaction, it is likewise difficult to pinpoint a common reaction intermediate that may be selectively accepting a hot electron.10,16
In conclusion, we combined nanostructured Cu with Ag to create a plasmonically active cathode that was stable over multiple days of use. Where a Ag cathode enhanced all CO2 reduction products in the light,3 this Cu–Ag cathode is selective to 5 of 14 CO2 reduction products upon illumination while simultaneously suppressing H2 evolution, compared to similar results in the dark. At higher overpotentials this Cu–Ag catalyst enhances ethylene, methane, formate, and allyl alcohol in the light; generally C1 products and C2/C3 species with a double carbon bond. A temperature-dependent study showed that product selectivity trends at elevated temperatures are exactly opposite of the behavior we observe upon illumination. In addition, the photocurrent was found to increase linearly with increasing light intensity. From these results we can conclusively state that local heating is not the cause of the selectivity changes in the light, although the exact plasmonic mechanism is still unknown.
This enhancement of select CO2 reduction products on Cu is a promising demonstration of the potential for plasmon-enhanced electrochemical conversion. With more investigation into the plasmonic mechanisms that influence product selectivity, we can begin to tune plasmonic properties through nanostructure size, shape, and composition to develop a highly selective, plasmonically active catalyst for CO2 reduction.
This work was supported by the National Science Foundation (NSF), Grant No. CBET-1653430. Work was performed at the Joint Center for Artificial Photosynthesis, a DOE Energy Innovation Hub, supported through the Office of Science of the U.S. Department of Energy, Award No. DE-SC0004993. Work at the Molecular Foundry was supported by the Office of Science, Office of Basic Energy Sciences of the U.S. Department of Energy, Contract No. DE-AC02-05CH11231. E. R. C. received support from the NSF Graduate Research Fellowship, Grant No. DGE 1106400.
Conflicts of interest
There are no conflicts to declare.References
- K. P. Kuhl, E. R. Cave, D. N. Abram and T. F. Jaramillo, Energy Environ. Sci., 2012, 5, 7050–7059 RSC
.
- Y. Kim, E. B. Creel, E. R. Corson, B. D. McCloskey, J. J. Urban and R. Kostecki, Adv. Energy Mater., 2018, 8, 1800363 CrossRef
- E. B. Creel, E. R. Corson, J. Eichhorn, R. Kostecki, J. J. Urban and B. D. McCloskey, ACS Energy Lett., 2019, 4, 1098–1105 CrossRef CAS
- S. Linic, P. Christopher and D. B. Ingram, Nat. Mater., 2011, 10, 911–921 CrossRef CAS PubMed
- S. Linic, U. Aslam, C. Boerigter and M. Morabito, Nat. Mater., 2015, 14, 567–576 CrossRef CAS PubMed
- E. R. Corson, E. B. Creel, Y. Kim, J. J. Urban, R. Kostecki and B. D. McCloskey, Rev. Sci. Instrum., 2018, 89, 055112 CrossRef PubMed
- Gurudayal, J. Bullock, D. F. Srankó, C. M. Towle, Y. Lum, M. Hettick, M. C. Scott, A. Javey and J. Ager, Energy Environ. Sci., 2017, 10, 2222–2230 RSC
- Gurudayal, J. W. Beeman, J. Bullock, H. Wang, J. Eichhorn, C. Towle, A. Javey, F. M. Toma, N. Mathews and J. W. Ager, Energy Environ. Sci., 2019, 12, 1068–1077 RSC
- R. Sundararaman, P. Narang, A. S. Jermyn, W. A. Goddard and H. A. Atwater, Nat. Commun., 2014, 5, 5788 CrossRef CAS PubMed
- R. Kortlever, J. Shen, K. J. Schouten, F. Calle-Vallejo and M. T. M. Koper, J. Phys. Chem. Lett., 2015, 6, 4073–4082 CrossRef CAS PubMed
- Y. Hori, R. Takahashi, Y. Yoshinami and A. Murata, J. Phys. Chem. B, 1997, 101, 7075–7081 CrossRef CAS
- E. Perez-Gallent, G. Marcandalli, M. C. Figueiredo, F. Calle-Vallejo and M. T. M. Koper, J. Am. Chem. Soc., 2017, 139, 16412–16419 CrossRef CAS PubMed
- S. Mukherjee, L. Zhou, A. M. Goodman, N. Large, C. Ayala-Orozco, Y. Zhang, P. Nordlander and N. J. Halas, J. Am. Chem. Soc., 2014, 136, 64–67 CrossRef CAS PubMed
- E. R. Corson, R. Kas, R. Kostecki, J. J. Urban, W. A. Smith, B. D. McCloskey and R. Kortlever, J. Am. Chem. Soc., 2020, 142, 11750–11762 CrossRef CAS PubMed
- Y. Yoon, A. S. Hall and Y. Surendranath, Angew. Chem., Int. Ed., 2016, 55, 15282–15286 CrossRef CAS PubMed
- Y. Hori, A. Murata and R. Takahashi, J. Chem. Soc., 1989, 2309–2326 CAS
Footnote |
| † Electronic supplementary information (ESI) available: Cathode fabrication and characterization through SEM, EDS, XPS, XRD, and UV-vis; electrochemical techniques; photocurrent measurements; product analysis through GC and NMR. See DOI: 10.1039/d0cc03215h |
| This journal is © The Royal Society of Chemistry 2020 |