
Surprisingly big linker-dependence of activity and selectivity in CO2 reduction by an iridium(I) pincer complex†
Gongfang
Hu‡
 ab,
Jianbing “Jimmy”
Jiang‡
*c,
H. Ray
Kelly
ab,
Adam J.
Matula
ab,
Yueshen
Wu
ab,
Neyen
Romano
ab,
Brandon Q.
Mercado
a,
Hailiang
Wang
*ab,
Victor S.
Batista
*ab,
Robert H.
Crabtree
ab and
Gary W.
Brudvig
*ab
ab,
Jianbing “Jimmy”
Jiang‡
*c,
H. Ray
Kelly
ab,
Adam J.
Matula
ab,
Yueshen
Wu
ab,
Neyen
Romano
ab,
Brandon Q.
Mercado
a,
Hailiang
Wang
*ab,
Victor S.
Batista
*ab,
Robert H.
Crabtree
ab and
Gary W.
Brudvig
*ab
aDepartment of Chemistry, Yale University, New Haven, Connecticut 06520, USA. E-mail: victor.batista@yale.edu; hailiang.wang@yale.edu; gary.brudvig@yale.edu
bEnergy Sciences Institute, Yale University, West Haven, Connecticut 06516, USA
cDepartment of Chemistry, University of Cincinnati, P.O. Box 210172, Cincinnati, Ohio 45221-0172, USA. E-mail: jianbing.jiang@uc.edu
First published on 2nd July 2020
Abstract
Here, we report the quantitative electroreduction of CO2 to CO by a PNP-pincer iridium(I) complex bearing amino linkers in DMF/water. The electrocatalytic properties greatly depend on the choice of linker within the ligand. The complex 3-N is far superior to the analogues with methylene and oxygen linkers, showing higher activity and better selectivity for CO2 over proton reduction.
The electroreduction of CO2 to CO provides a pathway for conversion of electrical energy from renewable sources into liquid fuels and useful organic chemicals.1–6 Despite notable progress in the development of several efficient CO2 reduction catalysts (metals, metal oxides, organometallic complexes, and main-group compounds),1–5,7–15 it remains challenging to improve the rate and selectivity of multielectron reduction reactions at low overpotentials.
Iridium complexes have been widely studied as efficient catalysts for the production of formate16–20 and oxalate,21,22 including a reported PNP-pincer Ir(III) complex 1 (Chart 1) for electrocatalytic CO2 reduction to formate in acetonitrile/water,23 an iridium trihydride complex 2 (Chart 1) for CO2 conversion to formate,24 and an Ir(III) hydride that gives predominant CO formation with 5–10% formate production.18 However, to the best of our knowledge, an Ir catalyst for quantitative CO2-to-CO conversion has yet to be discovered. Here, we report a selective CO2-to-CO electroreduction by a molecular Ir complex, without any detectable production of formate, or H2.
 | ||
| Chart 1 Iridium complexes for CO2 reduction studied before and here. | ||
We observed surprising and unanticipated25 differences in the catalytic selectivities for CO2 electroconversion in the series of Ir(I) carbonyl pincer complexes 3-N, 3-C, and 3-O (Chart 1). We find that the amino-linked 3-N complex electrocatalytically reduces CO2 to CO with 98% faradaic efficiency and a current density of 5.9 mA cm−2 at −1.9 V vs. Ag/AgCl, without any significant production of formate or H2. However, the observed selectivity of CO over H2 evolution diminishes to ∼50% when the NH linkers are replaced by CH2 groups (3-C). The oxygen linked complex 3-O has drastically lower catalytic activity, we therefore analysed the origin of this unexpected variation in product selectivity at the density functional theory (DFT) level.
The preparation and characterization of complex 3-C was previously reported,26 while 3-N and 3-O were synthesized by cyclometallation of the corresponding pincer ligands with [IrCl(COE)2]2 and [Ir(COE)2(acetone)2]PF6 (COE = cyclooctene),27 respectively, followed by ligand exchange with CO (Scheme S1, ESI†). The successful substitution of COE by CO was confirmed by the disappearance of the aliphatic protons of the COE ligand in the 1H NMR spectrum and the appearance of IR bands at 1962 cm−1 and 1980 cm−1. From the X-ray structure of 3-N, the Ir lies out of the P,N,P plane by a mere 0.0186(12) Å; for 3-O the metal lies in the plane and has a square planar coordination geometry (Fig. S2, ESI†).
The electrochemical properties of the complexes were investigated using cyclic voltammetry (CV) in aqueous DMF (5 M H2O) with glassy carbon as the working electrode and 0.1 M [nBu4N][PF6] as the supporting electrolyte. Under argon, the CV of 3-N shows the first irreversible reduction peak at −1.91 V, and the second at −2.39 V (Fig. 1A and Fig. S3, ESI†). All potentials are listed versus Ag/AgCl (see ESI†). DFT calculations predicted successive one-electron reductions at −1.93 V and −2.39 V vs. Ag/AgCl, in excellent agreement with our measurements (Fig. S4, ESI†). The plots of peak current versus square root of the scan rate are linear, as expected for a diffusion-controlled process (inset in Fig. S5, ESI†).
 | ||
| Fig. 1 CV scans of 0.5 mM solutions of 3-N (A), 3-C (B), and 3-O (C) in DMF under argon (black), CO2 (blue), and CO2 with 5 M H2O (red). | ||
Catalytic CO2 electroreduction of 3-N was identified by comparing CV measurements in DMF under Ar with those under CO2 both with and without 5 M water as the proton source. Fig. 1 shows the normalized current icat/ip, where ip is the peak current for the first reduction for each species under argon, and icat is the measured catalytic current. In CO2-saturated dry DMF, a cathodic current increase is observed at (icat/ip = 4.3),28 along with a 100 mV cathodic shift of the peak potential to −2.01 V (Fig. 1A, blue). The cathodic shift in the reduction potential indicates substrate binding to 3-N. Further CV measurements in the presence of CO2 and water (5 M) afforded a significant catalytic current (icat/ip = 8.7), corresponding to CO2 reduction (Fig. 1A, red). The overpotential was estimated to be 0.86 V, using the half-wave potential (−1.89 V vs. Ag/AgCl) and the thermodynamic potential for CO2-to-CO conversion in DMF/H2O mixture from the literature29,30 (see ESI†). Attempts at determining the observed rate constant kobs and turnover frequency through foot-of-the-wave analysis29,31,32 resulted in plots with significant nonlinearity (Fig. S6, ESI†). We defer mechanistic work to the full paper, but this could possibly indicate a mechanism with electron transfer followed by a chemical step (ECEC), with a rapid first chemical step for CO2 reduction.33,34 No catalytic current independent of scan rate could be measured under CO2-saturated DMF/H2O mixture. Further insight was gained through CV measurements of 3-N under various concentrations of CO2 and water. Under pseudo-first-order conditions, 3-N displays a first-order dependence on CO2 concentration but exhibits deviation from linearity at lower concentrations, presumably as a result of local depletion of CO2 (Fig. S7, ESI†). A pseudo-first-order dependence was observed for 3-N upon variation of the water concentration (Fig. S8, ESI†).
Conversely, 3-C and 3-O showed irreversible but more anodic reduction potentials under argon, at −1.57 V (Fig. 1B and Fig. S9, ESI†) and −1.44 V (Fig. 1C and Fig. S10, ESI†), respectively. No significant current increase was observed for either complex in the presence of CO2, with or without water at their first reduction potentials, indicating a far lower catalytic activity.
Controlled-potential electrolysis (CPE) of the three complexes at various potentials was performed for electrochemical CO2 reduction in DMF with 5 M water, using high-surface-area carbon fibre paper as the working electrode. At all relevant potentials, only CO and H2 were detected with no liquid products (Fig. S11, ESI†). The faradaic efficiency for CO and total current density of 3-N at various potentials are shown in Fig. 2A. More negative potentials led to higher CO faradaic efficiencies and total current densities. The highest faradaic efficiency for CO of 98% was achieved at −2.00 V, where the total current density was 7.8 mA cm−2. The lowest potential with a similarly high CO faradaic efficiency (−1.90 V) was selected for long-term CPE. High CO faradaic efficiency (98%) and total current density (5.8 mA cm−2) were maintained for over 67 hours (Fig. 2D), demonstrating the excellent stability of catalyst 3-N. Complex 3-C exhibited activity for CO2 reduction (∼3.8 mA cm−2) at −1.70 V. However, H2 evolution was significant for 3-C, resulting in an approximately 1![[thin space (1/6-em)]](https://www.rsc.org/images/entities/char_2009.gif) :1 mixture of CO/H2 from −1.70 to −2.00 V (Fig. 2B). CPE using 3-O under the same electrocatalytic conditions showed little catalytic activity for either CO2 or H+ reduction (Fig. 2C). The smaller current density (∼1.8 mA cm−2 at −2.00 V) and low CO production efficiency (<25%) are consistent with the background activity generated by the carbon paper working electrode.35
:1 mixture of CO/H2 from −1.70 to −2.00 V (Fig. 2B). CPE using 3-O under the same electrocatalytic conditions showed little catalytic activity for either CO2 or H+ reduction (Fig. 2C). The smaller current density (∼1.8 mA cm−2 at −2.00 V) and low CO production efficiency (<25%) are consistent with the background activity generated by the carbon paper working electrode.35
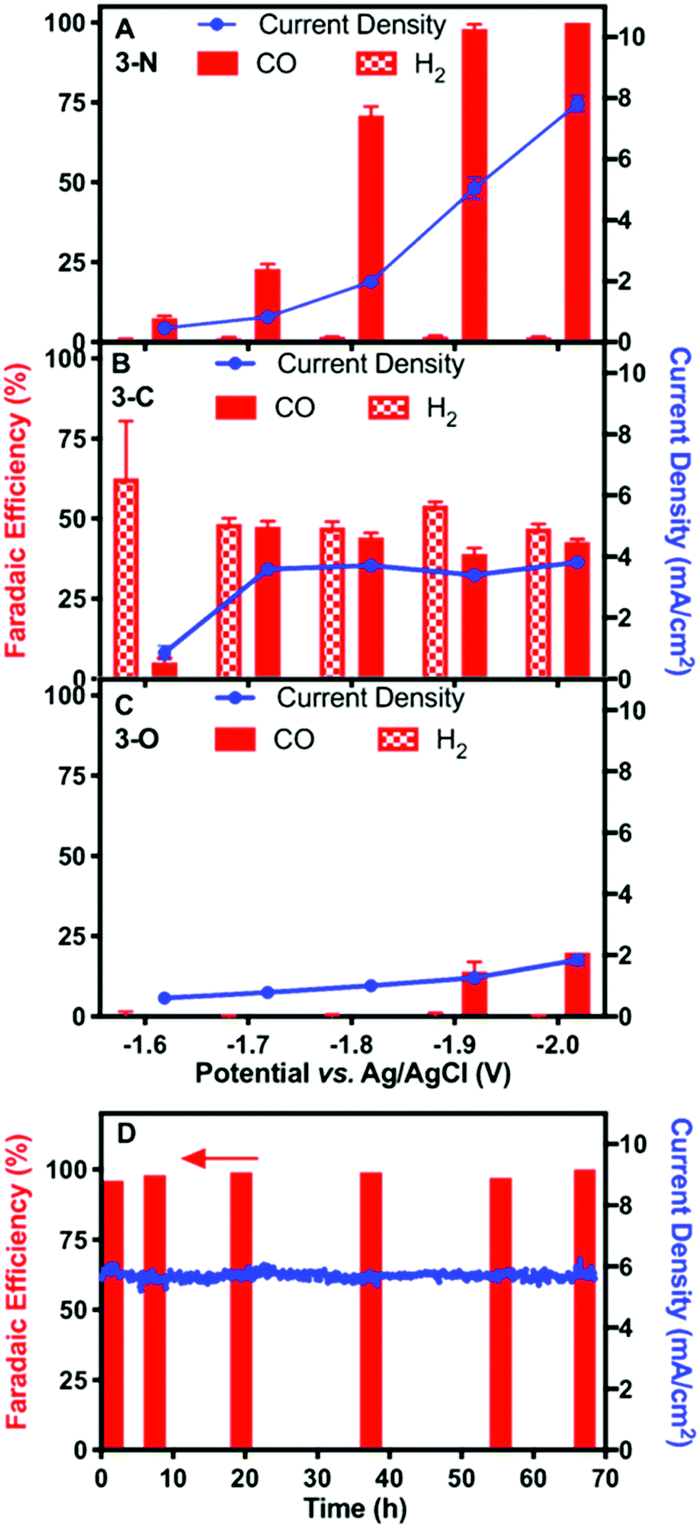 | ||
| Fig. 2 CO and H2 faradaic efficiencies and total current densities at various potentials for complexes 3-N (A), 3-C (B), and 3-O (C) at a concentration of 0.5 mM in DMF with 5 M water. Error bars represent standard errors from three successive measurements at the same potentials. (D) CO faradaic efficiencies after 2, 6, 20, 37, 55, and 67 hours and total current density during CPE of 3-N at −1.90 V. Electrolyses were performed using a carbon paper electrode with a 1 cm2 geometric area as the working electrode. | ||
UV-Vis spectra of the electrolyte solutions were recorded before and after electrolysis (Fig. S13 and S14, ESI†) to confirm that molecular integrity of complex 3-N is retained and that no metal dissociation occurred during CPE. The two spectra are nearly identical, indicating that ligand degradation and demetallation are insignificant during CPE. Scanning Electron Microscopy (SEM), Energy Dispersive X-ray Spectroscopy (EDS) and X-ray Photoelectron Spectroscopy (XPS) were performed on the carbon fibre paper after CPE (Fig. S15–S17, ESI†). The absence of an iridium signal in either the EDS or XPS spectra suggests no significant iridium demetallation at the carbon electrode. The carbon electrode of 3-N was gently washed with DMF after CPE and used again as the working electrode in a fresh electrolyte solution (DMF with 5 M water) without 3-N. No CO2 reduction product was detected, further confirming that the active species for CO2 reduction is homogeneous 3-N, rather than its heterogenized form, or deposited iridium metal.
The electronic properties of the three complexes, before and after reduction, were analysed by DFT calculations that provided insights into the origin of the unexpected changes in catalytic activity and selectivity induced by the change of linker. The calculations reproduced the experimental trends in carbonyl stretching frequencies (Table S2, ESI†) and the reduction potentials for the three complexes (Table S3, ESI†). The calculated one-electron reduction potentials, −1.93 V for 3-N, −1.81 V for 3-C, and −1.67 V for 3-O, are in good agreement with the experimental potentials. As expected, the trend in reduction potentials correlates with the relative LUMO energies of the three complexes, with higher energy LUMOs corresponding to more negative reduction potentials (Fig. 3). A relationship between LUMO energies and electron affinity follows from Koopmans’ theorem,36 and a linear correlation between DFT LUMO energies and reduction potentials has previously been demonstrated.37 For all three complexes, the HOMOs are centred on the Ir, while the LUMOs are delocalized over the ligand and metal centre (Fig. S21, ESI†). The LUMO of 3-N has more Ir character, suggesting that the reduction is predominantly centred on the metal.
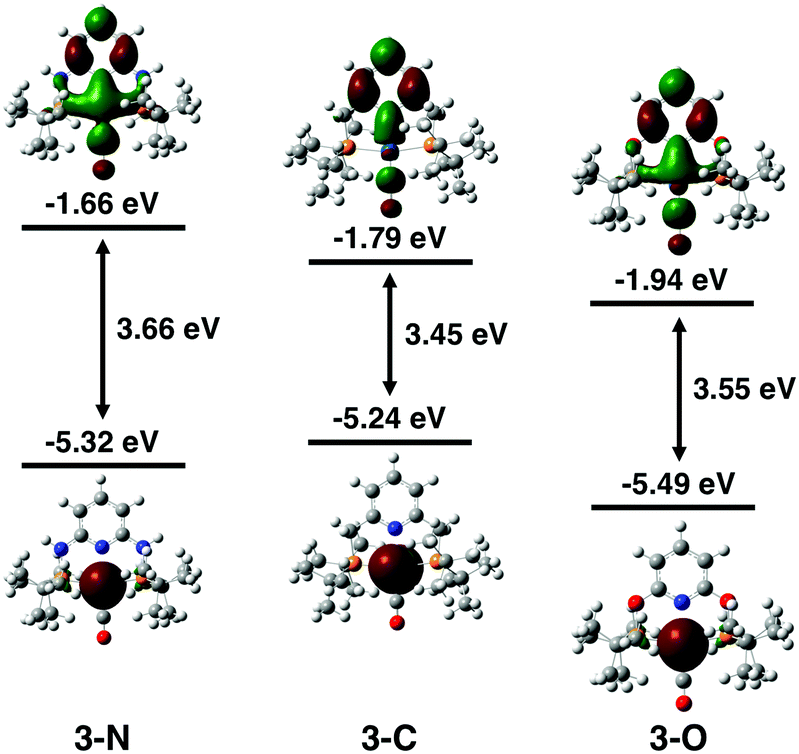 | ||
| Fig. 3 DFT calculated HOMO and LUMO energy levels of 3-N (left), 3-C (middle), and 3-O (right). 3-N has the highest energy LUMO despite having a lower HOMO energy than 3-C. This high-energy LUMO is correlated with the more negative reduction potential of 3-N. | ||
DFT calculations shed light on the effect of reduction. The comparison of spin densities in the reduced complexes (Fig. 4) reveals that the unpaired electron in 3-N is most localized on the Ir centre. This may be the key factor that makes 3-N more reactive than the other complexes in the series for CO2 reduction. The SOMOs of the reduced complexes (Fig. S22, ESI†) and corresponding spin population analysis (Fig. S23 and Table S4, ESI†) further support the idea that the Ir centre of 3-N is more affected upon reduction than those of 3-C, or 3-O. In all cases, the linker atoms themselves have negligible spin population, suggesting that the linker substitution alters the reactivity by tuning the electronic properties of the ligand. Additionally, electron density difference plots (Fig. S24, ESI†) show that 3-N has the largest increase in electron density at the metal centre after reduction. Before reduction, 3-C has the most electron density on the Ir consistent with the experimental and calculated CO stretching frequencies (Table S2, ESI†) and CM5 partial charges (Table S5, ESI†).38 After reduction, 3-N has the more electron density on the Ir, and corresponding lower CO stretching frequency and more negative partial charge on the Ir atom than for the other members of the series. Taken together, these calculations suggest that the linker atoms modulate the electron density at the catalytic centre by tuning the electronic properties of the ligand.
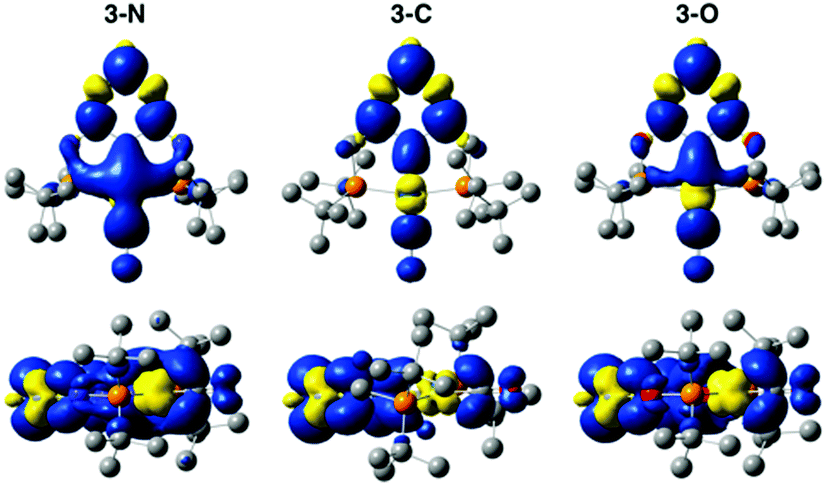 | ||
| Fig. 4 Spin density on reduced complexes 3-N (left), 3-C (middle), and 3-O (right). Blue and yellow surfaces (isovalue = 0.001) indicate excess alpha and beta spin densities, respectively. Hydrogen atoms have been omitted from the structures for clarity. | ||
In summary, we find that the electrocatalytic properties of a series of three pincer-iridium(I) complexes are strongly modulated by the nature of the ligand. Complex 3-N with amino linkers in the pincer ligand exhibited prolonged stability and nearly quantitative efficiency for CO2-to-CO conversion, with no significant proton reduction observed with a half-wave overpotential about 0.86 V. The complex remained molecular throughout the course of electrolysis. Replacing the amino linker with a methylene group resulted in complex 3-C, with poor selectivity, while replacing the amino group by an oxygen unit leads to 3-O which has no significant catalytic activity. DFT calculations suggest that 3-N is most active possibly because of the highest electron density on the iridium centre after reduction, leading to a more active catalytic centre for CO2 reduction. Increased electron density at the metal centre has previously been shown to result in higher activities and increased faradaic efficiency for CO production.39,40 In-depth mechanistic studies are in progress. These results suggest that variation of the linkers in pincer ligands can strongly affect the catalytic performance by modulating the spin density on the CO2 binding site and could thus be exploited for ligand screening in computational catalyst design.41
We thank the staff at the Yale West Campus Analytical Core and the Yale Chemical and Biophysical Instrumentation Centre for their help with the instrumentation. This work was supported by the U.S. Department of Energy, Chemical Sciences, Geosciences, and Biosciences Division, Office of Basic Energy Sciences, Office of Science (Grant DEFG02-07ER15909) and partly by the U.S. National Science Foundation (grant CHE-1651717). Additional support was provided by a generous donation from the TomKat Charitable Trust. V. S. B. acknowledges computational time from NERSC and Yale HPC.
Conflicts of interest
There are no conflicts to declare.Notes and references
- A. J. Morris, G. J. Meyer and E. Fujita, Acc. Chem. Res., 2009, 42, 1983 CrossRef CAS PubMed.
- J.-M. Savéant, Chem. Rev., 2008, 108, 2348 CrossRef PubMed.
- R. B. Ambre, Q. Daniel, T. Fan, H. Chen, B. Zhang, L. Wang, M. S. G. Ahlquist, L. Duan and L. Sun, Chem. Commun., 2016, 52, 14478 RSC.
- R. Francke, B. Schille and M. Roemelt, Chem. Rev., 2018, 118, 4631 CrossRef CAS PubMed.
- M. G. Kibria, J. P. Edwards, C. M. Gabardo, C.-T. Dinh, A. Seifitokaldani, D. Sinton and E. H. Sargent, Adv. Mater., 2019, 31, 1807166 CrossRef PubMed.
- C. Hepburn, E. Adlen, J. Beddington, E. A. Carter, S. Fuss, N. M. Dowell, J. C. Minx, P. Smith and C. K. Williams, Nature, 2019, 575, 87 CrossRef CAS PubMed.
- C. Costentin, M. Robert and J.-M. Savéant, Chem. Soc. Rev., 2013, 42, 2423 RSC.
- J. Qiao, Y. Liu, F. Hong and J. Zhang, Chem. Soc. Rev., 2014, 43, 631 RSC.
- X. Duan, J. Xu, Z. Wei, J. Ma, S. Guo, S. Wang, H. Liu and S. Dou, Adv. Mater., 2017, 29, 1701784 CrossRef PubMed.
- N. Elgrishi, M. B. Chambers, X. Wang and M. Fontecave, Chem. Soc. Rev., 2017, 46, 761 RSC.
- H. Takeda, C. Cometto, O. Ishitani and M. Robert, ACS Catal., 2017, 7, 70 CrossRef CAS.
- F. Franco, S. Fernández and J. Lloret-Fillol, Curr. Opin. Electrochem., 2019, 15, 109 CrossRef CAS.
- K. E. Dalle, J. Warnan, J. J. Leung, B. Reuillard, I. S. Karmel and E. Reisner, Chem. Rev., 2019, 119, 2752 CrossRef CAS PubMed.
- C. Jiang, A. W. Nichols and C. W. Machan, Dalton Trans., 2019, 48, 9454–9468 RSC.
- D. Gao, R. M. Aran-Ais, H. S. Jeon and B. R. Cuenya, Nat. Catal., 2019, 2, 198 CrossRef CAS.
- P. Kang, S. Zhang, T. J. Meyer and M. Brookhart, Angew. Chem., Int. Ed., 2014, 53, 8709 CrossRef CAS PubMed.
- A. Szymaszek and F. P. Pruchnik, J. Organomet. Chem., 1989, 376, 133 CrossRef CAS.
- G. F. Manbeck, K. Garg, T. Shimoda, D. J. Szalda, M. Z. Ertem, J. T. Muckerman and E. Fujita, Faraday Discuss., 2017, 198, 301 RSC.
- F. D. Sypaseuth, C. Matlachowski, M. Weber, M. Schwalbe and C. C. Tzschucke, Chem. – Eur. J., 2015, 21, 6564 CrossRef CAS PubMed.
- P. Kang, T. J. Meyer and M. Brookhart, Chem. Sci., 2013, 4, 3497 RSC.
- K. Tanaka, Y. Kushi, K. Tsuge, K. Toyohara, T. Nishioka and K. Isobe, Inorg. Chem., 1998, 37, 120 CrossRef CAS PubMed.
- Y. Kushi, H. Nagao, T. Nishioka, K. Isobe and K. Tanaka, J. Chem. Soc., Chem. Commun., 1995, 1223 RSC.
- P. Kang, C. Cheng, Z. Chen, C. K. Schauer, T. J. Meyer and M. Brookhart, J. Am. Chem. Soc., 2012, 134, 5500 CrossRef CAS PubMed.
- S. T. Ahn, E. A. Bielinski, E. M. Lane, Y. Chen, W. H. Bernskoetter, N. Hazari and G. T. R. Palmore, Chem. Commun., 2015, 51, 5947 RSC.
- E. Peris and R. H. Crabtree, Chem. Soc. Rev., 2018, 47, 1959 RSC.
- S. M. Kloek, D. M. Heinekey and K. I. Goldberg, Organometallics, 2006, 25, 3007 CrossRef CAS.
- R. Dorta, R. Goikhman and D. Milstein, Organometallics, 2003, 22, 2806 CrossRef CAS.
- B. P. Sullivan, C. M. Bolinger, D. Conrad, W. J. Vining and T. J. Meyer, J. Chem. Soc., Chem. Commun., 1985, 1414 RSC.
- C. Costentin, S. Drouet, M. Robert and J.-M. Savéant, J. Am. Chem. Soc., 2012, 134, 11235 CrossRef CAS PubMed.
- Y. Matsubara, ACS Energy Lett., 2019, 4, 1999 CrossRef CAS.
- C. Costentin and J.-M. Savéant, ChemElectroChem, 2014, 1, 1226 CrossRef CAS.
- E. S. Rountree, B. D. McCarthy, T. T. Eisenhart and J. L. Dempsey, Inorg. Chem., 2014, 53, 9983 CrossRef CAS PubMed.
- V. C.-C. Wang and B. A. Johnson, ACS Catal., 2019, 9, 7109 CrossRef CAS.
- E. S. Wiedner, H. J. S. Brown and M. L. Helm, J. Am. Chem. Soc., 2016, 138, 604 CrossRef CAS PubMed.
- Y. Wu, J. Jiang, Z. Weng, M. Wang, D. L. J. Broere, Y. Zhong, G. W. Brudvig, Z. Feng and H. Wang, ACS Cent. Sci., 2017, 3, 847 CrossRef CAS PubMed.
- T. Koopmans, Physica, 1934, 1, 104 CrossRef.
- D. D. Méndez-Hernández, P. Tarakeshwar, D. Gust, T. A. Moore, A. L. Moore and V. Mujica, J. Mol. Model., 2013, 19, 2845 CrossRef PubMed.
- A. V. Marenich, S. V. Jerome, C. J. Cramer and D. G. Truhlar, J. Chem. Theory Comput., 2012, 8, 527 CrossRef CAS PubMed.
- M. L. Clark, P. L. Cheung, M. Lessio, E. A. Carter and C. P. Kubiak, ACS Catal., 2018, 8, 2021 CrossRef CAS.
- J. A. Therrien and M. O. Wolf, Inorg. Chem., 2017, 56, 1161 CrossRef CAS PubMed.
- J. G. Freeze, H. R. Kelly and V. S. Batista, Chem. Rev., 2019, 119, 6595–6612 CrossRef CAS PubMed.
Footnotes |
| † Electronic supplementary information (ESI) available: Experimental details; cyclic voltammetry, UV-Vis spectra, and FT-IR spectra of complex 3-N, 3-C, and 3-O; XRD of complex 3-N and 3-O. Foot-of-wave analysis and kinetic analysis of 3-N; SEM, EDS, and XPS analysis of activated surface; calculation details and results; crystal data of 3-N; and crystal data of 3-O. CCDC 2001541 and 2001542. For ESI and crystallographic data in CIF or other electronic format see DOI: 10.1039/d0cc03207g |
| ‡ These authors contributed equally to this work. |
| This journal is © The Royal Society of Chemistry 2020 |