 Open Access Article
Unusually large fluorescence quantum yield for a near-infrared emitting DNA-stabilized silver nanocluster†
Vlad A.
Neacşu‡
 a,
Cecilia
Cerretani‡
a,
Mikkel B.
Liisberg
a,
Cecilia
Cerretani‡
a,
Mikkel B.
Liisberg
 a,
Steven M.
Swasey
b,
Elisabeth G.
Gwinn
c,
Stacy M.
Copp
 de and
Tom
Vosch
 *a
*a
aNanoscience Center and Department of Chemistry, University of Copenhagen, Universitetsparken 5, 2100 Copenhagen, Denmark. E-mail: tom@chem.ku.dk
bDepartment of Chemistry, University of California, Santa Barbara, California 93106, USA
cDepartment of Physics, University of California, Santa Barbara, California 93106, USA
dDepartment of Materials Science and Engineering, University of California, Irvine, California 92697-2585, USA
eDepartment of Physics and Astronomy, University of California, Irvine, California 92697-4575, USA
First published on 11th May 2020
Abstract
A near-infrared emitting DNA-stabilized silver nanocluster (DNA-AgNC) with an unusually high fluorescence quantum yield is presented. The steady-state and time-resolved fluorescence properties of the DNA-AgNC were characterized, together with its ability to generate optically activated delayed fluorescence (OADF) and upconversion fluorescence (UCF).
DNA-AgNCs are a relatively new class of emitters, first introduced in 2004.1 DNA-AgNCs are composed of a limited number of silver atoms and cations (typically 2–30) wrapped in one or more DNA strands.2,3 The easiest way to tune the optical properties is by varying the DNA sequence, which has an effect on the type of silver cluster that can be stabilized.3–5 Not all DNA sequences yield DNA-AgNCs with useful properties, e.g. high brightness or photostability. In order to shed light on the relationship between DNA sequence and the optical properties of DNA-AgNCs, we have in recent years focused on studying the photophysical properties of HPLC-purified DNA-AgNCs; this step of purification ensures that a single type of emissive DNA-AgNC species is studied.6–9 Recently, crystal structure data of DNA-AgNCs has appeared in the literature, which will become a key part in understanding the relationship between DNA sequence and optical properties of the DNA-AgNCs.10,11
In this paper, we have studied the photophysical properties of a NIR-emitting DNA-AgNC, stabilized by the sequence 5′-CCCGGAGAAG-3′. This 10-base DNA oligomer was initially reported by Copp et al. in a study on the relationship between emission color and DNA sequence.4 The NIR part of the electromagnetic spectrum is of particular interest for imaging biological material due to regions of high transparency.12 However, a drawback of designing fluorophores in the NIR range is that, due to the small energy gap between excited state and ground state, non-radiative decay pathways tend to outcompete the radiative pathways, resulting in low fluorescence quantum yields. Thus, it is especially notable that the NIR-emitting DNA-AgNC presented in this paper has an unusually high fluorescence quantum yield of 73%.13
The DNA-AgNCs were synthesized by mixing 5′-CCCGGAGAAG-3′ with AgNO3 in a 10 mM ammonium acetate (NH4OAc) solution. After 15 minutes, NaBH4 was added in order to reduce the silver cations. The ratio of the components in the final mixture was [DNA]![[thin space (1/6-em)]](https://www.rsc.org/images/entities/char_2009.gif) :
:![[thin space (1/6-em)]](https://www.rsc.org/images/entities/char_2009.gif) [Ag+]
[Ag+]![[thin space (1/6-em)]](https://www.rsc.org/images/entities/char_2009.gif) :
:![[thin space (1/6-em)]](https://www.rsc.org/images/entities/char_2009.gif) [BH4−] = 20 μM
[BH4−] = 20 μM![[thin space (1/6-em)]](https://www.rsc.org/images/entities/char_2009.gif) :
:![[thin space (1/6-em)]](https://www.rsc.org/images/entities/char_2009.gif) 100 μM
100 μM![[thin space (1/6-em)]](https://www.rsc.org/images/entities/char_2009.gif) :
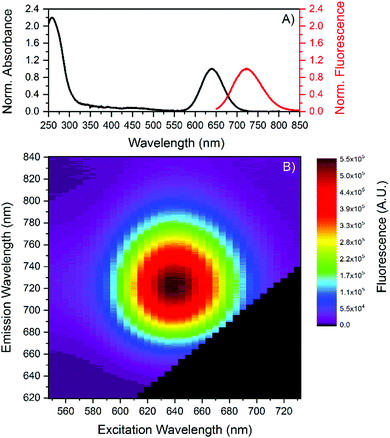
:![[thin space (1/6-em)]](https://www.rsc.org/images/entities/char_2009.gif) 50 μM. A single fraction with a retention time around 12 minutes was collected by HPLC purification. Further information can be found in the (ESI†). Fig. 1 shows the absorption and emission spectra of the HPLC-purified DNA-AgNCs. The DNA-AgNC has an absorption maximum at 640 nm and an emission maximum centered at 721 nm at 25 °C. Fig. 1B indicates a single type of emissive species, since no shift in the emission maximum versus excitation wavelength is found.14,15
50 μM. A single fraction with a retention time around 12 minutes was collected by HPLC purification. Further information can be found in the (ESI†). Fig. 1 shows the absorption and emission spectra of the HPLC-purified DNA-AgNCs. The DNA-AgNC has an absorption maximum at 640 nm and an emission maximum centered at 721 nm at 25 °C. Fig. 1B indicates a single type of emissive species, since no shift in the emission maximum versus excitation wavelength is found.14,15
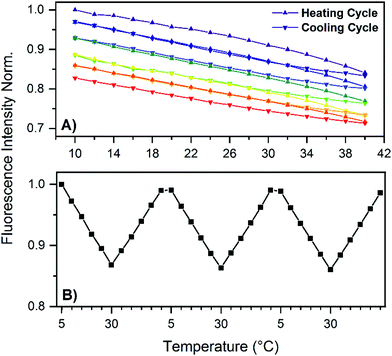
Absorption and emission maxima recorded at different temperatures can be found in Table 1, which show no significant changes in the 5 to 30 °C range. Next, we determined the fluorescence quantum yield (Q) at 25 °C which has a high value of 73%. In order to test the temperature stability of the NIR-emitting DNA-AgNC, we applied several heating and cooling cycles to the DNA-AgNCs in a 10 mM NH4OAc solution. Fig. 2A shows 5 heating and cooling cycles from 10 to 40 °C. From 5 to 30 °C the fluorescence intensity changes linearly and reversibly with temperature. Above 30 °C an irreversible loss in the overall fluorescence intensity is observed (see also Fig. S3, ESI†). To confirm the reversibility in the 5–30 °C range, we repeated the experiment and the results can be seen in Fig. 2B. Fig. 2B demonstrates that the fluorescence intensity can be cycled quite reversibly in this temperature range. The change above 30 °C is due to an irreversible conversion to a different species with an absorption maximum in the 400–500 nm range (see Fig. S3, ESI†). This new absorption feature could be due to silver nanoparticles formation, indicating a limited thermal stability of the DNA-AgNCs. The most intriguing observation however is the Q value of 73% (see Fig. S5, ESI†), which is very high for the NIR range.13 The lowering of fluorescence quantum yield for organic fluorophores with increasing wavelength can be rationalized by the smaller energy gap that starts to favor non-radiative decay over radiative decay.17 Conceptually, this can be explained by internal conversion from the excited state to an excited vibrational state in the ground state. As the energy gap between ground and excited state narrows, their respective vibrational energy levels (and overtones thereof) overlap more and more. This is especially pronounced for organic dyes made from light elements that can form bonds with high vibrational frequencies, compared to heavier elements.18 A possible explanation for the high fluorescence quantum yield in our case is that the AgNC is weakly bound to the DNA scaffold (agreeing with the observed limited thermal stability), limiting solvent and/or DNA-mediated non-radiative decay. This could be a very important discovery, opening up the possibility to find other DNA-AgNCs that emit even further in the NIR,3 while retaining a high fluorescence quantum yield. Such fluorophores are currently missing and in high demand since they could find uses for in vivo tissue imaging.19 Time-resolved anisotropy measurements revealed that the NIR-emitting DNA-AgNC has a hydrodynamic volume of 19.6 nm3 (see Fig. S4, ESI†), indicating that two, if not three, DNA strands stabilize this AgNC. The latter argument is based on comparing the hydrodynamic volume of another NIR-emitting DNA-AgNC composed of 16 silver atoms stabilized by two 10-base oligonucleotides8 which has a hydrodynamic volume of 10.5 nm3.
| a Intensity-weighted average decay time, weighted by the intensity over the whole emission range. b Terrylene diimide in toluene was used as a reference (Q = 0.69).16 c Measurements performed in liquid nitrogen (−196 °C) and a mixture of dry ice and acetone (−78 °C), respectively. | ||||||||
|---|---|---|---|---|---|---|---|---|
| Temp. [°C] | −196c | −78c | 5 | 10 | 15 | 20 | 25 | 30 |
λ
abs![[thin space (1/6-em)]](https://www.rsc.org/images/entities/char_2009.gif) max [nm] max [nm] |
640 | 640 | 640 | 640 | 640 | 640 | ||
λ
em![[thin space (1/6-em)]](https://www.rsc.org/images/entities/char_2009.gif) max [nm] max [nm] |
706 | 710 | 721 | 721 | 721 | 721 | 721 | 721 |
| 〈τw〉a [ns] | 3.63 | 3.74 | 3.75 | 3.74 | 3.74 | 3.73 | 3.72 | 3.72 |
| Q | 0.73 | |||||||
Coming back to the reversible fluorescence intensity change in the 5 to 30 °C range, the most obvious explanation for a temperature-dependent change in fluorescence intensity would be a change in Q due to a temperature dependent non-radiative decay pathway. However, we just argued that this might not be the case here. One way to probe this is to measure the fluorescence decay at different temperatures, since the fluorescence decay time is the inverse of the sum of the radiative and non-radiative decay rates. Interestingly, unlike a previously studied red-emitting DNA-AgNC,7 whose 〈τw〉 changes with temperature, no significant difference (∼1%) in the fluorescence decay time was observed for this NIR-emitting DNA-AgNCs in the 5–30 °C range (see Table 1). An intensity-weighted average fluorescence decay time of 3.72 ns was found at 25 °C. It was shown before that longer DNA oligonucleotides (19–30 bases) generate DNA-AgNCs characterized by multi-exponential fluorescence decays due to slow spectral relaxation on the time scale of the fluorescence decay time. However, this NIR-emitting DNA-AgNC, like another previously reported 10-base DNA-AgNC,8 seems to have an almost negligible amount of slow spectral relaxation, as can be seen in the time-resolved emission spectra (TRES) in Fig. S6 (ESI†) and the reduced χ2 values for mono-exponential fits in Table S1 (ESI†). Based on a phenomenological model of the electronic states presented by Cerretani et al. and Krause et al.,7,20 this could mean that the temperature dependent change of fluorescence intensity is due to either a temperature-dependent quantum yield of the emissive state formation (QS1) or due to a change in absorption with temperature and hence lowering the overall fluorescence, or a combination of both. Another scenario would be that the radiative and non-radiative rates change in opposite direction so that the sum is unaltered (this seems rather unlikely looking at the decay time measurements at −78° and −196 °C discussed below and listed in Table 1).
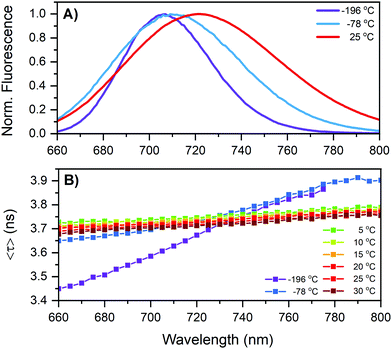
Fig. S3 (ESI†) shows a minor drop in the absorption from 10 to 25 °C of about 2.8%. In this temperature range the fluorescence decreases about 7.9%. This indicates that not all the loss of fluorescence can be attributed to a change in absorption, but there should also be an additional drop in Q. The change in absorption could be due to a temperature-dependent molar extinction coefficient or a reversible partial dissociation of the DNA-AgNCs. We did not determine Q at different temperatures since the expected change is too small to be determined accurately. Instead, we decided to freeze the DNA-AgNCs to evaluate if very low temperatures affected the decay time in a way that could help interpret the photophysical properties. DNA-AgNCs in 10 mM NH4OAc were frozen in an NMR tube and the fluorescence decay times and emission spectra were recorded at −78 °C (acetone/dry ice mixture) and −196 °C (liquid nitrogen). The results of these experiments can be found in Fig. 3 and Table 1. Surprisingly, the 〈τw〉 is nearly unchanged with a value of 3.74 ns at −78 °C. The emission spectrum narrows and blue shifts to a maximum centered at 710 nm. Interestingly, the fluorescence decay time becomes multi-exponential, as can be seen by the rise in the average decay time as a function of emission wavelength in Fig. 3B and the TRES in Fig. S7 (ESI†). The freezing restricts the conformational flexibility of the DNA-AgNC and the slow spectral relaxation on the timescale of the fluorescence decay time becomes visible again. This observation is in line with a previous report where changing the viscosity dramatically enhanced the slow spectral relaxation.8 However, it is still remarkable that even when the DNA-AgNC studied here is frozen solid, slow spectral relaxation occurs. The effect becomes even more pronounced at −196 °C (see Fig. 3B). The emission spectrum narrows further and the maximum is now centered at 706 nm. The 〈τw〉 at −196 °C is 3.63 ns, which is comparable to, but about 0.1 ns shorter than 〈τw〉 at room temperature. These observations lead us to conclude that non-radiative decay from the emissive state due to internal conversion must be negligible. Based on previous phenomenological photophysical models of DNA-AgNCs, we assume that Q is the product of the quantum yield of emissive state formation (QS1) from the Frank–Condon state and the fluorescence quantum yield from the emissive state (Qfl).7
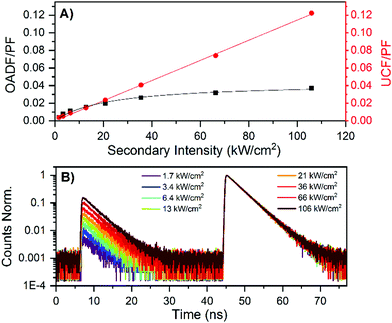
It has been previously demonstrated for a large number of DNA-AgNCs that dark state formation from the Frank–Condon state is a common process.20–27 This dark state can be optically excited by a secondary NIR laser that pumps the dark state to the emissive state in a process termed optically activated delayed fluorescence (OADF).20,23 We performed OADF measurements, since this allows to estimate the minimum value for the quantum yield of dark state formation (QD1), as was previously demonstrated for a red-emitting DNA-AgNC.20,28,29 After determining the OADF and upconversion fluorescence (UCF) contributions to the secondary fluorescence (SF, see ESI† for details) and normalizing it to the primary fluorescence (PF), a minimum QD1 value of 4.3% was found.20 This value is very similar to the minimum QD1 value of 3.9% previously found for a red-emitting DNA-AgNC.20 Interestingly, the contribution of UCF to the SF seems much higher here than for the red emissive DNA-AgNC.20 As demonstrated before,20 the UCF signal is not due to a coherent two-photon absorption process, but a consecutive photon absorption process, since a rather linear relationship can be found for the UCF signal versus secondary excitation intensity (see Fig. 4A).28 The easily detectable OADF and UCF signals of this NIR-emitting DNA-AgNC make it an interesting candidate for anti-Stokes fluorescence imaging.20 Besides dark state formation, the Frank–Condon state could partially undergo ultrafast ground state recovery, as was demonstrated previously for red-emitting DNA-AgNCs.21
 | ||
| Fig. 4 (A) Contribution of OADF and UCF to the SF signal, relative to the PF signal. (B) Decay curves of the NIR-emitting DNA-AgNCs in 10 mM NH4OAc. The PF region (excitation with the 640 nm pulse, see Fig. S8A, ESI†) is from about 45 to 70 ns, while the SF region (excitation with the 760–850 nm pulse, see Fig. S8A, ESI†) is from 7 to 30 ns. The primary excitation intensity was 127 W cm−2, whereas the secondary excitation intensity was varied from 1.7 to 106 kW cm−2. Decay curves with only the secondary excitation to untangle the UCF from the OADF contribution can be found in Fig. S8B (ESI†). | ||
In summary, we present a NIR-emitting DNA-AgNC with an unusually high fluorescence quantum yield of 73% at 25 °C. This result suggests that there may exist more DNA-AgNCs further out in the NIR range that can maintain their high fluorescence quantum yield. These high fluorescence quantum yield NIR emitters are new and promising candidates for tissue imaging in the biological transparent NIR windows. We hypothesized that low coupling of the AgNC to the DNA bases could be the reason for both the high fluorescence quantum yield and the limited thermal stability. The NIR emitter converts irreversibly to a non-emissive compound upon prolonged heating above 30 °C. Additionally, we demonstrated that this DNA-AgNC can produce easily detectable OADF and UCF signals that make it potentially suitable for anti-Stokes fluorescence imaging.
We acknowledge financial support from the Villum Foundation (Project number VKR023115), the Carlsberg Foundation (CF14-0388 and CF17-0470) and the Department of Chemistry, University of Copenhagen. The authors also thank Sruthi Gudibandi and Petko Bogdanov for their contributions to develop the DNA sequence reported here and Sidsel Bogh for performing initial exploratory measurements.
Conflicts of interest
There are no conflicts to declare.Notes and references
- J. T. Petty, J. Zheng, N. V. Hud and R. M. Dickson, J. Am. Chem. Soc., 2004, 126, 5207–5212 CrossRef CAS PubMed.
- D. Schultz and E. G. Gwinn, Chem. Commun., 2012, 48, 5748–5750 RSC.
- S. M. Swasey, S. M. Copp, H. C. Nicholson, A. Gorovits, P. Bogdanov and E. G. Gwinn, Nanoscale, 2018, 10, 19701–19705 RSC.
- S. M. Copp, A. Gorovits, S. M. Swasey, S. Gudibandi, P. Bogdanov and E. G. Gwinn, ACS Nano, 2018, 12, 8240–8247 CrossRef CAS PubMed.
- S. M. Copp, D. Schultz, S. Swasey, J. Pavlovich, M. Debord, A. Chiu, K. Olsson and E. Gwinn, J. Phys. Chem. Lett., 2014, 5, 959–963 CrossRef CAS PubMed.
- S. A. Bogh, C. Cerretani, L. Kacenauskaite, M. R. Carro-Temboury and T. Vosch, ACS Omega, 2017, 2, 4657–4664 CrossRef CAS PubMed.
- C. Cerretani, M. R. Carro-Temboury, S. Krause, S. A. Bogh and T. Vosch, Chem. Commun., 2017, 53, 12556–12559 RSC.
- S. A. Bogh, M. R. Carro-Temboury, C. Cerretani, S. M. Swasey, S. M. Copp, E. G. Gwinn and T. Vosch, Methods Appl. Fluoresc., 2018, 6, 024004 CrossRef PubMed.
- C. Cerretani and T. Vosch, ACS Omega, 2019, 4, 7895–7902 CrossRef CAS PubMed.
- D. J. E. Huard, A. Demissie, D. Kim, D. Lewis, R. M. Dickson, J. T. Petty and R. L. Lieberman, J. Am. Chem. Soc., 2019, 141, 11465–11470 CrossRef CAS PubMed.
- C. Cerretani, H. Kanazawa, T. Vosch and J. Kondo, Angew. Chem., Int. Ed., 2019, 58, 17153–17157 CrossRef CAS PubMed.
- R. Weissleder, Nat. Biotechnol., 2001, 19, 316–317 CrossRef CAS PubMed.
- K. Rurack and M. Spieles, Anal. Chem., 2011, 83, 1232–1242 CrossRef CAS PubMed.
- M. R. Carro Temboury, V. Paolucci, E. N. Hooley, L. Latterini and T. Vosch, Analyst, 2016, 141, 123–130 RSC.
- C. M. Ritchie, K. R. Johnsen, J. R. Kiser, Y. Antoku, R. M. Dickson and J. T. Petty, J. Phys. Chem. C, 2007, 111, 175–181 CrossRef CAS PubMed.
- K. Kennes, Y. Baeten, T. Vosch, W. Sempels, S. Yordanov, S. Stappert, L. Chen, K. Müllen, J. Hofkens, M. Van der Auweraer and E. Fron, J. Phys. Chem. B, 2014, 118, 14662–14674 CrossRef CAS PubMed.
- J. R. Lakowicz, Principles of Fluorescence Spectroscopy, Springer, 3rd edn, 2006 Search PubMed.
- O. E. Semonin, J. C. Johnson, J. M. Luther, A. G. Midgett, A. J. Nozik and M. C. Beard, J. Phys. Chem. Lett., 2010, 1, 2445–2450 CrossRef CAS.
- R. Wang and F. Zhang, J. Mater. Chem. B, 2014, 2, 2422–2443 RSC.
- S. Krause, M. R. Carro-Temboury, C. Cerretani and T. Vosch, Chem. Commun., 2018, 54, 4569–4572 RSC.
- S. A. Patel, M. Cozzuol, J. M. Hales, C. I. Richards, M. Sartin, J. C. Hsiang, T. Vosch, J. W. Perry and R. M. Dickson, J. Phys. Chem. C, 2009, 113, 20264–20270 CrossRef CAS PubMed.
- I. L. Volkov, P. Y. Serdobintsev and A. I. Kononov, J. Phys. Chem. C, 2013, 117, 24079–24083 CrossRef CAS.
- B. C. Fleischer, J. T. Petty, J.-C. Hsiang and R. M. Dickson, J. Phys. Chem. Lett., 2017, 8, 3536–3543 CrossRef CAS PubMed.
- I. Volkov, T. Sych, P. Serdobintsev, Z. Reveguk and A. Kononov, J. Lumin., 2016, 172, 175–179 CrossRef CAS.
- J. T. Petty, C. Fan, S. P. Story, B. Sengupta, M. Sartin, J.-C. Hsiang, J. W. Perry and R. M. Dickson, J. Phys. Chem. B, 2011, 115, 7996–8003 CrossRef CAS PubMed.
- T. Vosch, Y. Antoku, J. C. Hsiang, C. I. Richards, J. I. Gonzalez and R. M. Dickson, Proc. Natl. Acad. Sci. U. S. A., 2007, 104, 12616–12621 CrossRef CAS PubMed.
- C. I. Richards, J. C. Hsiang, D. Senapati, S. Patel, J. Yu, T. Vosch and R. M. Dickson, J. Am. Chem. Soc., 2009, 131, 4619–4621 CrossRef CAS PubMed.
- S. Krause, C. Cerretani and T. Vosch, Chem. Sci., 2019, 10, 5326–5331 RSC.
- S. Krause, M. R. Carro-Temboury, C. Cerretani and T. Vosch, Phys. Chem. Chem. Phys., 2018, 20, 16316–16319 RSC.
Footnotes |
| † Electronic supplementary information (ESI) available: Material and methods section, formation kinetics, HPLC data, additional steady state and time-resolved fluorescence data. See DOI: 10.1039/d0cc01849j |
| ‡ Both authors contributed equally. |
| This journal is © The Royal Society of Chemistry 2020 |


