 Open Access Article
Creative Commons Attribution 3.0 Unported Licence
Teaching old indicators even more tricks: binding affinity measurements with the guest-displacement assay (GDA)†
Stephan
Sinn
 *,
Joana
Krämer
 and
Frank
Biedermann
 *
*
Karlsruhe Institute of Technology (KIT), Institute of Nanotechnology (INT), Hermann-von-Helmholtz-Platz 1, 76344 Eggenstein-Leopoldshafen, Germany. E-mail: stephan.sinn@kit.edu; frank.biedermann@kit.edu
First published on 1st May 2020
Abstract
A simple change has important consequences: the guest-displacement assay (GDA) is introduced which allows for binding affinity determinations of supramolecular complexes with spectroscopically silent hosts and guests. GDA is complementary to indicator-displacement assay for affinity measurements with soluble components, but is superior for insoluble or for weakly binding guests.
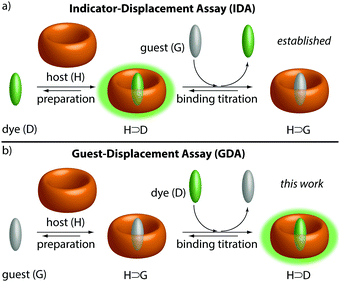
The physico-chemical description of supramolecular systems, e.g. host–guest complexes, usually focuses on the thermodynamic properties, i.e. binding affinities (Ka) in an effort to develop binding models and to derive predictive structure–property correlations.1–11Ka values of guest-inclusion complexes have been reported for many different classes of synthetic hosts.12,13 Also, protein–ligand binding can be described through a host–guest binding formalism.14 There are two major classes of methods available to determine binding affinities of host–guest complexes, (i) direct-binding assays, and (ii) competitive-binding assays. In direct-binding assays (DBAs), the change in a spectroscopic property (e.g. NMR shift, absorbance, emission) or the heat of the reaction is recorded to construct a binding isotherm.3,15 In each case, either a guest solution is titrated to a solution of the host or vice versa. Therefore, host and guest need to be soluble, which limits the number of host–guest combinations that can be compared in the same neat solvents. Similarly, in an indicator-displacement assay (IDA),15–17 which is the most utilized competitive method for Ka value determination of supramolecular systems, a solution of a guest is titrated to a solution of a host-indicator complex (Fig. 1a). IDA is superior over DBA for obtaining affinities of spectroscopically silent host–guest complexes, but it is restricted to soluble guests.
A common workaround for the solubility limitations is the use of (complex) solvent mixtures, consisting of polar and apolar solvents in a suitable ratio to dissolve both the host and the guest.18 Other additives such as salts can also be useful to dissolve hosts or guests.19 Nevertheless, this practically-motivated approach can cause fundamental problems; (i) even miscible solvents, e.g. water and methanol, may not mix on a molecular level,20 such that preferential solvation of the host or guest by one solvent component may occur.21 (ii) Competitive binding of solvent or salts to the host can result in apparent binding affinities of the host–guest complex of interest.19,22 Such effects can occur even at low volume percentages of the cosolvent.23
As a result of the solvophobic effect, the most insoluble guests typically display the strongest binding affinities for supramolecular hosts,4,5,10,24,25 but such compounds escape the accurate assessment of their Ka values with established methods.
In this contribution, we demonstrate an alternative approach for determining binding affinities of host–guest complexes which is now applicable to insoluble or weakly binding guests.
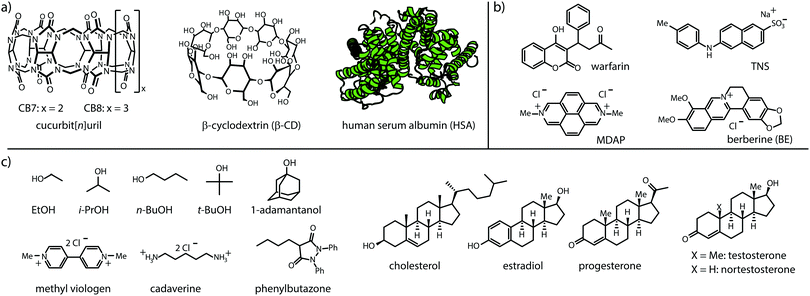
Cucurbit[n]urils (CBn)26–28 and cyclodextrins (CD),29,30 see Fig. 2, were chosen as representative macrocyclic hosts because both CBn and CDs are commercial, water-soluble and non-toxic,31–33 and have received wide attention in the supramolecular, materials and pharmacological community.34 Besides, they find use as solubility-enhancing excipients in pharmacology and industry,13,35–38 making them ideal model hosts for the proposed GDA setup with insoluble guests. Human serum albumin (HSA) was selected as a model protein because of its important biological role as a carrier protein. Moreover, HSA is commercially available at a standardized high purity (fatty acid free grade) and provides a wide binding spectrum of hydrophobic drugs.39,40 Twelve organic compounds ranging from hydrophophilic, such as alcohols and cadaverine, to hydrophobic compounds such as steroids and phenylbutazone were selected as representative, non-chromophoric guests for CBn, CD and HSA, see Fig. 2c.
 | ||
| Fig. 2 Chemical structures of (a) hosts, (b) fluorescent indicator dyes, and (c) water-soluble and water-insoluble guests used in this study. See ESI† for solubilities of H, G and D, and photophysical properties of D and H⊃D. | ||
In the herein introduced guest-displacement assay (GDA), a spectroscopically silent and potentially insoluble guest (G) is equilibrated with the host (H) to form a host–guest complex, H⊃G. Aliquots of an indicator (e.g. an emissive dye, D) are subsequently added, causing competitive displacement of G and formation of a host–dye complex, H⊃D, see Fig. 1b. At the first glance, GDA is simply a reversed IDA, however, the implications from this subtle change of the order of compound addition are important from both a fundamental and practical point of view.
The competitive binding network of H, G and D can be analyzed through the eqn (1)–(6), where KHDa and KHGa are the binding constants of the H⊃D and H⊃G complexes, respectively. H and G are assumed to be spectroscopically silent. Note that these mathematical equations also model the IDA titration experiments.15,16
| HG + D ⇄ HD + G | (1) |
| H + D ⇄ HD H + G ⇄ HG | (2) |
 | (3) |
| [H]0 = [HD] + [H] + [HG] | (4) |
| [D]0 = [HD] + [D] [G]0 = [HG] + [G] | (5) |
| Ic = I0 + IHD·[HD] + ID·[D] | (6) |
![[thin space (1/6-em)]](https://www.rsc.org/images/entities/char_2009.gif) Ka = 4.5 for CB7 in water), GDA experiments in water yielded log
Ka = 4.5 for CB7 in water), GDA experiments in water yielded log![[thin space (1/6-em)]](https://www.rsc.org/images/entities/char_2009.gif) Ka = 4.9, which is in good agreement with log
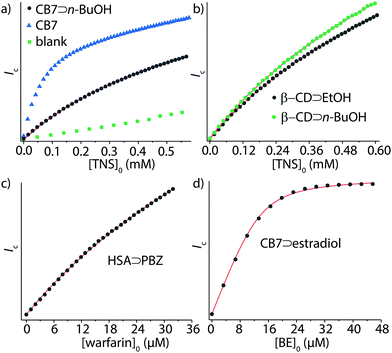
Ka = 4.9, which is in good agreement with log![[thin space (1/6-em)]](https://www.rsc.org/images/entities/char_2009.gif) Ka = 4.7 by IDA, see Table 1 and Fig. 3a. Similarly, GDA and IDA yielded matching affinities for CB7⊃cadaverine complex formation, log
Ka = 4.7 by IDA, see Table 1 and Fig. 3a. Similarly, GDA and IDA yielded matching affinities for CB7⊃cadaverine complex formation, log![[thin space (1/6-em)]](https://www.rsc.org/images/entities/char_2009.gif) Ka = 8.4 and 8.6. The performance of GDA was also tested for β-CD, CB8, and HSA as representative supramolecular hosts. For instance, GDA provided an accurate binding affinity for the moderately soluble anti-inflammatory drug phenyl butazone (PBZ, log
Ka = 8.4 and 8.6. The performance of GDA was also tested for β-CD, CB8, and HSA as representative supramolecular hosts. For instance, GDA provided an accurate binding affinity for the moderately soluble anti-inflammatory drug phenyl butazone (PBZ, log![[thin space (1/6-em)]](https://www.rsc.org/images/entities/char_2009.gif) Ka = 5.8, Fig. 3c).
Ka = 5.8, Fig. 3c).
| Guesta | Hosta | Dyea | log![[thin space (1/6-em)]](https://www.rsc.org/images/entities/char_2009.gif) Kab Kab |
Methodc |
|---|---|---|---|---|
a See Fig. 1 for chemical structures of guest, hosts and dyes. See Table S3 in the ESI for H⊃D affinities. Values are available at “http://suprabank.org”.
b Binding affinities, Ka in M−1, in deionized water; errors (StDev) were obtained from triplicate experiments, see Table S3 (ESI) for details. A mixture of H2O/ethanol (99.5/0.5; v/v) was used for CB7⊃cholesterol. Phosphate buffer saline (PBS) was used for HSA.
c DBA carried out by titrating the dye with the host, or the host with the dye.
d Values of log![[thin space (1/6-em)]](https://www.rsc.org/images/entities/char_2009.gif) KHGa and log KHGa and log![[thin space (1/6-em)]](https://www.rsc.org/images/entities/char_2009.gif) KHDa are outside the recommended range for GDA or IDA, see text.
e CB8⊃BE2 log KHDa are outside the recommended range for GDA or IDA, see text.
e CB8⊃BE2 log![[thin space (1/6-em)]](https://www.rsc.org/images/entities/char_2009.gif) Ka = 13.01 (M−1).42
f log Ka = 13.01 (M−1).42
f log![[thin space (1/6-em)]](https://www.rsc.org/images/entities/char_2009.gif) Ka = 5.41, via Scatchard plot.40 Ka = 5.41, via Scatchard plot.40
|
||||
| Ethanol | CB7 | TNS | 2.49 ± 0.01 | GDA |
| n-Butanol | CB7 | TNS | 4.89 ± 0.04 | GDA |
| 4.69 ± 0.02 | IDA | |||
| Cadaverine | CB7 | BE | ∼8d | GDA |
| 8.37 ± 0.05 | IDA | |||
| MDAP | 8.64 ± 0.03 | GDA | ||
| Progesterone | CB7 | TNS | 4.77 ± 0.08 | GDA |
| Estradiol | CB7 | BE | 6.25 ± 0.11 | GDA |
| Cholesterol | CB7 | BE | 5.91 ± 0.04 | GDA |
| Methyl viologen | CB7 | BE | 8.84 ± 0.04 | IDA |
| MDAP | 8.78 ± 0.01 | GDA | ||
| MDAP | CB7 | BE | 9.43 ± 0.02 | IDA |
| Nortestosterone | CB8 | BEe | 8.19 ± 0.09 | GDA |
| Ethanol | β-CD | TNS | 1.93 ± 0.01 | GDA |
| i-Propanol | β-CD | TNS | 2.27 ± 0.02 | GDA |
| n-Butanol | β-CD | TNS | 2.00 ± 0.04 | GDA |
| ∼2d | IDA | |||
| t-Butanol | β-CD | TNS | 2.26 ± 0.08 | GDA |
| 1-Adamantanol | β-CD | TNS | 5.01 ± 0.08 | IDA |
| ∼5d | GDA | |||
| Phenylbutazone | HSA | Warfarin | 5.83 ± 0.04f | GDA |
Importantly – unlike in DBA and IDA – with the GDA method insoluble guests can now be analyzed if soluble host–guest complexes can be formed. As a showcase example, we determined the Ka value of the nearly water-insoluble steroid estradiol (solubility SH2O ≈ 9 μM, see Table S1, ESI†) for CB7: firstly, the water-soluble CB7⊃estradiol complex was formed and the concentration of CB7 and estradiol was determined by 1H-NMR, see the ESI.† Aliquots of the CB7⊃estradiol stock solution were then titrated according to the GDA procedure with the water-soluble indicator dye berberine (BE)41 (Fig. 3d).
From the binding isotherms, log![[thin space (1/6-em)]](https://www.rsc.org/images/entities/char_2009.gif) Ka = 6.3 was obtained for the CB7⊃estradiol complex. Reassuringly, this binding strength is similar to that of the structurally-related, water-soluble estrane nortestosterone with CB7 (log
Ka = 6.3 was obtained for the CB7⊃estradiol complex. Reassuringly, this binding strength is similar to that of the structurally-related, water-soluble estrane nortestosterone with CB7 (log![[thin space (1/6-em)]](https://www.rsc.org/images/entities/char_2009.gif) Ka = 7.0) which was assessed by IDA and ITC experiments previously.37 Likewise, the affinity of the more bulky, insoluble progesterone (SH2O ≈ 33 μM) for CB7 became available through the GDA titration method, log
Ka = 7.0) which was assessed by IDA and ITC experiments previously.37 Likewise, the affinity of the more bulky, insoluble progesterone (SH2O ≈ 33 μM) for CB7 became available through the GDA titration method, log![[thin space (1/6-em)]](https://www.rsc.org/images/entities/char_2009.gif) Ka = 4.1. Alternatively, GDA titrations can be carried out at a low and constant vol% of cosolvent, as was demonstrated for the GDA of a CB7⊃cholesterol complex in a H2O/ethanol (99.5/0.5; v/v) mixture, see Table 1, while corresponding IDA titrations lead to a steady change of solvent
Ka = 4.1. Alternatively, GDA titrations can be carried out at a low and constant vol% of cosolvent, as was demonstrated for the GDA of a CB7⊃cholesterol complex in a H2O/ethanol (99.5/0.5; v/v) mixture, see Table 1, while corresponding IDA titrations lead to a steady change of solvent![[thin space (1/6-em)]](https://www.rsc.org/images/entities/char_2009.gif) :
:![[thin space (1/6-em)]](https://www.rsc.org/images/entities/char_2009.gif) cosolvent ratio during the course of a titration.
cosolvent ratio during the course of a titration.
During the GDA titration, the insoluble guest is displaced from the host cavity by the indicator dye that is subsequently stepwise added. Thus, one may wonder if the GDA method faces difficulties due to precipitation of the liberated insoluble guest. We have carefully tested for this scenario but have not observed any sign for precipitations. For instance, the homogenous aqueous solutions of CB7⊃estradiol that was titrated with berberine dissolved in water, remained clear and did not scatter light even after the end point of the titration was reached because only micromolar quantities of the unbound guest were liberated. (Besides, precipitation or crystallization of organic compounds from saturated solutions can be slow.)
As a second major advantage of GDA is its superior performance for weakly binding guests, which was uncovered both by simulations and experiments. For instance, the affinity of n-butanol to β-CD could be determined by GDA (see Fig. 3b), log![[thin space (1/6-em)]](https://www.rsc.org/images/entities/char_2009.gif) Ka = 2.0, whereas IDA titrations required the addition of much larger amounts of the weakly binding guest and yielded poor mathematical fits, see Fig. S26 in the ESI.† (Besides, high concentrations of guests can cause deviations from unity activity coefficients and the experiments can face solubility limitations.)
Ka = 2.0, whereas IDA titrations required the addition of much larger amounts of the weakly binding guest and yielded poor mathematical fits, see Fig. S26 in the ESI.† (Besides, high concentrations of guests can cause deviations from unity activity coefficients and the experiments can face solubility limitations.)
Conversely, the IDA method should be chosen for soluble high-affinity guests. To exemplify, GDA yielded only an approximate binding constant for the β-CD⊃AdOH complex because the affinity of the commercially available indicator dye TNS41 (3.4), lay outside the recommended range for GDA, see below as well as Fig. 4. IDA titration gave reliably log![[thin space (1/6-em)]](https://www.rsc.org/images/entities/char_2009.gif) Ka = 5.0 for this host–guest pair. Use of recently developed high-affinity indicator dyes will increase the scope of the GDA method for cyclodextrins.43 Despite the complementarity of GDA and IDA for Ka value determination, GDA and IDA do not behave as exact “mirror images”, i.e. there are different requirements for the selection of suitable indicator dyes. Explicit mathematical simulations that are described in the ESI,† showed that GDA is best suited for log
Ka = 5.0 for this host–guest pair. Use of recently developed high-affinity indicator dyes will increase the scope of the GDA method for cyclodextrins.43 Despite the complementarity of GDA and IDA for Ka value determination, GDA and IDA do not behave as exact “mirror images”, i.e. there are different requirements for the selection of suitable indicator dyes. Explicit mathematical simulations that are described in the ESI,† showed that GDA is best suited for log![[thin space (1/6-em)]](https://www.rsc.org/images/entities/char_2009.gif) KHGa + 2 ≥ log
KHGa + 2 ≥ log![[thin space (1/6-em)]](https://www.rsc.org/images/entities/char_2009.gif) KHDa ≥ log
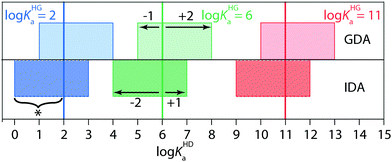
KHDa ≥ log![[thin space (1/6-em)]](https://www.rsc.org/images/entities/char_2009.gif) KHGa − 1 (see Fig. 4 and Fig. S1–S7 in the ESI†). On one hand, the indicator dye should not bind by more than a factor of 10 in Ka weaker than the guest, otherwise the indicator cannot efficiently displace the guest from the host–guest complex, resulting in a flat binding isotherm that is not accurately fitable. On the other hand, the indicator dye can bind up to a factor of 100 stronger than the guest and still produce a fitable binding isotherm. For instance, if a guest with a suspected binding affinity of 106 M−1 is tested by the GDA method, an indicator dye with a Ka-range of 105 to 108 M−1 should be selected (Fig. 4). In contrast, in IDA fitable binding isotherms are obtained if log
KHGa − 1 (see Fig. 4 and Fig. S1–S7 in the ESI†). On one hand, the indicator dye should not bind by more than a factor of 10 in Ka weaker than the guest, otherwise the indicator cannot efficiently displace the guest from the host–guest complex, resulting in a flat binding isotherm that is not accurately fitable. On the other hand, the indicator dye can bind up to a factor of 100 stronger than the guest and still produce a fitable binding isotherm. For instance, if a guest with a suspected binding affinity of 106 M−1 is tested by the GDA method, an indicator dye with a Ka-range of 105 to 108 M−1 should be selected (Fig. 4). In contrast, in IDA fitable binding isotherms are obtained if log![[thin space (1/6-em)]](https://www.rsc.org/images/entities/char_2009.gif) KHGa + 1 ≥ log
KHGa + 1 ≥ log![[thin space (1/6-em)]](https://www.rsc.org/images/entities/char_2009.gif) KHDa ≥ log
KHDa ≥ log![[thin space (1/6-em)]](https://www.rsc.org/images/entities/char_2009.gif) KHGa − 2 holds true.
KHGa − 2 holds true.
 | ||
| Fig. 4 Performance analysis of the competitive binding assays GDA and IDA (see best practice guide in the ESI†). | ||
Thus, for the same guest with Ka ∼ 106 M−1 a suitable IDA indicator dye can be found in the affinity range of 104 to 107 M−1. Experimentally, these predictions were verified for the example case of CB7 as the host and cadaverine as the guest, that required the use of MDAP44 and berberine as indicator dyes for GDA and IDA binding titrations, respectively (Table 1 and Fig. S18 (ESI†), for chemical structures of the dyes see Fig. 2b).
In conclusion, it was shown that the guest-displacement assay enables the binding affinity determination of spectroscopically silent host–guest and protein–ligand pairs. The GDA method is applicable also for insoluble, e.g. hydrophobic, guests and for weakly binding guests, both of which escaped binding affinity determinations by state-of-the-art direct-binding and indicator-displacement assays. Moreover, the GDA method will be beneficial for conducting full binding titrations with gaseous hydrocarbons45 and noble gases7,46 as guests whose concentration can be readily fixed to their solubility. The extension to other hosts and supramolecular systems that bind guest molecules, e.g. cages, will be possible.
This work was financially supported through grants by the Emmy-Noether Programme of the DFG. We thank Dr Hans Dolhaine for helpful discussions.
Conflicts of interest
There are no conflicts of interest to declare.Notes and references
- H. Adams, F. J. Carver, C. A. Hunter, J. C. Morales and E. M. Seward, Angew. Chem., Int. Ed. Engl., 1996, 35, 1542–1544 CrossRef CAS.
- I. K. Mati and S. L. Cockroft, Chem. Soc. Rev., 2010, 39, 4195–4205 RSC.
- P. Thordarson, Chem. Soc. Rev., 2011, 40, 1305–1323 RSC.
- E. Persch, O. Dumele and F. Diederich, Angew. Chem., Int. Ed., 2015, 54, 3290–3327 CrossRef CAS PubMed.
- F. Biedermann and H.-J. Schneider, Chem. Rev., 2016, 116, 5216–5300 CrossRef CAS PubMed.
- J. Řezáč and P. Hobza, Chem. Rev., 2016, 116, 5038–5071 CrossRef.
- S. He, F. Biedermann, N. Vankova, L. Zhechkov, T. Heine, R. E. Hoffman, A. De Simone, T. T. Duignan and W. M. Nau, Nat. Chem., 2018, 10, 1252–1257 CrossRef CAS.
- F. Jia, H. Hupatz, L. P. Yang, H. V. Schroder, D. H. Li, S. Xin, D. Lentz, F. Witte, X. Xie, B. Paulus, C. A. Schalley and W. Jiang, J. Am. Chem. Soc., 2019, 141, 4468–4473 CrossRef CAS PubMed.
- D.-S. Guo, V. D. Uzunova, K. I. Assaf, A. I. Lazar, Y. Liu and W. M. Nau, Supramol. Chem., 2016, 28, 384–395 CrossRef CAS.
- K. I. Assaf and W. M. Nau, Angew. Chem., Int. Ed., 2018, 57, 13968–13981 CrossRef CAS PubMed.
- P. Remón, D. González, M. A. Romero, N. Basílio and U. Pischel, Chem. Commun., 2020, 56, 3737–3740 RSC.
- F. Hof, S. L. Craig, C. Nuckolls and J. J. Rebek, Angew. Chem., Int. Ed., 2002, 41, 1488–1508 CrossRef CAS PubMed.
- J. Murray, K. Kim, T. Ogoshi, W. Yao and B. C. Gibb, Chem. Soc. Rev., 2017, 46, 2479–2496 RSC.
- E. C. Hulme and M. A. Trevethick, Br. J. Pharmacol., 2010, 161, 1219–1237 CrossRef CAS PubMed.
- L. You, D. Zha and E. V. Anslyn, Chem. Rev., 2015, 115, 7840–7892 CrossRef CAS PubMed.
- S. Sinn and F. Biedermann, Isr. J. Chem., 2018, 58, 357–412 CrossRef CAS.
- S. L. Wiskur, H. Ait-Haddou, J. J. Lavigne and E. V. Anslyn, Acc. Chem. Res., 2001, 34, 963–972 CrossRef CAS PubMed.
- D. J. Cram and G. M. Lein, J. Am. Chem. Soc., 1985, 107, 3657–3668 CrossRef CAS.
- S. Zhang, L. Grimm, Z. Miskolczy, L. Biczók, F. Biedermann and W. M. Nau, Chem. Commun., 2019, 55, 14131–14134 RSC.
- S. Dixit, J. Crain, W. C. K. Poon, J. L. Finney and A. K. Soper, Nature, 2002, 416, 829–832 CrossRef CAS PubMed.
- M. Rosés, C. Ràfols, J. Ortega and E. Bosch, J. Chem. Soc., Perkin Trans. 2, 1995, 1607–1615 RSC.
- V. Francisco, A. Piñeiro, W. M. Nau and L. García-Río, Chem. – Eur. J., 2013, 19, 17809–17820 CrossRef CAS PubMed.
- F. Sommer, Y. Marcus and S. Kubik, ACS Omega, 2017, 2, 3669–3680 CrossRef CAS PubMed.
- S. Liu, P. Y. Zavalij and L. Isaacs, J. Am. Chem. Soc., 2005, 127, 16798–16799 CrossRef CAS PubMed.
- D. Shetty, J. K. Khedkar, K. M. Park and K. Kim, Chem. Soc. Rev., 2015, 44, 8747–8761 RSC.
- J. Kim, I. S. Jung, S. Y. Kim, E. Lee, J. K. Kang, S. Sakamoto, K. Yamaguchi and K. Kim, J. Am. Chem. Soc., 2000, 122, 540–541 CrossRef CAS.
- W. M. Nau, M. Florea and K. I. Assaf, Isr. J. Chem., 2011, 51, 559–577 CrossRef CAS.
- S. J. Barrow, S. Kasera, M. J. Rowland, J. del Barrio and O. A. Scherman, Chem. Rev., 2015, 115, 12320–12406 CrossRef CAS.
- K. A. Connors, J. Pharm. Sci., 1995, 84, 843–848 CrossRef CAS PubMed.
- J. Szejtli, Chem. Rev., 1998, 98, 1743–1754 CrossRef CAS PubMed.
- V. D. Uzunova, C. Cullinane, K. Brix, W. M. Nau and A. I. Day, Org. Biomol. Chem., 2010, 8, 2037–2042 RSC.
- K. M. Park, J. A. Yang, H. Jung, J. Yeom, J. S. Park, K. H. Park, A. S. Hoffman, S. K. Hahn and K. Kim, ACS Nano, 2012, 6, 2960–2968 CrossRef CAS PubMed.
- M. J. Rowland, C. C. Parkins, J. H. McAbee, A. K. Kolb, R. Hein, X. J. Loh, C. Watts and O. A. Scherman, Biomaterials, 2018, 179, 199–208 CrossRef CAS.
- M. E. Davis and M. E. Brewster, Nat. Rev. Drug Discovery, 2004, 3, 1023 CrossRef CAS.
- M. E. Brewster and T. Loftsson, Adv. Drug Delivery Rev., 2007, 59, 645–666 CrossRef CAS.
- D. Ma, G. Hettiarachchi, D. Nguyen, B. Zhang, J. B. Wittenberg, P. Y. Zavalij, V. Briken and L. Isaacs, Nat. Chem., 2012, 4, 503–510 CrossRef CAS.
- A. I. Lazar, F. Biedermann, K. R. Mustafina, K. I. Assaf, A. Hennig and W. M. Nau, J. Am. Chem. Soc., 2016, 138, 13022–13029 CrossRef CAS.
- N. Basílio and U. Pischel, Chem. – Eur. J., 2016, 22, 15208–15211 CrossRef.
- Å. Frostell-Karlsson, A. Remaeus, H. Roos, K. Andersson, P. Borg, M. Hämäläinen and R. Karlsson, J. Med. Chem., 2000, 43, 1986–1992 CrossRef.
- V. Maes, Y. Engelborghs, J. Hoebeke, Y. Maras and A. Vercruysse, Mol. Pharmacol., 1982, 21, 100–107 CAS.
- R. N. Dsouza, U. Pischel and W. M. Nau, Chem. Rev., 2011, 111, 7941–7980 CrossRef CAS PubMed.
- S. Sinn, E. Spuling, S. Bräse and F. Biedermann, Chem. Sci., 2019, 10, 6584–6593 RSC.
- K. I. Assaf, O. Suckova, N. Al Danaf, V. von Glasenapp, D. Gabel and W. M. Nau, Org. Lett., 2016, 18, 932–935 CrossRef CAS PubMed.
- V. Sindelar, M. A. Cejas, F. M. Raymo and A. E. Kaifer, New J. Chem., 2005, 29, 280–282 RSC.
- M. Florea and W. M. Nau, Angew. Chem., Int. Ed., 2011, 50, 9338–9342 CrossRef CAS PubMed.
- G. Huber, T. Brotin, L. Dubois, H. Desvaux, J.-P. Dutasta and P. Berthault, J. Am. Chem. Soc., 2006, 128, 6239–6246 CrossRef CAS PubMed.
Footnote |
| † Electronic supplementary information (ESI) available: Materials and methods, experimental details, as well as fitting equations. See DOI: 10.1039/d0cc01841d |
| This journal is © The Royal Society of Chemistry 2020 |


