
 Open Access Article
 This Open Access Article is licensed under a
 Creative Commons Attribution 3.0 Unported Licence
Surface modification strategy for fluorescence solvatochromism of carbon dots prepared from p-phenylenediamine†
Kohei
Sato
,
Rina
Sato
,
Yoshiki
Iso
 * and
Tetsuhiko
Isobe
*
* and
Tetsuhiko
Isobe
*
Department of Applied Chemistry, Faculty of Science and Technology, Keio University, 3-14-1 Hiyoshi, Kohoku-ku, Yokohama 223-8522, Japan. E-mail: iso@applc.keio.ac.jp; isobe@applc.keio.ac.jp
First published on 15th January 2020
Abstract
The fluorescence solvatochromism of p-phenylenediamine-derived carbon dots (CDs) was modulated through surface modification with decanoic acid or perfluorodecanoic acid. This is attributed to the adjustment of the dipole interaction between solvent molecules and the CD surface in terms of steric hindrance of a surface modifier and polarization of the modified CD surface.
Fluorescent carbon nanomaterials, known as carbon dots (CDs), have attracted much attention since their discovery in 2004.1 CDs have low toxicity and are biocompatible because they do not contain toxic elements such as lead and cadmium; therefore, CDs are expected to be good alternatives to semiconductor quantum dots such as CsPbX3 (X = Cl, Br, I) and CdSe/ZnS. Additional features of CDs are high photostability against near-UV light2 and high thermal stability.3 Because of these advantages, CDs are also good alternatives to organic dyes. CDs have been demonstrated to have applications as spectral converters for near-UV and blue light-emitting diodes,4,5 fluorescent bio-markers in bioimaging,6,7 and sensors for the toxic metal ion Hg2+.8
Most previous works have reported blue-emitting CDs.9–11 Studies on the production of multi-colour emission in addition to blue have been started recently. The following three important factors affect the emission wavelength of CDs: π-conjugated domain size related to the particle size and graphitization degree,5,12,13 heteroatom doping,6,14,15 and surface functional groups.16,17 It is difficult to manage these factors independently; therefore, strategies for controlling the emission colours of CDs have not been established thus far.
Recently, it was found that the emission colour of CDs depends on the polarity of the solvent in which CDs are dispersed.7,18–21 This phenomenon is called fluorescence solvatochromism, which is well known for organic dyes. The emission colour of CDs prepared from p-phenylenediamine (p-PD) changed from green to red with increasing solvent polarity due to positive fluorescence solvatochromism.7,18,19,21 Wang et al. prepared CDs from p-PD in diphenyl ether via a hot injection method at 250 °C for 8 h.18 Zhang et al. also prepared CDs from p-PD in toluene, cyclohexane, dimethylformamide, ethanol, and water via a solvothermal method at 200 °C for 5 h.19
Fluorescence solvatochromism is attributed to the difference in the dipole moments in the ground state and the excited state.22 If electrically neutral molecules have a larger dipole moment in the excited state than in the ground state, the excited state becomes more stabilized with increasing solvent polarity. As a result, the energy gap between the highest occupied molecular orbital and the lowest unoccupied molecular orbital decreases, leading to redshifted emission of CDs, i.e., positive fluorescence solvatochromism.22,23 Thus, the emission colour of CDs can be readily controlled by solvent polarity. Furthermore, the emission shift due to fluorescence solvatochromism can be modified by introducing electron-donating or electron-withdrawing substituents into organic dyes.24,25 Hence, it is expected that the fluorescence solvatochromism of CDs can be controlled through surface modification as well as solvent polarity.
To improve the photoluminescence (PL) intensity, CD surfaces have been modified with polymers26 and other molecules.10 Another purpose of this surface modification is to tune the emission colour of the CDs in a given solvent.27,28 However, controlling the fluorescence solvatochromism of CDs through surface modification has not yet been studied.
In the present study, we propose a novel strategy for controlling the fluorescence solvatochromism of CDs through surface modification. We chose p-PD-derived CDs as a target material. Since fluorescence solvatochromism of these CDs is induced by dipole interactions between the CD surface and a solvent, we expected that the shift of the emission wavelength of CDs as a result of solvent polarity can be tuned by controlling the polarization of the CD surface. To verify this speculation, surface modification of p-PD-derived CDs was performed via dehydration of the amino group on the CD surface and the carboxy group in carboxylic acid, as shown in Fig. 1; decanoic acid (DA) and perfluorodecanoic acid (PFDA) with strongly electron-withdrawing fluorine atoms were used for surface modification.
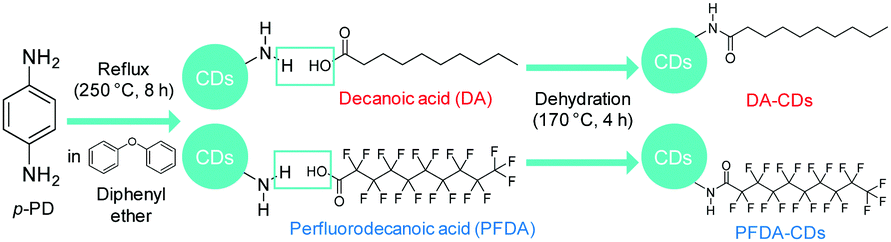 | ||
| Fig. 1 Schematic illustration of the surface modification of p-PD-derived CDs with DA and PFDA. | ||
Fourier transform infrared (FT-IR) spectra of CDs, DA-CDs, PFDA-CDs, p-PD, DA, and PFDA are shown in Fig. 2. The details of the FT-IR assignments are given in the ESI† (see Fig. S1 and Tables S1–S3). The CDs retained the amino group in p-PD, as confirmed by the N–H stretching vibrations of the NH2 group at 3420–3320 cm−1. In contrast, for DA-CDs, the N–H stretching vibration of the amide bond was observed at 3320 cm−1. Furthermore, for DA-CDs, the presence of the alkyl chain of DA was verified by the C–H stretching vibrations at 2960–2850 cm−1, which were not detected for the CDs. These results reveal that CDs are modified with DA through amide bonds to form DA-CDs, as already shown in Fig. 1.
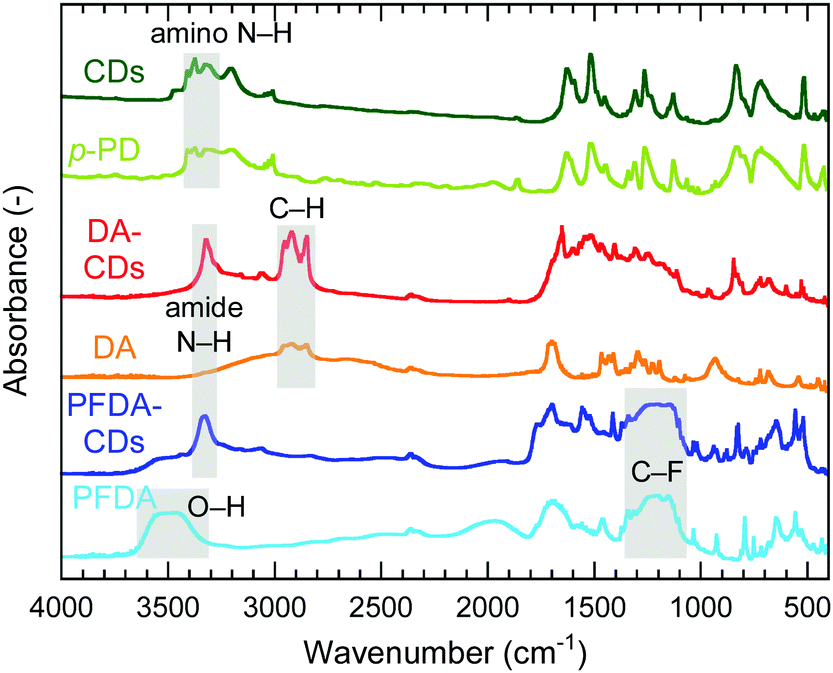 | ||
| Fig. 2 FT-IR spectra of CDs, p-PD, DA-CDs, DA, PFDA-CDs, and PFDA. | ||
For PFDA-CDs, the N–H stretching vibration of the amide bond was observed at 3330 cm−1. Furthermore, the presence of the perfluoroalkyl chain of PFDA in PFDA-CDs was verified by the C–F stretching vibrations at 1350–1100 cm−1, which were not detected for the CDs. For PFDA-CDs, the O–H stretching vibration of the carboxy group of PFDA was not observed at 3600–3400 cm−1, which reveals that CDs are modified with PFDA through amide bonds to form PFDA-CDs, as already shown in Fig. 1.
C 1s, N 1s, and O 1s peaks were observed in the wide-scan X-ray photoelectron spectroscopy (XPS) spectra of all samples, as shown in Fig. S2 (ESI†). In addition, the F 1s peak was also observed for PFDA-CDs. Narrow-scan C 1s and F 1s spectra are shown in Fig. 3. For PFDA-CDs, the C–F peak assigned to the perfluoroalkyl group, CF2 and CF3, was observed at 290.9 and 293.0 eV, respectively, in the C 1s spectrum and at 688.1 eV in the F 1s spectrum.29,30 This result reveals that the CD surface was successfully modified with PFDA to form PFDA-CDs. The C 1s spectrum of CDs was composed of C–C/C![[double bond, length as m-dash]](https://www.rsc.org/images/entities/char_e001.gif) C (284.4 eV) and C–N (285.3 eV) peaks,18,31 whereas the C 1s spectra of DA-CDs and PFDA-CDs contained OC–N–H peaks due to amide bonds (287.1–287.8 eV)32 in addition to C–C/C C and C–N peaks.
C (284.4 eV) and C–N (285.3 eV) peaks,18,31 whereas the C 1s spectra of DA-CDs and PFDA-CDs contained OC–N–H peaks due to amide bonds (287.1–287.8 eV)32 in addition to C–C/C C and C–N peaks.
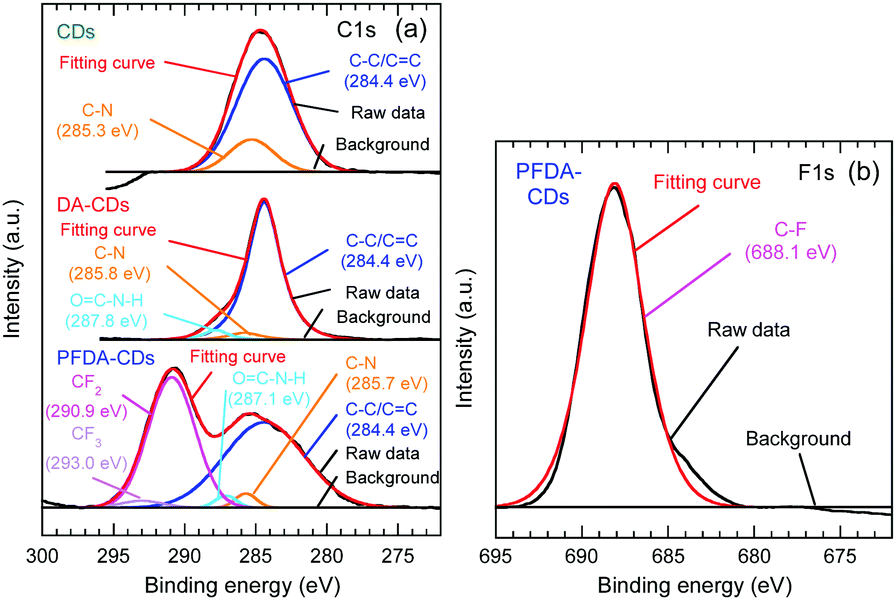 | ||
| Fig. 3 (a) C 1s XPS spectra of CDs, DA-CDs, and PFDA-CDs. (b) F 1s XPS spectra of PFDA-CDs. | ||
The N 1s spectrum of CDs (Fig. S2, ESI†) exhibited pyridinic N (398.0 eV), amino N (399.8 eV), and pyrrolic N (400.7 eV) peaks.18,31 An OC–N–H peak due to an amide bond (399.5–400.1 eV) instead of an amino N peak was observed in the N 1s spectra of DA-CDs and PFDA-CDs,10,32 which reveals that the CD surface was successfully modified with DA and PFDA to form DA-CDs and PFDA-CDs, respectively. In addition, the O 1s spectra of CDs, DA-CDs, and PFDA-CDs (Fig. S2, ESI†) exhibited CO (530.4–531.2 eV) and C–O (532.1–532.5 eV) peaks.7,19
Transmission electron microscope (TEM) images and particle size distributions are shown in Fig. S3 (ESI†). The average diameter of CDs, DA-CDs, and PFDA-CDs were 10.4 ± 3.5, 24.5 ± 10.4, and 9.6 ± 3.8 nm, respectively. The larger size of DA-CDs was attributed to aggregation due to hydrophobic interaction between surface modifiers. This was also confirmed from atomic force microscope (AFM) images (Fig. S4, ESI†).
Photographs of the CD, DA-CD, and PFDA-CD dispersions in chloroform and methanol (100 mg L−1) under white light are shown in Fig. 4. The CDs were completely dispersed under ultrasonication. In contrast, the DA-CDs and PFDA-CDs were not completely dispersed even after ultrasonication. In particular, aggregates floated on the top of the chloroform dispersion of DA-CDs. Chloroform and methanol dispersions of CDs were yellowish-brown and orange under white light, respectively. The DA-CD and PFDA-CD dispersions were brown and colourless in chloroform and brown and light pink in methanol under white light, respectively. This colour change is attributed to the change in light absorption properties in the visible region due to surface modification.
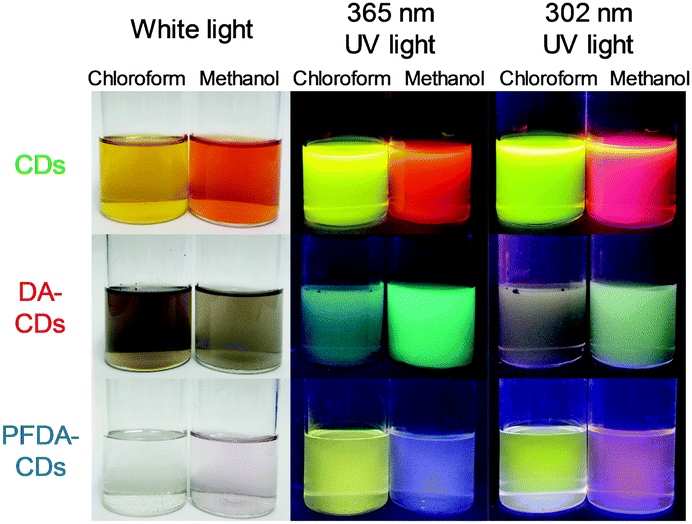 | ||
| Fig. 4 Photographs of CDs, DA-CDs, and PFDA-CDs in chloroform and methanol under white light, 365 nm UV light, and 302 nm UV light. | ||
Photographs of the CD, DA-CD, and PFDA-CD dispersions in chloroform and methanol (100 mg L−1) under 365 nm UV light are shown in Fig. 4. The CD dispersions exhibited yellowish-green and reddish orange emission in chloroform and methanol, respectively. In contrast, the DA-CD dispersions exhibited bluish-green and green emission in chloroform and methanol, respectively. In addition, the PFDA-CD dispersions exhibited yellow and blue emission in chloroform and methanol, respectively. These results revealed that such emission colour changes due to fluorescence solvatochromism depended on not only solvent polarity but also surface modification. The normalized PL spectra of the CD, DA-CD, and PFDA-CD dispersions in chloroform and methanol (25 mg L−1) under 365 nm excitation are shown in Fig. S5 (ESI†). Each PL spectrum corresponded to the observed emission colour except the methanol dispersion of PFDA-CDs, whose actual emission colour was assumed to be red from the PL spectrum, but the apparent emission colour was blue. This difference is due to the purple light component from the 365 nm UV lamp. In fact, the methanol dispersion of the PFDA-CDs exhibited red emission under 302 nm UV light, which did not have a purple light component, as also shown in Fig. 4.
The PL spectra of the chloroform and methanol dispersions of CDs, DA-CDs and PFDA-CDs are shown in Fig. 5. The PL peak wavelengths and shifts are summarized in Table S4 (ESI†). The emission peak of CDs redshifted by 55 nm when the dispersion solvent was changed from slightly polar chloroform to highly polar methanol. This redshift is attributed to positive fluorescence solvatochromism. In contrast, the redshift for DA-CDs was only 3 nm. Fluorescence solvatochromism is caused by dipole interactions between solvent molecules and the CD surface, including H-bonding interaction; therefore, the smaller redshift for DA-CDs is attributed to suppression of the dipole interaction between the solvent molecules and the CD surface (i) by steric hindrance of long alkyl chains and (ii) by decreasing the surface polarization of CDs through introduction of slightly polarized alkyl chains.
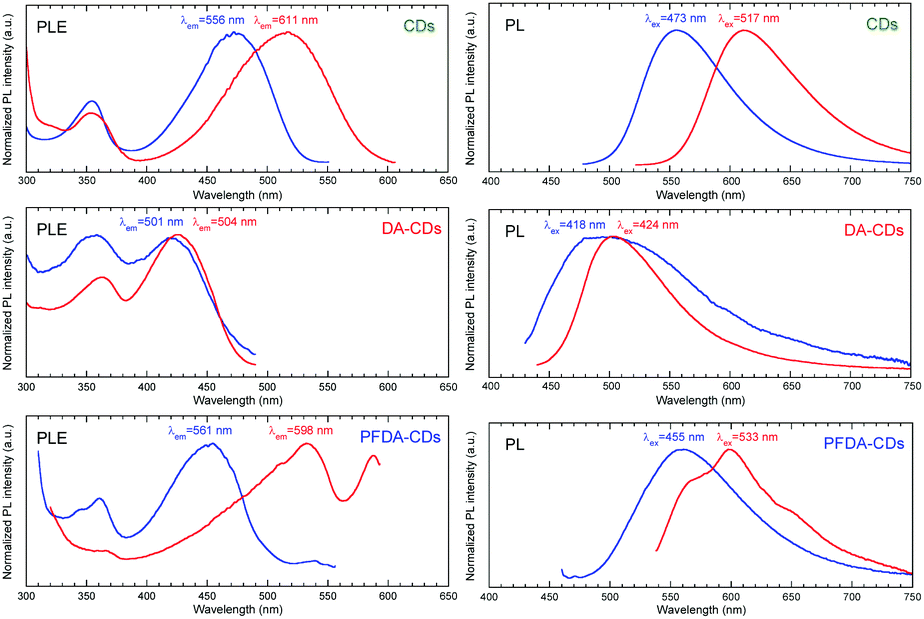 | ||
| Fig. 5 Normalized PLE and PL spectra of CDs, DA-CDs, and PFDA-CDs in chloroform (blue) and methanol (red). | ||
The redshift of the emission peak for PFDA-CDs was 37 nm. The order of the emission peak shift was DA-CDs < PFDA-CDs < CDs. This result is attributed to two opposite factors: (i) enhanced dipole interaction between solvent molecules and the CD surface by introduction of strong electron-withdrawing perfluoroalkyl chains with highly polarized C–F bonds33,34 and (ii) suppressed dipole interaction by steric hindrance of long perfluoroalkyl chains. Multiple emission components were observed for PFDA-CDs in methanol, which may be attributed to the presence of multiple emission states corresponding to different lengths of the π-conjugated structure.
Excitation spectra of the chloroform and methanol dispersions of CDs, DA-CDs, and PFDA-CDs are shown in Fig. 5. The photoluminescence excitation (PLE) peak wavelengths and shifts are summarized in Table S4 (ESI†). The excitation peak for each high-polarity methanol dispersion was located at a longer wavelength than that for each low-polarity chloroform dispersion. Thus, similar positive solvatochromism was also observed in the excitation spectra. The redshift of the excitation peak for the CDs was 44 nm, while the redshift for the DA-CDs was 6 nm. The smaller shift of the excitation peak of the DA-CDs is attributed to suppression of the dipole interaction between solvent molecules and the CD surface (i) by steric hindrance of long alkyl chains and (ii) by decreasing the surface polarization of CDs through introduction of slightly polarized alkyl chains. In addition, the redshift of the excitation peak for the PFDA-CDs was 78 nm, which was larger than that of the CDs. This finding might be explained by the enhanced dipole interaction between solvent molecules and the CD surface by the introduction of strong electron-withdrawing perfluoroalkyl chains with highly polarized C–F bonds, which was more effective than the suppression of the dipole interaction by steric hindrance of the long perfluoroalkyl chains.
The absolute PL quantum yields (QYs) of the CD, DA-CD, and PFDA-CD dispersions in chloroform and methanol are given in Table S5 (ESI†). The absolute PL QYs of the DA-CDs and PFDA-CDs were lower than that of the CDs, which is attributed to the following three factors. The first factor is non-radiative relaxation through vibration of the π-conjugated structure caused by vibration of the long-chain alkyl or perfluoroalkyl group, as described in a previous report,6 where non-radiative relaxation was inhibited by an increase in the rigidity of the π-conjugated structure in CDs. The second factor is the decreased amount of amino groups due to the conversion of amino groups to amide bonds through surface modification because amino groups play a role in surface passivation.15 The third factor is concentration quenching of fluorescence due to aggregation of particles through interactions between surface modifiers. In addition, the absolute PL QYs of the methanol dispersions were lower than those of the chloroform dispersions of CDs and PFDA-CDs, which is attributed to non-radiative relaxation through vibration of the O–H bond in methanol.19,21,23
The PL decay curves of the CD, DA-CD, and PFDA-CD dispersions in chloroform and methanol (25 mg L−1) are shown in Fig. S6 (ESI†). The parameters of the PL decay curves fitted by the biexponential equation are given in Table S6 (ESI†). The average PL lifetimes were decreased by surface modification, which is attributed to the three factors mentioned above for the decrease in PL QYs. Hence, the average PL lifetimes are correlated to absolute PL QYs, as shown in Fig. S6 (ESI†).
In summary, we successfully modulated the fluorescence solvatochromism of CDs by surface modification. p-PD-derived CDs were modified with DA and PFDA to form DA-CDs and PFDA-CDs, respectively. The emission peak for CDs in highly polar methanol redshifted by 55 nm compared with that in slightly polar chloroform due to fluorescence solvatochromism. In contrast, the redshift for DA-CDs was only 3 nm because of suppression of the dipole interaction between solvent molecules and the CD surface (i) by steric hindrance of long alkyl chains and (ii) by decreasing the surface polarization of CDs through introduction of slightly polarized alkyl chains. In contrast, the redshift for PFDA-CDs was 37 nm because of two opposite factors, i.e., (i) enhanced dipole interaction by introduction of strong electron-withdrawing perfluoroalkyl chains with highly polarized C–F bonds and (ii) suppression of dipole interactions by steric hindrance of long perfluoroalkyl chains. This work verifies that the shift in the emission of CDs due to fluorescence solvatochromism can be controlled by surface modification in terms of steric hindrance of surface modifiers and polarization of the modified CD surfaces. Therefore, this work introduces a new way to tune the emission wavelength of CDs for wider applications that require a broad colour range.
This work was supported by the Japan Society for the Promotion of Science via KAKENHI grant number JP19K22236.
Conflicts of interest
There are no conflicts to declare.Notes and references
- X. Xu, R. Ray, Y. Gu, H. J. Ploehn, L. Gearheart, K. Raker and W. A. Scrivens, J. Am. Chem. Soc., 2004, 126, 12736 CrossRef CAS PubMed.
- F. Yuan, Z. Wang, X. Li, Y. Li, Z. Tan, L. Fan and S. Yang, Adv. Mater., 2017, 29, 1604436 CrossRef.
- M. R. Nabid, Y. Bide and N. Fereidouni, New J. Chem., 2016, 40, 8823 RSC.
- Z. Tian, X. Zhang, D. Li, D. Zhou, P. Jing, D. Shen, S. Qu, R. Zboril and A. L. Rogach, Adv. Opt. Mater., 2017, 5, 1700416 CrossRef.
- X. Miao, D. Qu, D. Yang, B. Nie, Y. Zhao, H. Fan and Z. Sun, Adv. Mater., 2018, 30, 1704740 CrossRef.
- H. Ding, J.-S. Wei, P. Zhang, Z.-Y. Zhou, Q.-Y. Gao and H.-M. Xiong, Small, 2018, 14, 1800612 CrossRef PubMed.
- J. Xia, S. Chen, G.-Y. Zou, Y.-L. Yu and J.-H. Wang, Nanoscale, 2018, 10, 22484 RSC.
- Y. H. Yuan, Z. X. Liu, R. S. Li, H. Y. Zou, M. Lin, H. Liu and C. Z. Huang, Nanoscale, 2016, 8, 6770 RSC.
- Z.-A. Qiao, Y. Wang, Y. Gao, H. Li, T. Dai, Y. Liu and Q. Huo, Chem. Commun., 2010, 46, 8812 RSC.
- X. Zhai, P. Zhang, C. Liu, T. Bai, W. Li, L. Dai and W. Liu, Chem. Commun., 2012, 48, 7955 RSC.
- T. Yoshinaga, Y. Iso and T. Isobe, J. Lumin., 2019, 213, 6 CrossRef CAS.
- H. Li, X. He, Z. Kang, H. Huang, Y. Liu, J. Liu, S. Lian, C. H. A. Tsang, X. Yang and S.-T. Lee, Angew. Ch, Int. Ed.em., 2010, 49, 4430 ( Angew. Chem. , 2010 , 122 , 4532 ) CrossRef CAS PubMed.
- F. Yuan, T. Yuan, L. Sui, Z. Wang, Z. Xi, Y. Li, X. Li, L. Fan, Z. Tan, A. Chen, M. Jin and S. Yang, Nat. Commun., 2018, 9, 2249 CrossRef PubMed.
- S. Niino, S. Takeshita, Y. Iso and T. Isobe, J. Lumin., 2016, 180, 123 CrossRef CAS.
- K. Holá, M. Sudolská, S. Kalytchuk, D. Nachtigallová, A. L. Rogach, M. Otyepka and R. Zbořil, ACS Nano, 2017, 11, 12402 CrossRef PubMed.
- H. Ding, S.-B. Yu, J.-S. Wei and H.-M. Xiong, ACS Nano, 2016, 10, 484 CrossRef CAS PubMed.
- K. Yuan, X. Zhang, R. Qin, X. Ji, Y. Cheng, L. Li, X. Yang, Z. Lu and H. Liu, J. Mater. Chem. C, 2018, 6, 12631 RSC.
- H. Wang, C. Sun, X. Chen, Y. Zhang, V. L. Colvin, Q. Rice, J. Seo, S. Feng, S. Wang and W. W. Yu, Nanoscale, 2017, 9, 1909 RSC.
- T. Zhang, J. Zhu, Y. Zhai, H. Wang, X. Bai, B. Dong, H. Wang and H. Song, Nanoscale, 2017, 9, 13042 RSC.
- J. Ren, J. Sun, X. Sun, R. Song, Z. Xie and S. Zhou, Adv. Opt. Mater., 2018, 6, 1800115 CrossRef.
- R. Sato, Y. Iso and T. Isobe, Langmuir, 2019, 35, 15257 CrossRef CAS PubMed.
- J. R. Lakowicz, Principles of fluorescence spectroscopy, 3rd edn, Springer, New York, 2006 Search PubMed.
- A. Sciortino, E. Marino, B. van Dam, P. Schall, M. Cannas and F. Messina, J. Phys. Chem. Lett., 2016, 7, 3419 CrossRef CAS PubMed.
- N. Kumar, M. Paramasivam, J. Kumar, A. Gusain and P. K. Hota, Spectrochim. Acta, Part A, 2019, 206, 396 CrossRef CAS PubMed.
- A. Slodek, D. Zych, A. Maroń, R. Gawecki, A. Mrozek-Wilczkiewicz, K. Malarz and R. Musiol, J. Mol. Liq., 2019, 285, 515 CrossRef CAS.
- Y.-P. Sun, B. Zhou, Y. Lin, W. Wang, K. A. S. Fernando, P. Pathak, M. J. Meziani, B. A. Harruff, X. Wang, H. Wang, P. G. Luo, H. Yang, M. E. Kose, B. Chen, L. M. Veca and S.-Y. Xie, J. Am. Chem. Soc., 2006, 128, 7756 CrossRef CAS PubMed.
- Z. Zhang, Y. Pan, Y. Fang, L. Zhang, J. Chen and C. Yi, Nanoscale, 2016, 8, 500 RSC.
- H. Tetsuka, A. Nagoya, T. Fukusumi and T. Matsui, Adv. Mater., 2016, 28, 4632 CrossRef CAS.
- X. Zhao, Y. Su, W. Chen, J. Peng and Z. Jiang, J. Membr. Sci., 2012, 415–416, 824 CrossRef CAS.
- C. L. Arnold, D. J. Eyckens, L. Servinis, M. D. Nave, H. Yin, R. K. W. Marceau, J. Pinson, B. Demir, T. R. Walsh and L. C. Henderson, J. Mater. Chem. A, 2019, 7, 13483 RSC.
- K. Jiang, S. Sun, L. Zhang, Y. Lu, A. Wu, C. Cai and H. Lin, Angew. Chem., Int. Ed., 2015, 54, 5360 ( Angew. Chem. , 2015 , 127 , 5450 ) CrossRef CAS PubMed.
- J. Manioudakis, F. Victoria, C. A. Thompson, L. Brown, M. Movsum, R. Lucifero and R. Naccache, J. Mater. Chem. C, 2019, 7, 853 RSC.
- D. O’Hagan, Chem. Soc. Rev., 2008, 37, 308 RSC.
- T. Hasegawa, Chem. Rec., 2017, 17, 903 CrossRef CAS.
Footnote |
| † Electronic supplementary information (ESI) available: Experimental details, supporting texts, Fig. S1–S6, and Tables S1–S6. See DOI: 10.1039/c9cc09333h |
| This journal is © The Royal Society of Chemistry 2020 |