 Open Access Article
Creative Commons Attribution 3.0 Unported Licence
Single crystal structure and opto-electronic properties of oxidized Spiro-OMeTAD†
Wei
Zhang
 a,
Linqin
Wang
b,
Yu
Guo
a,
Biaobiao
Zhang
a,
Linqin
Wang
b,
Yu
Guo
a,
Biaobiao
Zhang
 b,
Valentina
Leandri
a,
Bo
Xu
 b,
Zhuofeng
Li
 a,
James M.
Gardner
 a,
Licheng
Sun
 bc and
Lars
Kloo
 *a
*a
aDepartment of Chemistry, Applied Physical Chemistry, KTH Royal Institute of Technology, SE-10044 Stockholm, Sweden. E-mail: lakloo@kth.se
bDepartment of Chemistry, Organic Chemistry, KTH Royal Institute of Technology, SE-10044 Stockholm, Sweden
cState Key Laboratory of Fine Chemicals, DUT-KTH Joint Research Center on Molecular Devices, Dalian University of Technology (DUT), 116024 Dalian, China
First published on 3rd January 2020
Abstract
Single crystals of Spiro(TFSI)2 were grown, the optical and electronic properties were characterized and compared with neutral Spiro-OMeTAD. Density-functional theory was used to get insights into binding and band structure properties. The flat valence bands indicate a rather limited orbital overlap in Spiro(TFSI)2.
As one of the most widely used organic hole-transport materials in solid-state, mesoscopic solar cells, 2,2′,7,7′-tetrakis[N,N-di(4-methoxyphenyl)amino]-9,9′-spirobifluorene (Spiro-OMeTAD) was first reported by Salbeck in blue electroluminescence devices1 and then applied by Bach and co-workers in solar cells in 1998.2 Since then, thousands of studies have been conducted involving Spiro-OMeTAD as hole-transport material (HTM), especially in solid-state dye-sensitized solar cells3 (ssDSSCs) and perovskite solar cells (PSCs).4 Nowadays, although several alternatives have been reported,5,6 Spiro-OMeTAD is still considered as one of the best materials and has become the reference for perovskite solar cells.7–9 Chemical doping to oxidize Spiro-OMeTAD is very important to improve the hole mobility and conductivity with respect to the pristine material.10–12 With doping, oxidized Spiro-OMeTAD, such as Spiro+ and/or Spiro2+ (denoting singly and doubly oxidized Spiro-OMeTAD), is formed and the charge-carrier density is increased. However, it is unclear what is actually formed in the doping process.13,14 Exact knowledge becomes extremely important when aiming to assign for instance the light-absorption peaks of oxidized Spiro-OMeTAD. Some previous studies show that Spiro+ and Spiro2+ display very similar absorption features but different absorption intensities.15 However, some studies indicate that the light-absorption peaks for Spiro+ and Spiro2+ should be different, and the peak observed at around 521 nm should be assigned to Spiro+, while the peak observed at around 691 nm should be attributed to Spiro2+.16,17 In order to clarify this question, determining the absorption peaks directly by dissolving the single crystals of oxidized Spiro-OMeTAD would be the best option. Moreover, understanding of the structure of oxidized Spiro-OMeTAD, as well as its optical and electronic properties, will give insights into hole-transport mechanisms in doped Spiro-OMeTAD.
The structure of Spiro-OMeTAD was not reported until 2016 by Bakr et al., on the basis of single crystals obtained by an anti-solvent method.18 The resulting crystal structure shows a triclinic lattice system belonging to the P![[1 with combining macron]](https://www.rsc.org/images/entities/char_0031_0304.gif) space group. It was found that the Spiro-OMeTAD molecules form dimers in the structure, and one of the fluorenes is slightly curved. The closest distance between two fluorene rings is estimated to be about 3.8 Å, which is close enough to provide significant electronic coupling between stacked conjugated fragments. However, the steric hindrance between the outer fragments of each molecule prevents the formation of a continuous π–π stacking pattern, which eventually results in a low hole mobility and conductivity. Very recently, a similar method involving ethyl acetate was used to grow Spiro-OMeTAD crystals up to several millimeters.19 The properties of the crystals and the films were compared, and it was found that the crystal displays much higher conductivity and hole mobility. This was attributed to the better interphenylene π–π stacking in the Spiro-OMeTAD crystals. Although oxidation was mentioned in their work, neither the structure of partially oxidized Spiro-OMeTAD nor the structure of fully oxidized Spiro-OMeTAD were reported.
space group. It was found that the Spiro-OMeTAD molecules form dimers in the structure, and one of the fluorenes is slightly curved. The closest distance between two fluorene rings is estimated to be about 3.8 Å, which is close enough to provide significant electronic coupling between stacked conjugated fragments. However, the steric hindrance between the outer fragments of each molecule prevents the formation of a continuous π–π stacking pattern, which eventually results in a low hole mobility and conductivity. Very recently, a similar method involving ethyl acetate was used to grow Spiro-OMeTAD crystals up to several millimeters.19 The properties of the crystals and the films were compared, and it was found that the crystal displays much higher conductivity and hole mobility. This was attributed to the better interphenylene π–π stacking in the Spiro-OMeTAD crystals. Although oxidation was mentioned in their work, neither the structure of partially oxidized Spiro-OMeTAD nor the structure of fully oxidized Spiro-OMeTAD were reported.
Herein, we report the structure of an oxidized Spiro-OMeTAD, Spiro(TFSI)2. Results from density-functional theory (DFT) calculations offer insights both regarding chemical bonding and band structure of the compounds. Further, by dissolving the crystals in acetonitrile, the UV/visible absorption and chemical stability of Spiro2+ in solution can be investigated. The redox potential, hole mobility and conductivity of Spiro(TFSI)2 were also studied and compared with Spiro-OMeTAD.
Spiro(TFSI)2 was synthesized by reacting Spiro-OMeTAD with silver bis(trifluoromethanesulfonyl)imide (AgTFSI) according to a reported procedure,20 synthetic route is shown in Scheme S1 (ESI†). The structure was verified by both elemental analysis (EA) and nuclear magnetic resonance (NMR) spectroscopy. As expected, the elemental contents correspond well with the expected ratios in the compound. However, the proton NMR spectra could not be successfully obtained for Spiro(TFSI)2 in deuterated dimethyl sulfoxide solution due to the paramagnetic property of the cation. The Spiro2+ looses its two electrons from the two separate fluorene rings, which can be regarded as electronically orthogonal, and therefore an open-shell triplet state of the cation in Spiro(TFSI)2 is obtained. DFT calculations were conducted in order to compare the energy difference between the Spiro2+ singlet state and the corresponding triplet state. It was found that the triplet is 15.5 kcal mol−1 lower in energy than the singlet state and thus a more likely product of double oxidation. The triplet state of Spiro2+ was also confirmed from electron paramagnetic resonance (EPR) spectroscopy results (Fig. S1, ESI†), which are in accordance with previously reported results on Spiro(PF6)2.21 Although informative proton NMR spectra are not possible to obtain, the fluorine NMR spectra from the anions were obtainable. As a result, only one peak at −78.6 ppm was observed, and since a fast exchanging system involving TFSI− appears unlikely, a single chemical environment for fluorine atoms is a more likely case for Spiro(TFSI)2. A typical 19F NMR spectrum is shown in Fig. S2 (ESI†).
The structure of Spiro(TFSI)2 (CCDC deposit number 1965026†) was investigated using single-crystal X-ray diffraction, the crystallographic data are shown in Table S1 (ESI†). Fig. S3 (ESI†) shows the optical image of a single crystal with octahedral shape. Comparison between the geometries of molecular Spiro-OMeTAD in its neutral (CCDC deposit number 1475944)18 and its oxidized forms shows rather modest differences in the geometric structure. The spiro-bifluorene core geometry responds to the oxidation with a decrease of the C7–C7′ bond distance (indicated in Scheme 1) that connects the two phenyl rings in the same fluorene unit (from 1.469 Å for the neutral species to 1.434 Å for Spiro2+). The distance of C–N bonds including C4–N8, N8–C9 and N8–C10 in the triphenylamine group also decrease slightly, together with the lower angles Φ observed (from 121.63° to 121.09°) and θ (from 115.54° to 114.68°). The dihedral angle Φ characterizes the out-of-plane distortion of the methoxy-group-substituted (MeO–) phenyls with respect to the fluorene moieties, while the angle θ describes disturbance of the MeO–group from the outermost molecular environment with respect to phenyl rings. The decrease in C–N bond distances and angles observed are not the same as a prediction from calculations,15 in which effects of anions and crystal packing may be overlooked. Details of geometrical parameters in Spiro-OMeTAD and Spiro(TFSI)2 are shown in Table 1.
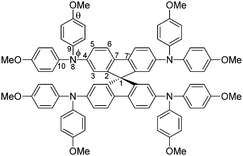 | ||
| Scheme 1 Molecular structure and labels of the main geometrical parameters of Spiro-OMeTAD molecule/ions. | ||
| Parameters | Spiro-OMeTAD | Spiro(TFSI)2 |
|---|---|---|
| a Bond distances in Å and angles in degrees. b See Scheme 1 for labels. | ||
| C1–C2 | 1.525 | 1.523 |
| C2–C3 | 1.380 | 1.372 |
| C2–C7 | 1.400 | 1.419 |
| C3–C4 | 1.400 | 1.417 |
| C4–C5 | 1.403 | 1.410 |
| C4–N8 | 1.414 | 1.393 |
| C5–C6 | 1.387 | 1.377 |
| C6–C7 | 1.391 | 1.402 |
| C7–C7 | 1.469 | 1.434 |
| N8–C9 | 1.423 | 1.418 |
| N8–C10 | 1.431 | 1.427 |
| Φ | 121.63 | 121.09 |
| θ | 115.54 | 114.68 |
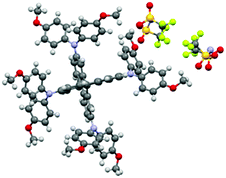
Spiro-OMeTAD crystallized in the triclinic P![[1 with combining macron]](https://www.rsc.org/images/entities/char_0031_0304.gif) (2) space group, whereas Spiro(TFSI)2 crystallizes in the orthorhombic Fddd (70) space group. As shown in Fig. 1, the structure of Spiro(TFSI)2 does not show strong twisting in the central fluorene rings. Also, because of the anions involved, the Spiro2+ molecules have been pushed away from each other and no direct contacts between the fluorene rings can be observed. The closest distance between two Spiro2+ ions is around 3.8 Å, as shown in Fig. S4 (ESI†). This contact does not represent a π–π interaction, and the distance is too long for carbon-orbital overlap and thus will not likely facilitate intermolecular charge transfer in Spiro(TFSI)2 crystals. It is not possible to directly deduce which atoms that loose electrons from the structural data, as the position of TFSI− does not communicate such information. This is further complicated by structural disorder of the anions. The unit cell of Spiro(TFSI)2 is much larger than that of Spiro-OMeTAD, details are shown in Table S2 (ESI†). The powder X-ray diffraction pattern of Spiro(TFSI)2 compared with a simulation from single crystal-data are quite similar, as shown in Fig. S5 (ESI†).
(2) space group, whereas Spiro(TFSI)2 crystallizes in the orthorhombic Fddd (70) space group. As shown in Fig. 1, the structure of Spiro(TFSI)2 does not show strong twisting in the central fluorene rings. Also, because of the anions involved, the Spiro2+ molecules have been pushed away from each other and no direct contacts between the fluorene rings can be observed. The closest distance between two Spiro2+ ions is around 3.8 Å, as shown in Fig. S4 (ESI†). This contact does not represent a π–π interaction, and the distance is too long for carbon-orbital overlap and thus will not likely facilitate intermolecular charge transfer in Spiro(TFSI)2 crystals. It is not possible to directly deduce which atoms that loose electrons from the structural data, as the position of TFSI− does not communicate such information. This is further complicated by structural disorder of the anions. The unit cell of Spiro(TFSI)2 is much larger than that of Spiro-OMeTAD, details are shown in Table S2 (ESI†). The powder X-ray diffraction pattern of Spiro(TFSI)2 compared with a simulation from single crystal-data are quite similar, as shown in Fig. S5 (ESI†).
DFT calculations were performed in order to compare the frontier orbitals of the molecular structures obtained from diffraction for both Spiro-OMeTAD and Spiro2+, as shown in Fig. S6 (ESI†). The highest occupied molecular orbital (HOMO) and lowest unoccupied molecular orbital (LUMO) of Spiro2+ show a very small difference between the two experimental and theoretical structures. The energy of the HOMO of Spiro2+ is around −9.9 eV, whereas the energy of the LUMO is −4.2 eV (0.1 eV less negative for the theoretically optimized Spiro2+). The differences in orbital energies for Spiro-OMeTAD are larger. The difference in HOMO energy of Spiro-OMeTAD is around 0.1 eV, and the difference in LUMO energy is as high as 0.3 eV. The larger difference for Spiro-OMeTAD is due to twisting of one of the fluorenes in the structure arising from inter-molecular π–π interactions. The HOMO and HOMO−1, which are expected to dominate hole transport, are nearly degenerate with respect to energy and with wave functions localized on one of the two orthogonal fluorene rings. A similar phenomenon is also found for Spiro2+, as indicated in Table S3 (ESI†).
The electronic band structures of Spiro-OMeTAD and Spiro(TFSI)2 were investigated and are shown in Fig. S7 (ESI†). Details of the top of valence bands of Spiro-OMeTAD are shown in Fig. 2. As observed, the valence bands in Spiro-OMeTAD are not flat when using a reasonable energy resolution, indicating effective interaction between the molecular orbitals in the Spiro-OMeTAD dimers noted in the crystal structure unit cell. A notable feature for Spiro(TFSI)2 is that the bands are quite flat in the whole Brillouin zone, indicating that Spiro(TFSI)2 films are less likely to be characterized by significantly overlapping molecular orbitals. Considering the close spacing of the energy levels of molecular orbitals in both Spiro-OMeTAD and Spiro(TFSI)2, the charge transport in a partially oxidized Spiro-OMeTAD is expected to be dominated by hopping mechanism mediated by orbital overlap,22 which is different from most inorganic semiconductors. The bandgap of Spiro-OMeTAD suggested from band structure calculations is quite large, higher than 6 eV. However, for trivial reasons it decreases significantly after oxidation to a level less than 0.1 eV, indicating clear consequences for the light absorption.
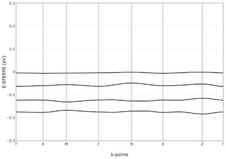 | ||
| Fig. 2 Top valence bands of Spiro-OMeTAD. The crystallographic coordinates of high-symmetry points in the first Brillouin zone. | ||
In order to investigate the redox potential of Spiro(TFSI)2, cyclic voltammetry (CV) was performed in dichloromethane (DCM) solution. A typical cyclic voltammogram is shown in Fig. 3(a). As expected, the Spiro(TFSI)2 shows almost the same redox potentials as neutral Spiro-OMeTAD. The first oxidation peak corresponds to reaction (1), in which Spiro-OMeTAD looses its first electron and form Spiro+. The second oxidation peak at 0.15 V vs. Fc/Fc+ corresponds to reaction (2), where Spiro+ further looses one electron and form Spiro2+. The third oxidation peak gives information about the redox potential for Spiro2+, which is 0.35 V vs. Fc/Fc+. This is a two-electron process as represented in reaction (3). A previous paper assigns this peak to Spiro2+ to Spiro3+.20 However, we confirm our assignments by a charge estimate from electrolysis of Spiro-OMeTAD at 1.1 V vs. Ag/AgCl; the details are shown in Fig. S8 (ESI†).
| Spiro-OMeTAD–e− → Spiro+ | (1) |
| Spiro+–e− → Spiro2+ | (2) |
| Spiro2+–2e− → Spiro4+ | (3) |
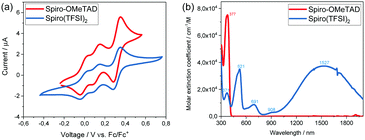 | ||
| Fig. 3 (a) Cyclic voltammograms and, (b) UV/visible absorption spectra of Spiro-OMeTAD and Spiro(TFSI)2 in acetonitrile solution. | ||
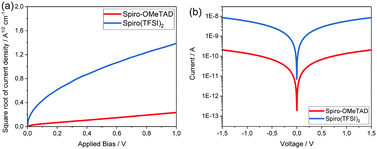
The hole mobility and conductivity of Spiro(TFSI)2 were also investigated and compared with Spiro-OMeTAD. As shown in Fig. 4(a), the hole mobility of Spiro-OMeTAD dramatically increases from 1.62 × 10⁻⁴ cm2 V−1 s−1 to 2.19 × 10⁻³ cm2 V−1 s−1 after oxidation. The same increase was observed regarding conductivity (Fig. 4(b)), the neutral Spiro-OMeTAD shows a conductivity around 7.77 × 10⁻⁷ S cm−1, while the Spiro(TFSI)2 displays a conductivity of 2.89 × 10⁻⁵ S cm−1; same level as reported by most studies on Spiro-OMeTAD doped with LiTFSI.23 As already indicated in the electronic band structures, orbital overlap is expected to be small between adjacent Spiro2+ molecules in the crystal structure, and thus the higher hole mobility and conductivity in Spiro(TFSI)2 can probably be linked to the ionic character of the compound. The improved conductivity deriving from the increased charge carrier density caused by doping and a partially oxidized Spiro-OMeTAD takes place in a molecular packing most likely resembling that in Spiro-OMeTAD.
One of the possible applications of Spiro(TFSI)2 is as p-type dopant for organic hole-transport materials. Spiro(TFSI)2 itself shows a rather good film quality, as indicated in Fig. S10 (ESI†). Previous work by McGehee and co-workers has shown that the compound can work as a good dopant for Spiro-OMeTAD. At high doping amounts, LiTFSI could in fact be avoided.20 Very recently, work from Bach et al. has boosted device PCEs to over 19% in the absence of LiTFSI together with an increased device stability attributed to a more hydrophobic HTM layer.24
In summary, single crystals of doubly oxidized Spiro-OMeTAD were grown and structurally characterized. Based on the structure information, frontier orbitals and electronic band structures were modelled and compared with neutral Spiro-OMeTAD. Molecular orbital overlap together with close energy level spacing in Spiro-OMeTAD and Spiro(TFSI)2 indicate that electron hopping may constitute the main transport mechanism for hole transport in doped Spiro-OMeTAD. The UV/visible absorption spectra show that Spiro2+ absorb light up to more than 2000 nm. Previous reports assign the observed absorption peak at 521 nm to Spiro+ and the peak at 691 nm to Spiro2+, and the present study shows this assignment to be incorrect. Furthermore, considering the positive redox potential of Spiro(TFSI)2, the compound may work efficiently as p-type dopant for many organic HTMs. Our work brings insights into the fundamental transport mechanisms in doped Spiro-OMeTAD and as well shows the potential of applying organic salts as p-type dopant for organic and metal–organic HTMs.
We acknowledge the Swedish Energy Agency and the Swedish Research Council for funding support. The authors thank Prof. Lars Eriksson for help during structure refinement and Dr. Zhen Wang for recording the SEM images. The authors acknowledge the National Supercomputer Centre at Linköping University for computation resources (SNIC 2018/7-57 and SNIC 2018/7-62). The authors W. Zhang and L. Wang thank the China Scholarship Council (CSC) for financial support.
Conflicts of interest
There are no conflicts to declare.Notes and references
- J. Salbeck, N. Yu, J. Bauer, F. Weissörtel and H. Bestgen, Synth. Met., 1997, 91, 209–215 CrossRef CAS
.
- U. Bach, D. Lupo, P. Comte, J. E. Moser, F. Weissörtel, J. Salbeck, H. Spreitzer and M. Grätzel, Nature, 1998, 395, 583–585 CrossRef CAS
.
- Z. Shen, B. Xu, P. Liu, Y. Hu, Y. Yu, H. Ding, L. Kloo, J. Hua, L. Sun and H. Tian, J. Mater. Chem. A, 2017, 5, 1242–1247 RSC
.
- Z. Hawash, L. K. Ono and Y. Qi, Adv. Mater. Interfaces, 2018, 5, 1700623 CrossRef
.
- N. Arora, M. I. Dar, A. Hinderhofer, N. Pellet, F. Schreiber, S. M. Zakeeruddin and M. Grätzel, Science, 2017, 358, 768–771 CrossRef CAS
.
- N. J. Jeon, H. Na, E. H. Jung, T.-Y. Yang, Y. G. Lee, G. Kim, H.-W. Shin, S. Il Seok, J. Lee and J. Seo, Nat. Energy, 2018, 3, 682–689 CrossRef CAS
.
- B. Xu, D. Bi, Y. Hua, P. Liu, M. Cheng, M. Grätzel, L. Kloo, A. Hagfeldt and L. Sun, Energy Environ. Sci., 2016, 9, 873–877 RSC
.
- A. Connell, Z. Wang, Y.-H. Lin, P. C. Greenwood, A. A. Wiles, E. W. Jones, L. Furnell, R. Anthony, C. P. Kershaw, G. Cooke, H. J. Snaith and P. J. Holliman, J. Mater. Chem. C, 2019, 7, 5235–5243 RSC
.
- L. Wang, J. Zhang, P. Liu, B. Xu, B. Zhang, H. Chen, A. K. Inge, Y. Li, H. Wang, Y.-B. Cheng, L. Kloo and L. Sun, Chem. Commun., 2018, 54, 9571–9574 RSC
.
- J. Burschka, A. Dualeh, F. Kessler, E. Baranoff, N. L. Cevey-Ha, C. Yi, M. K. Nazeeruddin and M. Gratzel, J. Am. Chem. Soc., 2011, 133, 18042–18045 CrossRef CAS PubMed
.
- A. Abate, D. J. Hollman, J. Teuscher, S. Pathak, R. Avolio, G. D'Errico, G. Vitiello, S. Fantacci and H. J. Snaith, J. Am. Chem. Soc., 2013, 135, 13538–13548 CrossRef CAS
.
- B. Xu, J. Huang, H. Ågren, L. Kloo, A. Hagfeldt and L. Sun, ChemSusChem, 2014, 7, 3252–3256 CrossRef CAS
.
- L. Caliò, M. Salado, S. Kazim and S. Ahmad, Joule, 2018, 2, 1800–1815 CrossRef
.
- M. Namatame, M. Yabusaki, T. Watanabe, Y. Ogomi, S. Hayase and K. Marumoto, Appl. Phys. Lett., 2017, 110, 123904 CrossRef
.
- S. Fantacci, F. De Angelis, M. K. Nazeeruddin and M. Grätzel, J. Phys. Chem. C, 2011, 115, 23126–23133 CrossRef CAS
.
- B. Xu, J. Zhang, Y. Hua, P. Liu, L. Wang, C. Ruan, Y. Li, G. Boschloo, E. M. J. Johansson, L. Kloo, A. Hagfeldt, A. K. Y. Jen and L. Sun, Chem, 2017, 2, 676–687 CAS
.
- C. Chen, W. Zhang, J. Cong, M. Cheng, B. Zhang, H. Chen, P. Liu, R. Li, M. Safdari, L. Kloo and L. Sun, ACS Energy Lett., 2017, 2, 497–503 CrossRef CAS
.
- D. Shi, X. Qin, Y. Li, Y. He, C. Zhong, J. Pan, H. Dong, W. Xu, T. Li, W. Hu, J.-L. Brédas and O. M. Bakr, Sci. Adv., 2016, 2, e1501491 CrossRef
.
- B. Shen, Z. Hu, H. Xu, K. Sun, S. Feng, J. Zhang and Y. Zhu, Cryst. Growth Des., 2019, 19, 3272–3278 CrossRef CAS
.
- W. H. Nguyen, C. D. Bailie, E. L. Unger and M. D. McGehee, J. Am. Chem. Soc., 2014, 136, 10996–11001 CrossRef CAS PubMed
.
- U. Bach, Solid-state dye-sensitized mesoporous TiO2 Solar Cells, PhD thesis, Lausanne, EPFL, 2000, DOI:10.5075/epfl-thesis-2187.
- T. Chu and Y. Liu, Org. Electron., 2018, 53, 165–184 CrossRef CAS
.
- W. Zhang, P. Liu, A. Sadollahkhani, Y. Li, B. Zhang, F. Zhang, M. Safdari, Y. Hao, Y. Hua and L. Kloo, ACS Omega, 2017, 2, 9231–9240 CrossRef CAS
.
- B. Tan, S. R. Raga, A. S. R. Chesman, S. O. Fürer, F. Zheng, D. P. McMeekin, L. Jiang, W. Mao, X. Lin, X. Wen, J. Lu, Y. B. Cheng and U. Bach, Adv. Energy Mater., 2019, 9, 1901519 CrossRef
.
Footnote |
| † Electronic supplementary information (ESI) available: Experimental details, optical image of the single crystal, EPR spectrum, 19F NMR spectrum, XRD patterns, SEM image, electrolysis of Spiro-OMeTAD, crystallographic data, Spiro(TFSI)2 dimers, unit cell parameters, frontier orbitals, electronic band structures of Spiro-OMeTAD and Spiro(TFSI)2, molar extinction coefficients, UV/visible absorption of Spiro(TFSI)2 in fresh and after aging. CCDC 1965026. For ESI and crystallographic data in CIF or other electronic format see DOI: 10.1039/c9cc09270f |
| This journal is © The Royal Society of Chemistry 2020 |

