
Simultaneous imaging of mitochondrial viscosity and hydrogen peroxide in Alzheimer's disease by a single near-infrared fluorescent probe with a large Stokes shift†
Songjiao
Li
,
Peipei
Wang
,
Wenqi
Feng
,
Yunhui
Xiang
,
Kun
Dou
and
Zhihong
Liu
 *
*
Key Laboratory of Analytical Chemistry for Biology and Medicine (Ministry of Education), College of Chemistry and Molecular Sciences, Wuhan University, Wuhan, Hubei 430072, China. E-mail: zhhliu@whu.edu.cn; Fax: +86-27-6875-4067; Tel: +86-27-8721-7886
First published on 15th December 2019
Abstract
It has been speculated that both the intracellular viscosity and H2O2 level in Alzheimer's disease (AD) brains are higher than that in healthy brains, but direct evidence from living beings is scarce. Herein, we report a NIR emissive fluorescent probe with a large Stokes shift for the associated detection of mitochondrial viscosity and H2O2 in live rat brains with AD for the first time.
Alzheimer's disease (AD) is the most prevalent progressive neurodegenerative disorder and seriously affects human health and the quality of life.1 It has long been speculated that AD is tightly associated with oxidative stress and reactive oxygen species (ROS) in the brain.2 But comprehensive evidence from living beings for this speculation is rare. Intracellular viscosity is known to play an important role in many diffusion mediated biological processes including signal transduction, mass transportation and so on.3 Abnormal changes in cellular viscosity are closely related to diseases and malfunctions.4 At the subcellular level, mitochondria play critical roles in cell differentiation, information transmission and apoptosis.5 Previous findings suggest that both the viscosity of the mitochondrial membrane and the abnormality of H2O2 production in mitochondria are related to Aβ accumulation.6 To gain a better understanding on the relationship between the development of AD and the levels of mitochondrial viscosity and H2O2, it is necessary to monitor these markers at the same time. However, methods for simultaneously measuring H2O2 and viscosity in AD brains are currently absent.
Fluorescence imaging is featured by real-time visualization, high sensitivity and relatively simple operation.7 To date, there have been quite a lot of outstanding outcomes for imaging viscosity and H2O2 in mitochondria individually, but they are unable to give accurate information on the two markers at the same time.8 Compared with the combination of several probes in one system, a single probe with the ability of sensing multiple targets has obvious advantages.9 It is able to circumvent the uncertainties of measurement caused by the joint use of different probes, such as the spectral cross-talk, the difference in probe localizations, and the different metabolism of the probes. As far as we know, only two recent fluorescent probes have been reported for sensing both viscosity and H2O2 in mitochondria.10 Nevertheless, these probes suffered from rather short emission wavelengths in the ultraviolet or visible range, and hence they were able to detect viscosity and H2O2 only in cultured cells.
As stated above, it remains a challenge to simultaneously monitor intracellular viscosity and H2O2 content in vivo, especially in AD brains. To achieve this goal, the probe needs to address several intractable issues: (1) the ability to cross the blood–brain barrier (BBB) so as to image the brain region;11 (2) long emission wavelengths in the near-infrared (NIR) region to get deeper tissue penetration and less interference from background fluorescence;12 and (3) large Stokes shifts are desirable to overcome the “self-absorption” effect.13 Herein, we designed a single NIR emissive fluorescent probe with a large Stokes shift that can simultaneously detect mitochondrial viscosity and H2O2 in the AD brain (Scheme 1). A p-pinacolborylbenzyl moiety was chosen as the reaction site for H2O2, which guarantees high selectivity of the probe toward H2O2. The quaternarized quinoline unit here not only acts as a mitochondria-targeting carrier but also improves the water solubility of the probe. The lipophilic π-conjugated thiophene-bridge was introduced for extension to NIR emission and also for the enhancement of BBB penetrability. The twistable ethylene was designed to respond to the viscosity of the environment. The synthetic route for the probe (named Mito-NIRHV) is outlined in Scheme S1 (ESI†), and its structure was confirmed by 1H NMR, 13C NMR and HRMS (ESI†). The probe was able to sense viscosity and H2O2 with high sensitivity, affording two emission peaks in the NIR region, both with a big Stokes shift of >200 nm. We have demonstrated in detail its ability to monitor the fluctuations of mitochondrial viscosity and H2O2 content, either individually or simultaneously, in living cells and animals. Benefiting from its favourable photophysical properties and proper BBB penetrability, the Mito-NIRHV was applied to simultaneously track the variation of mitochondrial viscosity and H2O2 levels in AD brains for the first time.
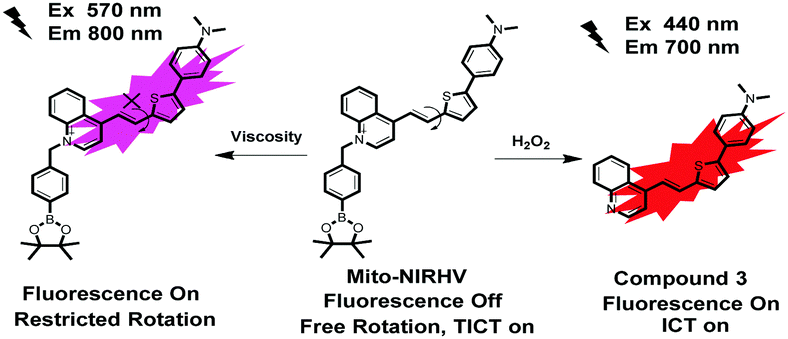 | ||
| Scheme 1 The design of the probe Mito-NIRHV. | ||
With the desired probe in hand, we first tested its spectroscopic properties in response to H2O2. The absorption and fluorescence spectra of compound 3, Mito-NIRHV, in the absence and presence of H2O2 were measured (Fig. S10, ESI†). The UV-vis spectra of Mito-NIRHV exhibited a maximum absorption at 570 nm. After reacting with H2O2, the absorption at 570 nm declined obviously, whereas a new absorption peak appeared at 440 nm. The resulting absorption spectrum was similar to that of compound 3. Meanwhile, the emission intensity at 700 nm was enhanced and the resulting fluorescence spectrum was the same as that of compound 3 in the emission band. The fluorescence intensity at 700 nm under 440 nm excitation showed a gradual increase along with the increase of H2O2 concentration indicating that Mito-NIRHV served as a “turn-on” fluorescent sensor for H2O2 (Fig. 1a). To preclude the possibility that a 10 μM probe may form aggregates or particles, which could lead to a red-shift of the emission peak, we also used a 2 μM probe to test its spectroscopic properties in response to H2O2. The spectra obtained in this case were similar to that with the 10 μM probe (Fig. S11, ESI†), verifying that the emission was a true emission peak from the monomeric probe. Moreover, the fluorescence intensity at 700 nm was linearly proportional to the H2O2 concentration in the range of 0.5–100 μM (R2 = 0.9986, Fig. 1b), and the detection limit was calculated (3σ/slope method) as 3 nM. This high sensitivity may enable the probe to detect trace amounts of intracellular H2O2. The molar absorptivity for Mito-NIRHV and its reaction product are 9.5 × 10³ M−1 cm−1 and 7.4 × 10³ M−1 cm−1, respectively. The fluorescence quantum yield for Mito-NIRHV and its reaction product are 0.012 and 0.232, respectively. To test the specificity of Mito-NIRHV toward H2O2, we investigated various reactive oxygen/nitrogen species and mercaptans. The fluorescence signals showed negligible changes for all these reactive species, presenting excellent selectivity of the probe (Fig. S12, ESI†). We then evaluated the response time of Mito-NIRHV to H2O2. The fluorescence intensity of the probe gradually increased with reaction time, and then leveled off at about 40 min in the presence of varying concentrations of H2O2 (Fig. S13, ESI†). In addition, Mito-NIRHV remained weakly emissive in a wide pH range of 4.0–10.0, while the product of the reaction with H2O2 exhibited dramatic fluorescence enhancement around pH 7.4 (Fig. S14, ESI†), suggesting the potential applicability of Mito-NIRHV in physiological conditions. To confirm the sensing mechanism proposed in Scheme 1, a high resolution mass spectrometry (HRMS) analysis was performed on Mito-NIRHV before and after reacting with H2O2. The results showed the signal at m/z = 357.1427 after reaction, which is nearly equal to the molecular weight of compound 3 (Fig. S15, ESI†). To check whether the probe Mito-NIRHV was responsive to viscosity, its optical properties in an ethanol–glycerol system were evaluated. As displayed in Fig. S16 (ESI†), the maximal absorption of the probe at 570 nm was slightly enhanced as the viscosity increased. Meanwhile, with the glycerol fraction increased from 0% to 100%, which represents a stepwise increase of viscosity, the fluorescence intensity of Mito-NIRHV at around 800 nm showed a remarkable increase (Fig. 1c). Moreover, the fluorescence intensity at 800 nm also presented a good linear relationship between log(I800) and log(Iviscosity) in the range of 1.56–954 cP (Fig. 1d). Next, a 2 μM probe was also used to test its spectroscopic properties in response to viscosity (Fig. S17, ESI†), which again confirmed the emission from the monomeric probe. This viscosity-dependent fluorescence change distinctly verifies the occurrence of a typical twisted intramolecular charge transfer (TICT) process in the system. To preclude the possible effect of pH on the emission, the fluorescence spectra of the probe were measured at varying pH values. As shown in Fig. S18 (ESI†), the fluorescence intensity of the probe at either low or high viscosity remained unchanged for all pH values.
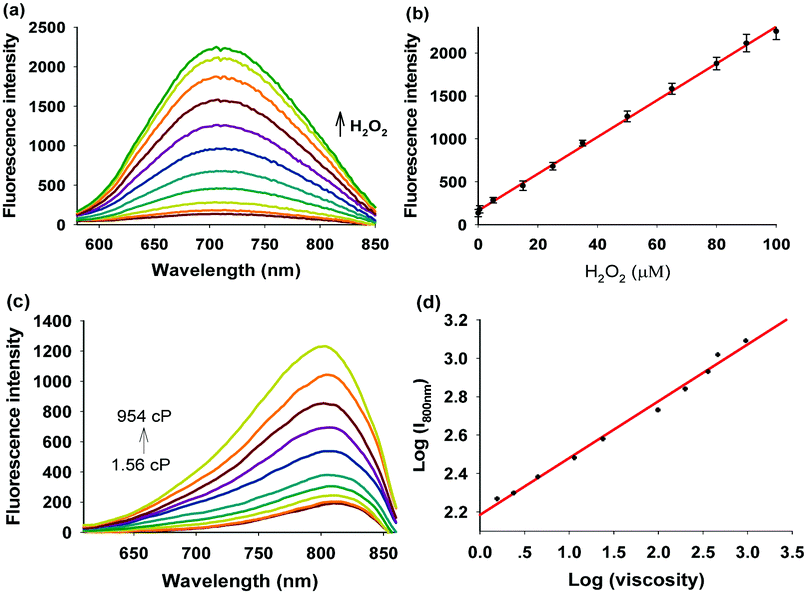 | ||
| Fig. 1 (a) Fluorescence response of Mito-NIRHV (10 μM) to varying concentrations of H2O2 (0–100 μM). λex = 440 nm. (b) The linear relationship between the fluorescence intensity at 700 nm and H2O2 concentration. (c) The fluorescence spectra of Mito-NIRHV (10 μM) at different viscosities, which were recorded in ethanol–glycerol systems with various ratios. λex = 570 nm. (d) The linear relationship between log(I800) and log(Iviscosity). | ||
The cytotoxic effect of the probe was assessed with an MTT assay. More than 85% of HeLa cells survived after 24 h even with 40 μM Mito-NIRHV, indicating a very low cytotoxicity of the probe (Fig. S19, ESI†). As shown in Fig. S20 (ESI†), Mito-NIRHV predominantly localized in the mitochondria (Pearson's coefficient (PC) 0.957), as compared with other organelles such as Lyso- (PC 0.815) and ER-Tracker (PC 0.858). Next, we evaluated the potential ability of the probe to visualize H2O2 in living cells. As shown in Fig. S21a (ESI†), the HeLa cells treated only with Mito-NIRHV exhibited weak fluorescence in the NIR channel (668–726 nm). However, when cells were pretreated with exogenous H2O2 (50 and 100 μM) followed by incubation with the probe, the fluorescence in this channel remarkably increased (Fig. S21b and c, ESI†). The results suggested that Mito-NIRHV had the potential to sense the intracellular H2O2. Next, we further investigated whether Mito-NIRHV could be used to track endogenous H2O2 in living cells. According to the literature, phorbol myristate acetate (PMA) is an effective stimulant to promote cellular ROS levels. Therefore, the HeLa cells were pretreated with PMA (1 μg mL−1) and then incubated with the probe. As expected, the emission intensity exhibited a remarkable increase in this channel (Fig. S21d, ESI†). In contrast, when the cells were pretreated with NAC, an efficient ROS scavenger, the intracellular fluorescence was almost completely inhibited (Fig. S21e, ESI†), verifying that the fluorescence enhancement upon stimulation with PMA was due to the reaction of Mito-NIRHV with intracellular H2O2. All these results indicated that Mito-NIRHV was capable of detecting both exogenous and endogenous H2O2 in living cells.
To verify that Mito-NIRHV is also a mitochondria targetable probe for viscosity, we performed another set of fluorescence co-localization experiments employing organelle trackers (Mito-, ER-, and Lyso-Tracker Green). Fig. S22 (ESI†) also showed that Mito-NIRHV was predominantly distributed in the mitochondria (Pearson's coefficient (PC) 0.968) compared with other organelles such as Lyso- (PC 0.832) and ER-Tracker (PC 0.868). This strongly indicates that Mito-NIRHV localizes at the mitochondria at viscous cellular conditions. To identify the effectiveness of Mito-NIRHV in mitochondrial viscosity imaging, confocal laser fluorescence images of HeLa cells with Mito-NIRHV loaded were acquired after the treatment of two ionophores (nystatin and monensin). When the cells were loaded only with the probe, weak fluorescence was observed in the NIR channel (754–816 nm, Fig. S23a, ESI†). In contrast, upon loading nystatin (Fig. S23b, ESI†) or monensin (Fig. S23c, ESI†) together with the probe, obvious fluorescence enhancement was seen in both cases, which can be ascribed to the mitochondrial swelling or large-scale alteration of mitochondrial metabolism induced by ionophores.
Through the above investigations, we have verified the ability of Mito-NIRHV to separately sense mitochondrial H2O2 and viscosity in living cells. Then we further tried our probe in an inflammation model to evaluate its capability of simultaneously tracking the levels of intracellular H2O2 and viscosity. As reported earlier, inflammation could cause an increase of both the content of H2O2 and viscosity in cells. Lipopolysaccharide (LPS) is known as a cell wall component of Gram-negative bacteria which has been confirmed to trigger cells to engender inflammation. We therefore applied LPS to build an inflammatory model in HeLa cells. As illustrated in Fig. S24a2 and a3 (ESI†), the cells loaded with the probe showed faint fluorescence in both channel 1 (668–726 nm, for H2O2) and channel 2 (754–816 nm, for viscosity). When cells were pretreated with LPS before loading Mito-NIRHV, the fluorescence signals of both channel 1 and channel 2 were significantly increased at the same time (Fig. S24b2 and b3, ESI†). These results demonstrated that the probe was effective for simultaneous imaging of H2O2 and viscosity in cellular environments.
In order to ultimately expand the application scope of the probe to mammals, we applied it for in vivo imaging of the targets in living mice. The first trial was to sense exogenous H2O2 in mice. Before that, the cytotoxicity of Mito-NIRHV in vivo was examined by hematoxylin and eosin (H&E) staining of organs after intravenous injection of the probe. The images of the major organs showed no noticeable sign of organ damage after inserting the probe (Fig. S25, ESI†), implying the negligible toxicity of Mito-NIRHV in the body. For the detection of H2O2, an aqueous solution of H2O2 in PBS was injected into the peritoneal cavity of BALB/c mice, followed by intraperitoneal injection of Mito-NIRHV. As shown in Fig. S26a (ESI†), the control group (with no H2O2 injected) showed the weakest fluorescence, while the group with external H2O2 injection showed much brighter fluorescence (Fig. S26b, ESI†). Next, the feasibility of the probe to track endogenous H2O2 in mice was examined. To this end, the BALB/c mice were firstly injected with rotenone (a documented reagent to induce the production of H2O2 in the body), followed by the injection of Mito-NIRHV. As seen in Fig. S26c (ESI†), rotenone treated mice also exhibited obviously enhanced fluorescence as compared to the control. The above experimental results show that Mito-NIRHV can be used to measure H2O2 in mice.
Subsequently, the in vivo tracking of viscosity changes was performed in the mice models. The variation of viscosity level in the body was also induced by monensin and nystatin. After the abdominal injection of Mito-NIRHV, the normal mice emitted inconspicuous fluorescence (Fig. S27a, ESI†). However, when triggered by either monensin (Fig. S27b, ESI†) or nystatin (Fig. S27c, ESI†), the mice exhibited obviously enhanced fluorescence. The fluorescence intensities of the three groups were calculated and presented in Fig. S27d (ESI†). These results coincided well with the findings in cells, suggesting that Mito-NIRHV can also be a competent tool for the imaging of viscosity in living mice.
Our final-step examination on the performance of Mito-NIRHV was to check whether it could track the endogenously generated H2O2 and viscosity variations in living animals. To achieve this goal, we constructed a mouse model of inflammation induced by LPS, for simultaneous detection of the subtle changes of both H2O2 and viscosity in the inflammatory mice. While the healthy mice injected with only Mito-NIRHV displayed weak fluorescence (Fig. 2a1 and a2), the inflammatory mice showed strong fluorescence in both channel 1 (for H2O2, Fig. 2b1) and channel 2 (for viscosity, Fig. 2b2). These data, together with all the above findings, solidly confirmed the power of Mito-NIRHV to simultaneously image H2O2 and viscosity in living animals, thus encouraging us to ultimately use the probe in investigating some challenging biological issues.
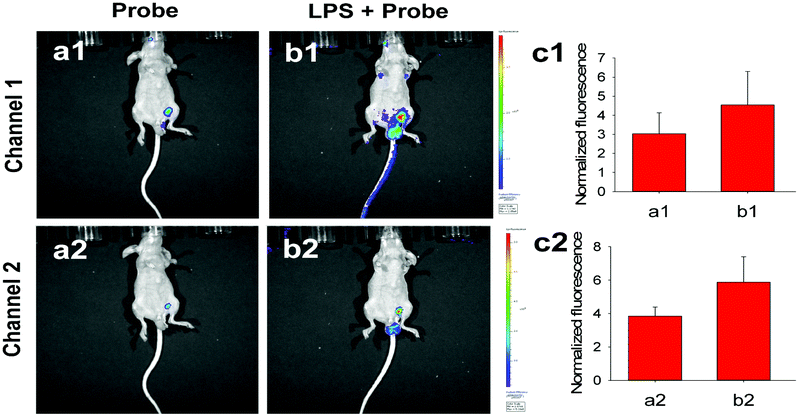 | ||
| Fig. 2 Fluorescence imaging of H2O2 and viscosity in BALB/c mice. (a) Only Mito-NIRHV (1 mM, 100 μL) was injected as a control. (b) Mice pretreated with LPS for 4 h and then injected with Mito-NIRHV. (c) Relative fluorescence intensities of (a) and (b). Channel 1: λex = 430 nm, λem = 700 nm; Channel 2: λex = 570 nm, λem = 800 nm. | ||
In order for a molecular probe to possibly cross the BBB, its lipophilicity index log![[thin space (1/6-em)]](https://www.rsc.org/images/entities/char_2009.gif) P normally is within the range of 1.0–3.0, with the molecular weight (MW) <600 Da. The logP value of Mito-NIRHV was calculated as 1.57, and it also possessed an appropriate MW (573 Da). Some molecular probes with a quaternary salt moiety have been reported for the imaging of amyloid species and showed good BBB permeability.14 We also experimentally verified the BBB penetration ability of Mito-NIRHV. The brain homogenate of BALB/c mice i.v. injected with Mito-NIRHV (2.0 mg kg−1) was subjected to HRMS analysis, which exhibited the existence of Mito-NIRHV in the brain (Fig. S28, ESI†). The BBB penetrability of Mito-NIRHV was further confirmed by ex vivo fluorescence imaging. After i.v. injection of the probe, the fluorescence at 700 nm of various organs was measured and compared. From the images of both the entire organs (Fig. S29, ESI†) and their sliced tissues (Fig. S30, ESI†), it is clearly seen that Mito-NIRHV can reach the brains of mice through i.v. injection.
P normally is within the range of 1.0–3.0, with the molecular weight (MW) <600 Da. The logP value of Mito-NIRHV was calculated as 1.57, and it also possessed an appropriate MW (573 Da). Some molecular probes with a quaternary salt moiety have been reported for the imaging of amyloid species and showed good BBB permeability.14 We also experimentally verified the BBB penetration ability of Mito-NIRHV. The brain homogenate of BALB/c mice i.v. injected with Mito-NIRHV (2.0 mg kg−1) was subjected to HRMS analysis, which exhibited the existence of Mito-NIRHV in the brain (Fig. S28, ESI†). The BBB penetrability of Mito-NIRHV was further confirmed by ex vivo fluorescence imaging. After i.v. injection of the probe, the fluorescence at 700 nm of various organs was measured and compared. From the images of both the entire organs (Fig. S29, ESI†) and their sliced tissues (Fig. S30, ESI†), it is clearly seen that Mito-NIRHV can reach the brains of mice through i.v. injection.
Finally, Mito-NIRHV was applied to simultaneously detect the H2O2 content and viscosity in the brains of healthy mice and AD mice. 6 month-old male AD-model (APP/PS1 transgenic) mice and wild-type mice were employed for the investigation. As shown in Fig. 3, at 0 min upon intravenous injection of the probe, there was no obvious difference in the fluorescence of the brain region between the WT and AD mice, in either the H2O2 channel (a1, c1) or the viscosity channel (a2, c2). However, after 30 min which allows for the reaction between the probe and targets, the fluorescence signals of AD mice were significantly stronger than that of WT mice, in both the H2O2 channel (b1, d1) and the viscosity channel (b2, d2). These results vividly illustrated the elevated H2O2 level and increased viscosity of AD brains compared to normal brains.
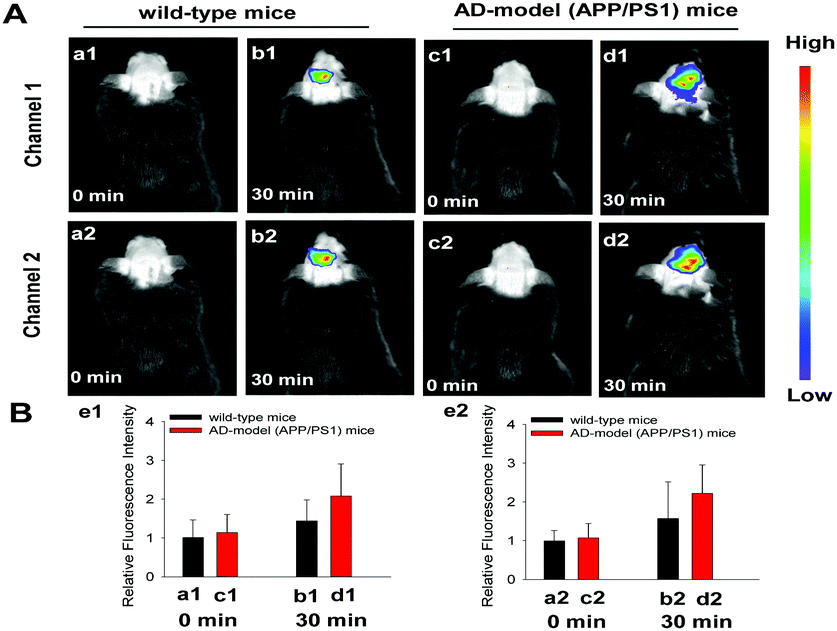 | ||
| Fig. 3 Imaging and analysis of H2O2 and viscosity in a transgenic mouse model of AD. (A) Representative images of WT and APP/PS1 mice at 0 min and 30 min after the injection of Mito-NIRHV. (B) Quantitative analysis of the fluorescence images from Channel 1 (for H2O2, e1) and Channel 2 (for viscosity, e2). | ||
In summary, a dual-response fluorescent probe was designed and synthesized for simultaneously detecting mitochondrial H2O2 and viscosity. The probe exhibited two independent emissions in the NIR region upon responding to the two targets. It featured high sensitivity and selectivity towards the targets, large Stokes shift overcoming spectral cross-talk, satisfactory mitochondria-targeting ability, appropriate BBB penetrability and low cytotoxicity both in vitro and in vivo. The probe was proved for its ability to monitor the contents of H2O2 and viscosity in living cells and animals, either individually or simultaneously. The probe was applied to visually track the variations of H2O2 and viscosity in the brain of AD mice. Our result provides a more comprehensive picture of H2O2 and viscosity in AD brains, which could lead to better understanding of AD pathology.
This work was financially supported by the National Natural Science Foundation of China (No. 21575109, 21625503). All animal procedures were performed in accordance with the Guidelines for Care and Use of Laboratory Animals of Wuhan University and approved by the Animal Ethics Committee of Wuhan University.
Conflicts of interest
There are no conflicts of interest to declare.Notes and references
- D. J. Selkoe, Nat. Med., 2011, 17, 1060–1065 CrossRef CAS PubMed.
- G. Perry, A. D. Cash and M. A. Smith, J. Biomed. Res. Int., 2002, 2, 120–123 Search PubMed.
- J. Singer and G. L. Nicolson, Science, 1972, 175, 720–731 CrossRef PubMed.
- M. J. Stutts, C. M. Canessa, J. C. Olsen, M. Hamrick, J. A. Cohn, B. C. Rossier and R. C. Boucher, Science, 1995, 269, 847–850 CrossRef CAS PubMed.
- M. J. Hansson, S. Morota, M. Teilum, G. Mattiasson, H. Uchino and E. Elmer, J. Biol. Chem., 2010, 285, 741–750 CrossRef CAS PubMed.
- A. M. Aleardi, G. Benard, O. Augereau, M. Malgat, J. C. Talbot, J. P. Mazat, T. Letellier, J. Dachary-Prigent, G. C. Solaini and R. J. Rossignol, J. Bioenerg. Biomembr., 2005, 37, 207–225 CrossRef CAS PubMed.
- (a) D. Cao, Z. Liu, P. Verwilst, S. Koo, P. Jangjili, J. S. Kim and W. Lin, Chem. Rev., 2019, 119, 10403–10519 CrossRef CAS PubMed; (b) X. Wu, W. Shi, X. Li and H. Ma, Acc. Chem. Res., 2019, 527, 1892–1904 CrossRef PubMed.
- (a) Z. Yang, Y. He, J. H. Lee, N. Park, M. Suh, W. S. Chae and J. S. Kim, J. Am. Chem. Soc., 2013, 135, 9181–9185 CrossRef CAS PubMed; (b) Y. Wen, K. Liu, H. Yang, Y. Liu, L. Chen, Z. Liu and T. Yi, Anal. Chem., 2015, 87, 10579–10584 CrossRef CAS PubMed.
- (a) S. J. Li, Y. F. Li, H. W. Liu, D. Y. Zhou, W. L. Jiang, J. Ou-Yang and C. Y. Li, Anal. Chem., 2018, 90, 9418–9425 CrossRef CAS PubMed; (b) K. Dou, Q. Fu, G. Chen, F. Yu, Y. Liu, Z. Cao and H. Wang, Biomaterials, 2017, 133, 82–93 CrossRef CAS PubMed; (c) C. Zhang, Q. Z. Zhang, K. Zhang, L. Y. Li, M. D. Pluth, L. Yi and Z. Xi, Chem. Sci., 2019, 10, 1945–1952 RSC.
- (a) M. Ren, B. Deng, K. Zhou, X. Kong, J. Y. Wang and W. Lin, Anal. Chem., 2016, 89, 552–555 CrossRef PubMed; (b) H. Li, C. Xin, G. Zhang, X. Han, W. Qin and C. W. Zhang, J. Mater. Chem. B, 2019, 7, 4243–4251 RSC.
- X. Zhang, Y. Tian, Z. Li, X. Tian, H. Sun, H. Liu and C. Ran, J. Am. Chem. Soc., 2013, 135, 16397–16409 CrossRef CAS PubMed.
- J. Y. Xie, C. Y. Li, Y. F. Li, J. Fei, F. Xu, J. Ou-Yang and J. Liu, Anal. Chem., 2016, 8, 9746–9752 CrossRef PubMed.
- T. B. Ren, W. Xu, W. Zhang, X. X. Zhang, Z. Y. Wang, Z. Xiang and X. B. Zhang, J. Am. Chem. Soc., 2018, 140, 7716–7722 CrossRef CAS PubMed.
- (a) Y. Li, D. Xu, S. L. Ho, H. W. Li, R. Yang and M. S. Wong, Biomaterials, 2016, 94, 84–92 CrossRef CAS PubMed; (b) K. Rajasekhar, N. Narayanaswamy, N. A. Murugan, K. Viccaro, H. G. Lee, K. Shah and T. Govindaraju, Biosens. Bioelectron., 2017, 98, 54–61 CrossRef CAS PubMed.
Footnote |
| † Electronic supplementary information (ESI) available: Additional experimental data, including characterization, photophysical properties, cytotoxicity, and experimental details, and supplementary fluorescence images in cells and mice. See DOI: 10.1039/c9cc08267k |
| This journal is © The Royal Society of Chemistry 2020 |