 Open Access Article
Creative Commons Attribution 3.0 Unported Licence
Topography induced stiffness alteration of stem cells influences osteogenic differentiation†
Liangliang
Yang‡
ab,
Qi
Gao‡
c,
Lu
Ge
ab,
Qihui
Zhou
 d,
Eliza M.
Warszawik
ab,
Reinier
Bron
ab,
King Wai Chiu
Lai
 *c and
Patrick
van Rijn
 *ab
*ab
aDepartment of Biomedical Engineering-FB40, University of Groningen, University Medical Center Groningen, Groningen, A. Deusinglaan 1, 9713 AV Groningen, The Netherlands. E-mail: p.van.rijn@umcg.nl
bW.J. Kolff Institute for Biomedical Engineering and Materials Science-FB41, University of Groningen, University Medical Center Groningen, Groningen, A. Deusinglaan 1, 9713 AV Groningen, The Netherlands
cDepartment of Biomedical Engineering, City University of Hong Kong, Hong Kong. E-mail: kinglai@cityu.edu.hk
dInstitute for Translational Medicine, Department of Stomatology, The Affiliated Hospital of Qingdao University, Qingdao University, Qingdao 266003, China
First published on 5th April 2020
Abstract
Topography-driven alterations in cell morphology tremendously influence cell biological processes, particularly stem cell differentiation. Aligned topography is known to alter the cell shape, which we anticipated to also induce altered physical properties of the cell. Here, we show that topography has a significant influence on single cell stiffness of human bone marrow derived-Mesenchymal Stem Cells (hBM-MSCs) and the osteogenic differentiation of these. Aligned topographies were used to control the cell elongation, depicted as the cell aspect ratio (CAR). Intriguingly, an equal CAR elicited from different topographies, resulted in highly altered differentiation behavior and the underlying single cell mechanics was found to be critical. The cell behavior was found to be focal adhesion-mediated and induced stiffness alterations rather than just influencing the cell elongation. The effect was further corroborated by investigations of the transcriptional regulators YAP. Our study provides insight into how mechanical properties of the cell, which are stimulated by topography, modulate the osteogenesis of hBM-MSCs, which is beneficial for improving the understanding of interactions between stem cells and topography for developing applications of tissue engineering and regenerative medicine.
Introduction
Achieving control over stem cell differentiation and enhance the differentiation process by non-biochemical means remains an important topic for investigation as it will lead to more advanced tissue engineering and regenerative medicine approaches.1,2 It is well known, that many cell properties, including self-renewal and differentiation of stem cells, are regulated by (bio)chemical cues (e.g., surface chemistry,3 extracellular matrix (ECM) proteins,4,5 and peptides6,7) and physical stimuli (surface stiffness and topography).8–11 Cells sense such surface patterns ranging from 10 nm to 100 μm and different kinds of nanoscale and submicron topography (for example, roughness,10 grating,12 wrinkle,13 pillar,14 spiky,15 and particle16) provides control over fundamental cell behaviours, for example, proliferation, migration and differentiation.14–19 For instance, Kelley and co-workers15 reported three-dimensional nanostructured microarchitectures efficiently regulate neuron differentiation of MSCs via mechanotransduction. Song et al.20 found that osteogenesis enhanced by nanotopography was mediated by the signaling link between Yes-associated protein and β-catenin.Several types of geometries, namely pits,21 tubes,22 pillars,23 and gratings24 have been previously investigated in terms of osteogenic differentiation. Facilitating osteogenic differentiation by means of non-biochemical cues would have great implications for bone tissue engineering and bone-inductive implant materials.25,26 The topography of biomaterials modulates the differentiation of stem cells via mechanotransduction. Previous studies demonstrate that topography induced acceleration of osteogenic differentiation is caused by focal adhesion, RhoA/Rock signaling pathway,25,27 and the regulation microRNA.28 Furthermore, Liu et al., Wang et al., and Niu et al. revealed that topography-induced N-cadherin via β-catenin signaling,29 integrin-linked kinase (ILK)/β-catenin pathway,30 and crosstalk between focal adhesion kinase/MAPK and ILK/β-catenin pathways31 up-regulated osteogenesis.
Previous studies indicate that cell elongation could be a factor that facilitates differentiation of individual hBM-MSCs,24,32–36 even without the external chemical induction factors.36 The cell elongation can be quantified by determining the cell aspect ratio (CAR, defined as the ratio of the length of the major axis to the length on the minor axis of a single cell) and is an important characterization of cell shape, which has significant influence on the cell fate.34,36 Osteogenic differentiation of MSCs with different CAR (varing between 1–16) was studied by Wagner and co-workers,24 Mrksich and co-workers,32 and Ding and co-workers34 who independently showed that there is a dependency between the CAR and osteogenic differentiation. For instance, Wagner et al.24 found that compared to Flat surface, stem cells grown on microgrooves with higher CAR showed enhanced osteogenic differentiation. Mrksich et al.32 showed that cells cultured in rectangles with increasing aspect ratio, display different osteogenesis profiles. Specifically, patterned cells cultured on rectangles having aspect ratios of 1![[thin space (1/6-em)]](https://www.rsc.org/images/entities/char_2009.gif) :
:![[thin space (1/6-em)]](https://www.rsc.org/images/entities/char_2009.gif) 1, 3
1, 3![[thin space (1/6-em)]](https://www.rsc.org/images/entities/char_2009.gif) :
:![[thin space (1/6-em)]](https://www.rsc.org/images/entities/char_2009.gif) 2 and 4
2 and 4![[thin space (1/6-em)]](https://www.rsc.org/images/entities/char_2009.gif) :
:![[thin space (1/6-em)]](https://www.rsc.org/images/entities/char_2009.gif) 1 exhibited that the degree of osteogenic differentiation increased with aspect ratio. However, Ding et al.36 studied the effect of CAR on lineage commitment of MSCs in growth medium without the chemical induction factors, and a non-monotonic change of osteogenic differentiation was found with optimal CAR of about 2. This demonstrates that CAR itself is an inherent factor to control stem cell differentiation, let alone with or without chemical induction factors. However, it remains elusive why cell elongation enhances the differentiation and whether or not the morphology is indeed the cause or that other factors are influenced by the topography.
1 exhibited that the degree of osteogenic differentiation increased with aspect ratio. However, Ding et al.36 studied the effect of CAR on lineage commitment of MSCs in growth medium without the chemical induction factors, and a non-monotonic change of osteogenic differentiation was found with optimal CAR of about 2. This demonstrates that CAR itself is an inherent factor to control stem cell differentiation, let alone with or without chemical induction factors. However, it remains elusive why cell elongation enhances the differentiation and whether or not the morphology is indeed the cause or that other factors are influenced by the topography.
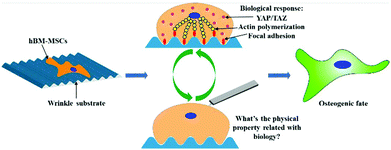
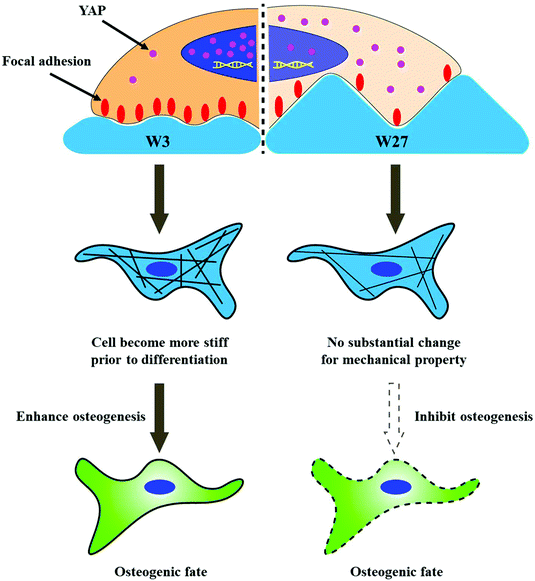
Previous studies demonstrate that topography influences cell behavior by changing focal adhesion assembly, giving rise to variations in cytoskeletal organization and cell mechanical properties.37,38 However, few studies investigated the relationship between cell elongation, cell mechanical properties and osteogenic differentiation of stem cells. We hypothesized that topography-mediated osteogenic differentiation of hBM-MSCs is associated with single cell mechanical properties rather than the cell aspect ratio (CAR). The idea is that cell elongation not only associated with biological properties, for example, focal adhesion and mechanosensing, but also result in altered physical properties (cell stiffness) (Fig. 1), which is rarely investigated and compared to the biological response. To study the effect of surface topography on cell morphology (cell orientation, cell area and CAR), we prepared polydimethylsiloxane (PDMS) substrates with anisotropic wave-like topographies with different wavelengths and amplitudes to controllably affect and direct the CAR. The CAR in connection to single cell mechanical alterations was determined by atomic force microscopy (AFM) nanoindentation and displayed the modulation of osteogenic differentiation exemplifying how influencing mechanical components in cell development is crucial. Topography-mediated mechanosensing was further studied on protein and molecular level using immunostaining of focal adhesion and the transcriptional regulator YAP, respectively. Furthermore, the altering mechanical behavior was studied in combination with osteogenesis and it was found that altering mechanical behavior is of major importance. For the first time, we describe the relationship between CAR, degree of osteogenesis, and mechanical properties of hBM-MSCs during that process. We found that cell stiffness is another important factor for topography-driven CAR guiding osteogenic differentiation of stem cells.
Methods
PDMS film preparation
Briefly, PDMS was prepared by mixing the elastomer base (prepolymer) and cross-linker (Sylgard 184, Dow Corning) in a ratio of 10![[thin space (1/6-em)]](https://www.rsc.org/images/entities/char_2009.gif) :
:![[thin space (1/6-em)]](https://www.rsc.org/images/entities/char_2009.gif) 1 or 15
1 or 15![[thin space (1/6-em)]](https://www.rsc.org/images/entities/char_2009.gif) :
:![[thin space (1/6-em)]](https://www.rsc.org/images/entities/char_2009.gif) 1 by weight. The mixtures were vigorously stirred with a spatula, degassed under vacuum for 15 min, and deposited onto clean 12 × 12 cm squared polystyrene Petri dish. The poured PDMS was cured overnight in an oven at 70 °C.
1 by weight. The mixtures were vigorously stirred with a spatula, degassed under vacuum for 15 min, and deposited onto clean 12 × 12 cm squared polystyrene Petri dish. The poured PDMS was cured overnight in an oven at 70 °C.
Preparation of aligned topography PDMS substrates
PDMS aligned topography substrates were prepared as described previously.39 PDMS elastomer substrates were placed in a custom-made stretching apparatus and stretched uniaxially to 10–30% of the original length. Stretched PDMS substrates were oxidized using air plasma at varying pressures and oxidation times depending on the desired topography dimensions (Plasma Activate Flecto 10 USB, maximum intensity). After oxidation, the strain was released inducing the formation of aligned topography (wave-like structures). The ratios between the elastomer base and cross-linker as well as the parameters used for preparation of substrates with different topographies are summarized in Table 1.| Substrate | Ratio of prepolymer and cross-linker | Operating pressure | Plasma time | Stretch percent (%) |
|---|---|---|---|---|
| W and A are the abbreviation of wavelength and amplitude, respectively, and the unit for W and A is μm. The different surface topographies are further reported as W0.5, W3, W10, and W27. | ||||
| W0.5/A0.05 | 10![[thin space (1/6-em)]](https://www.rsc.org/images/entities/char_2009.gif) : :![[thin space (1/6-em)]](https://www.rsc.org/images/entities/char_2009.gif) 1 1 |
14 Torr | 60 s | 30 |
| W3/A0.7 | 10![[thin space (1/6-em)]](https://www.rsc.org/images/entities/char_2009.gif) : :![[thin space (1/6-em)]](https://www.rsc.org/images/entities/char_2009.gif) 1 1 |
25 mTorr | 20 s | 30 |
| W10/A3.5 | 10![[thin space (1/6-em)]](https://www.rsc.org/images/entities/char_2009.gif) : :![[thin space (1/6-em)]](https://www.rsc.org/images/entities/char_2009.gif) 1 1 |
25 mTorr | 650 s | 20 |
| W27/A4.3 | 15![[thin space (1/6-em)]](https://www.rsc.org/images/entities/char_2009.gif) : :![[thin space (1/6-em)]](https://www.rsc.org/images/entities/char_2009.gif) 1 1 |
25 mTorr | 30 min | 10 |
Imprinting
The prepared PDMS substrates with aligned topographies were used as molds onto which a fresh mixture of elastomer base and cross-linker (in a ratio of 10![[thin space (1/6-em)]](https://www.rsc.org/images/entities/char_2009.gif) :
:![[thin space (1/6-em)]](https://www.rsc.org/images/entities/char_2009.gif) 1 by weight) was poured, followed by curing at 70 °C overnight. After that, the molds were removed and the freshly prepared PDMS substrates baring the imprint were additionally treated with air plasma at 500 mTorr for 1 min and used for cell seeding. The Flat substrate (control) was prepared and treated the same as those obtained from the imprinting process mentioned above (same ratio for elastomer base and cross-linker (10
1 by weight) was poured, followed by curing at 70 °C overnight. After that, the molds were removed and the freshly prepared PDMS substrates baring the imprint were additionally treated with air plasma at 500 mTorr for 1 min and used for cell seeding. The Flat substrate (control) was prepared and treated the same as those obtained from the imprinting process mentioned above (same ratio for elastomer base and cross-linker (10![[thin space (1/6-em)]](https://www.rsc.org/images/entities/char_2009.gif) :
:![[thin space (1/6-em)]](https://www.rsc.org/images/entities/char_2009.gif) 1), same curing process and condition of air plasma), to make sure all the samples maintain the same surface chemistry and mechanical properties.
1), same curing process and condition of air plasma), to make sure all the samples maintain the same surface chemistry and mechanical properties.
Topography characterization
Topography features were characterized by atomic force microscope (Nanoscope V Dimension 3100 microscope, Veeco, United States) operating in tapping mode in air (model DNP-10 tip). To determine the wavelength and amplitude of the topographies, the obtained AFM images were analyzed using NanoScope Analysis software.Cell culture
hBM-MSCs (passage 2) were obtained from Lonza and cultured in growth medium containing Alpha modified Eagle medium (Gibco), 10% (v/v) fetal bovine serum (Gibco), 0.1% ascorbic acid 2-phosphate (Sigma) and 1% penicillin/streptomycin (Gibco). Cells were incubated in T75 culture flasks at 37 °C in a humidified atmosphere with 5% CO2. Culture medium was changed every 3 days and cells were harvested at ≈80% confluency. The confluent cells were routinely subcultured by trypsinization. MSCs of passage 4 were used for seeding onto the topographies and the differentiation experiments.Immunostaining
All PDMS substrates were sterilized by washing with 70% ethanol and placed in 24-well plates and then washed with PBS before use. Afterwards, hBM-MSCs were seeded onto the substrates at a density of 1 × 10⁴ cells per well. For immunostaining, hBM-MSCs were first washed with Phosphate-buffered saline (PBS), fixed with 3.7% paraformaldehyde solution in PBS for 20 min, and subsequently washed three times with PBS. Afterwards, the cell membrane was permeated with 0.5% Triton X-100 solution in PBS for 3 min and blocked with 5% bovine serum albumin in PBS solution for 30 min. Subsequently, the cells were incubated with the primary antibody for alkaline phosphatase (Developmental Hybridoma Bank, B4-78, 1![[thin space (1/6-em)]](https://www.rsc.org/images/entities/char_2009.gif) :
:![[thin space (1/6-em)]](https://www.rsc.org/images/entities/char_2009.gif) 100, v/v), vinculin (clone hVin-1, Sigma, 1
100, v/v), vinculin (clone hVin-1, Sigma, 1![[thin space (1/6-em)]](https://www.rsc.org/images/entities/char_2009.gif) :
:![[thin space (1/6-em)]](https://www.rsc.org/images/entities/char_2009.gif) 100) or YAP (Santa Cruz Biotechnology, SC-101199, 1
100) or YAP (Santa Cruz Biotechnology, SC-101199, 1![[thin space (1/6-em)]](https://www.rsc.org/images/entities/char_2009.gif) :
:![[thin space (1/6-em)]](https://www.rsc.org/images/entities/char_2009.gif) 500, v/v) for 1 h, followed by staining with Rhodamine Red™-X-labeled goat-anti-mouse antibody (Jackson Immunolab, 1
500, v/v) for 1 h, followed by staining with Rhodamine Red™-X-labeled goat-anti-mouse antibody (Jackson Immunolab, 1![[thin space (1/6-em)]](https://www.rsc.org/images/entities/char_2009.gif) :
:![[thin space (1/6-em)]](https://www.rsc.org/images/entities/char_2009.gif) 100, v/v) as the secondary antibody. The nucleus and actin were stained using DAPI and TRITC-phalloidin, respectively by incubation for 1 hour. Finally, the cells were imaged with TissueFaxs (TissueGnostics GmbH, Vienna, Austria) at 10× magnification. YAP staining and vinculin staining were observed using a LEICA TCS SP2 confocal laser scanning microscopy (CLSM) equipped with a 40× NA 0.80 water immersion objective. Additionally, image analysis of focal adhesion was done by an online Focal Adhesion Analysis Server,40 and Fiji software was used to measure cell orientation and elongation. Cell elongation was quantified as the aspect ratio between the cell length and width measured via fluorescent F-actin stained cells (at least 60 cells counted for each sample, also for cell area). Directionality analysis for cell orientation was conducted with Fiji using the Orientation J plug-in. Only aligned elements were taken into account for the directionality algorithm in an entire image, and at least 200 cells were taken into consideration for each substrate. For cell elongation and orientation, ≥6 images per sample were used and 3 independent samples were analyzed.
100, v/v) as the secondary antibody. The nucleus and actin were stained using DAPI and TRITC-phalloidin, respectively by incubation for 1 hour. Finally, the cells were imaged with TissueFaxs (TissueGnostics GmbH, Vienna, Austria) at 10× magnification. YAP staining and vinculin staining were observed using a LEICA TCS SP2 confocal laser scanning microscopy (CLSM) equipped with a 40× NA 0.80 water immersion objective. Additionally, image analysis of focal adhesion was done by an online Focal Adhesion Analysis Server,40 and Fiji software was used to measure cell orientation and elongation. Cell elongation was quantified as the aspect ratio between the cell length and width measured via fluorescent F-actin stained cells (at least 60 cells counted for each sample, also for cell area). Directionality analysis for cell orientation was conducted with Fiji using the Orientation J plug-in. Only aligned elements were taken into account for the directionality algorithm in an entire image, and at least 200 cells were taken into consideration for each substrate. For cell elongation and orientation, ≥6 images per sample were used and 3 independent samples were analyzed.
Osteogenic differentiation of MSCs
hBM-MSCs were seeded on PDMS substrates with different topography features at a cell density of 1 × 10⁴ cells per well and incubated at 37 °C, 5% CO2 and 24 h later the growth medium was replaced by osteogenic differentiation medium. Osteogenic induction medium consisted of growth medium supplemented with 10 mM glycerophosphate (Sigma) and 100 nM dexamethasone (Sigma). The cells were cultured for 21 days, with the differentiation medium being replaced every 3 days.Calcium detection by Alizarin Red staining
The mineralization of the extracellular matrix, the last step of the osteogenic differentiation, was evaluated by Alizarin Red staining after 21 days of cell culture under differentiation conditions. The samples were washed twice with PBS, fixed with 4% paraformaldehyde for 15 minutes and incubated with 0.1% Alizarin Red S solution at room temperature for 30 minutes. The cells were further washed twice with PBS and analyzed. For a quantitative calcium deposition analysis, the Alizarin Red S stained cultures were de-stained with 10% cetylpyridinum chloride in 10 mM sodium phosphate buffer at room temperature for 30 minutes. The absorbance of extracted stains was measured with a microplate reader (BMG LABTECH, Offenburg, Germany) at 540 nm. The results were normalized by the number of cells present in each well. The cell number was determined by nucleus staining with DAPI, and quantitative analysis of the positively stained cells using the high-throughput analysis technique (TissueQuest software) after imaged with TissueFaxs-Tissue-Gnostics microscopy setup.Single cell Young's modulus determination
AFM nanoindentation was conducted by a BioScope Catalyst AFM system (Bruker Nano, Santa Barbara, CA). In the AFM nanoindentation experiment, contact mode in fluid was applied. DNP-10 tips (Bruker Nano, Santa Barbara, CA) with V-shaped silicon nitride cantilever and pyramidal silicon nitride tip were applied, whereas the actual value of spring constant was calibrated in liquid using the thermal tune method. Hank's balanced salt solution (HBSS) was used as the buffer for force-indentation curve collection. To keep the activity of live cell, each measurement was limited to 1 h after the PDMS substrate was loaded on the AFM stage. Cells were indented with a fixed force of 2 nN and corresponding displacements were recorded. The analysis was performed according to the retrace force-indentation curves. Sneddon model (eqn (1)) was chosen as the fit model to calculate the Young's modulus. In the equation, the half angle (α) of AFM tips was set as 18° while the Poisson ratio (ν) was assumed to be 0.5. | (1) |
For each cell, approximately 25 force–distance curves were collected. At each condition, at least 25 cells were tested. Data analysis was performed by Nanoscope v1.8.
Statistics
All data points are expressed as mean values ± standard deviation. Statistical analysis was performed with Origin 9.0 software. All data were analyzed using one way analysis of variance (ANOVA) with Tukey's test to determine differences between groups. *P < 0.05, **P < 0.01, and ***P < 0.001, respectively.Results
Preparation and characterization of aligned topography on PDMS substrates
To study the influence of elongated cell morphology (different CAR) stimulated by aligned topographies on osteogenic differentiation of stem cells, we prepared PDMS-based substrates with aligned surface topographies of different dimensions using variations of our previously reported strain-oxidation-release procedure.39 Wave-like topographies were produced as a result of varying the elastomer base/cross-linker ratio, stretching deformation, plasma pressure, and oxidation time. Plasma oxidation alters both chemical composition and the stiffness41,42 and therefore an altered preparation approach was needed to exclude all effects other than topography. To exclude variations in chemical composition and mechanical properties that might arise due to the different preparation procedures, PDMS with different topographies were applied as molds on which we applied a fresh mixture of elastomer base/cross-linker. This imprinting approach led to PDMS substrates with different topographies, but the same surface chemistry and mechanical properties.The surface features after imprinting were characterized by AFM. As shown in Fig. 2A, the non-stretched PDMS results in a Flat surface, while using the preparation conditions as illustrated in Table 1, wave-like topographies are achieved of varied dimensions (wavelength (W; μm) and amplitude (A; μm)) of W0.5A0.05, W3A0.7, W10A3.5 and W27A4.3. The different surface topographies are further reported as Flat, W0.5, W3, W10, and W27. The wavelength and amplitude are dependent and both increase simultaneously as is shown in Fig. 2B.
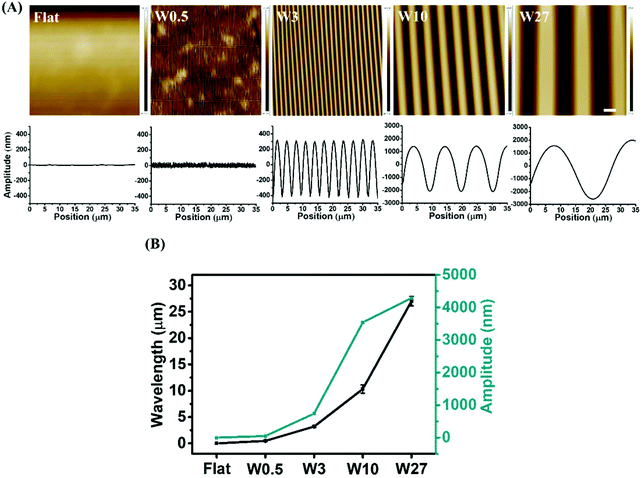 | ||
| Fig. 2 (A) AFM images taken from middle part of substrate (images from side of the substrate showed in Fig. S1†) and height profiles of the structured PDMS surfaces obtained after imprinting. (B) Wavelength, and amplitude of created wrinkled surface. Data are reported as mean ± standard deviation (SD) (n ≥ 30 wrinkles for each imprint, three independent imprints). Scale bar is 4 μm and applies to all images. | ||
The influence of topography on cell morphology of hBM-MSCs
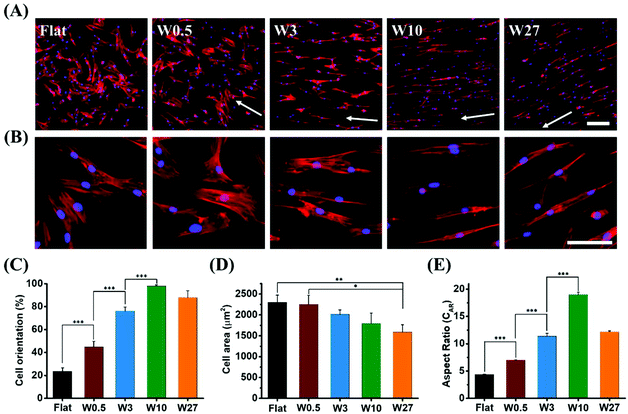
Topography significantly affects the morphology and orientation of cells through a phenomenon known as contact guidance.43 Cell alignment and elongation are morphological features essential for the behaviour of the cell and have previously been shown to affect differentiation in MSCs.24 The degree of cell elongation provides further indication of cellular structural maturity and function expression.44,45To investigate the influence of the surface topography on cell morphology, hBM-MSCs were seeded on the different topographies and allowed to attach and spread for 24 hours. To visualize the cytoskeleton and nucleus, the cells were stained with phalloidin and DAPI, respectively. As shown in Fig. 3A and B (zoom-in), cell orientation was strongly influenced by the surface topography on which the cells reside. Cells grown on Flat were randomly oriented. Cells cultured on W0.5 promoted slight orientation of cells in the direction of the topography. The cells cultured on the larger topographies resulted in cells with much higher orientation.
Cell alignment, expressed as the percentage of cells that have their main axis within 10° from the direction of the topography,46,47 was quantified with Fiji. The degree of cell orientation (Fig. 3C) increased with the increasing topography dimensions up to W10 (98%), but decreased to 88% upon further increasing the topography dimensions for W27. The results indicate that larger wavelength and amplitude improve the cell orientation, but the trend is a non-monotonic change. Cell area is a well-accepted characterization of cell attachment and spreading, and it is well documented that cell extension and consequent spreading could give rise to altering levels of differentiation markers of stem cells.48Fig. 3D displays that cell area (2 dimensional) gradually decreased with the increase of wrinkle size. hBM-MSCs on Flat and W0.5 surface exhibited the largest average cell area (2300 μm2). In contrast, the cell area for W27 (1580 μm2) was significantly lower compared to Flat and W0.5 substrates. These results suggest that there is an significant influence of surface topography on cell alignment and spreading.
It was found that the CAR is also strongly influenced by surface topography. For cells grown on a Flat surface, the CAR reached 4.4 and further increased with the increasing of wrinkle size. For cells grown on W0.5, W3, and W10, the CAR was 7.0, 11.4, 19.0, respectively, and then decreased to 12.2 for cells cultured on W27 (Fig. 3E). Interestingly, cells grown on both W3 and W27 resulted in a similar CAR despite significant differences in the surface topography. However, cells seem to have a different appearance on both substrates and this is likely attributed to the calculation for cell aspect ratio, as it is defined as the ratio of the length of the major axis to the length on the minor axis of a single cell, so different cell appearance could have the same value of aspect ratio. The general cell elongation here far exceeds the reached elongation factors in other studies and more interestingly, it enables us to compare elongated cells with similar CAR stimulated by different topography allowing to identify if role of cell morphology specifically.
Topography influences cellular mechanical properties cultured in growth medium
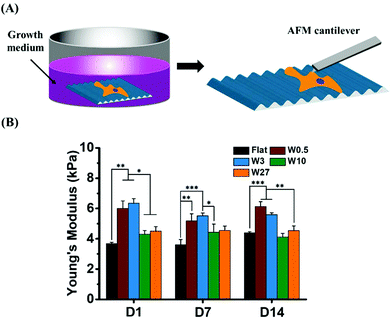
We hypothesized that cells would alter their stiffness due to the different cell shape (CAR). To examine the mechanical properties of hBM-MSCs influenced by topography, we determined the Young's modulus of single stem cells by AFM nanoindentation. The average values of Young's modulus obtained for single stem cell cultured in growth medium (GM) for 1, 7 and 14 days are plotted in Fig. 4. While hBM-MSCs on Flat displayed a Young's modulus of about 3.7 kPa, on W0.5 and W3 the stiffness increased to 6.0 and 6.4 kPa after 1 day of culture, respectively. Although, cells cultured on W10 and W27 seem to display a slightly higher Young's modulus (4.3 kPa and 4.5 kPa, respectively) than cells on the Flat substrate, no significant difference was found between them.With the culture time increasing, the stiffness of the MSCs cultured on W10 and W27 were still less affected than MSCs on W0.5 and W3. After 14 days, a slight increase (from 3.7 kPa to 4.4 kPa) of Young's modulus and little decrease (from 6.4 kPa to 5.6 kPa) were observed for cells grown on Flat and W3, respectively, while there were no significant changes detected over time for those grown on the other topography substrates. Therefore, the Young's modulus of hBM-MSCs cultured on W0.5 and W3 in GM was significantly higher than for the cells grown on Flat, W10, and W27. These results demonstrate that the same CAR (W3 and W27) does not lead to the same stiffness alteration and that an increasing CAR does not evoke an increasing stiffness. MSCs on W0.5 and W3 have a similar stiffness and on W10 a lower stiffness after 1 day even though the CAR is increased going from W0.5 to W10. These results indicate that the topography induced CAR alterations (altered cell elongation) is most likely not the best predictor for the cell development.
Varied mechanical properties mediated by focal adhesions
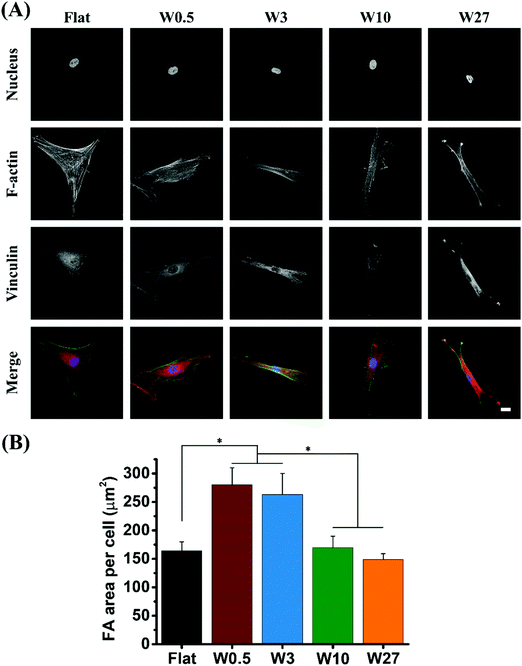
Based on our results demonstrating the significant difference for mechanical properties of cells, we hypothesized the difference may be due to the formation of focal adhesions (FA), as cells will generate tensions through actin cytoskeletons and exert traction forces on the underlying substrates via FAs.49,50 Also since it is known that mechanotaxis and topotaxis are mediated via a similar mechanism and are mediated through the FAs.51,52 FAs are adhesion plaques formed by an assembling complex of integrins and proteins. They act as a dynamic interface between internal cytoskeleton and ECM transmitting mechanical forces across the cell membrane.53 It has been demonstrated that the formation of FAs are related with the RhoA/ROCK signaling pathway influencing cell migration by affecting the cytoskeleton and cell contractility but it was also found that during osteogenic differentiation more FAs are beneficial for osteogenesis.25,54,55 Previous study have reported that topographical dimension can provide significant stimulation to influence the formation of focal adhesion complexes.24,56The expression of FA in hBM-MSCs was assessed by immunofluorescence staining for vinculin and visualized by CLSM after 24 hours seeded onto the different substrates. As shown in Fig. 5A, major differences in focal adhesion number and morphology were observed. For substrates of W0.5 and W3, hBM-MSCs had more well defined dash like vinculin spots (typical regarded as mature focal adhesions). In contrast, cells grown on Flat, W10 and W27 showed dot-like (transient) vinculin spots, indicating that W0.5 and W3 could enhance the expression of vinculin. To better understand the focal adhesion formation on different substrates, the FA area per cell was quantitatively analyzed (Fig. 5B). As vinculin is a key FA molecule that controls FA maturation by interactions with other FA proteins such as talin and actin,57 the size of focal adhesion complexes is always characterized by vinculin staining.25 FA area for cells cultured on W0.5 (275 μm2) and W3 (260 μm2) are much larger than Flat, W10 and W27 (about 150 μm2). These results suggest that, compared to Flat and higher wavelength wrinkle substrate (W10 and W27), small wavelength wrinkle substrate (W0.5 and W3) facilitate the formation of FA complexes.
Mechanotransduction (YAP) following single cell stiffness
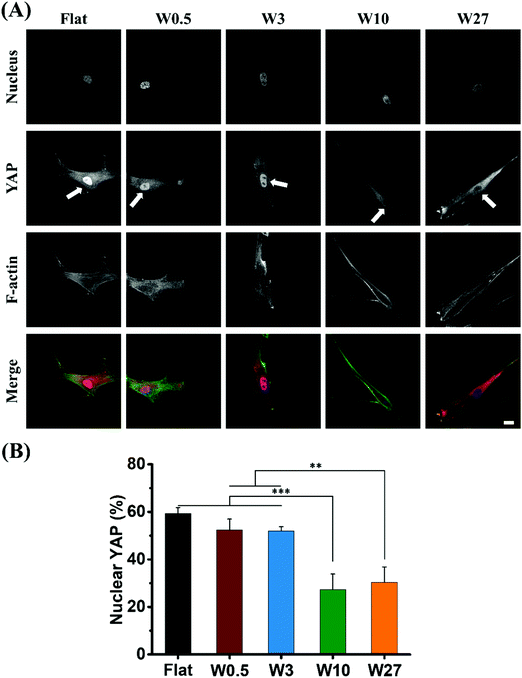
For studying physical cues such as mechanical properties or topography of the cell's surroundings, and the response of cells to these cues, YAP is the key regulatory element that controls the gene expression and is located either in the cytosol or in the nucleus as a consequence of the physical simuli the cell receives.35,58 The cell shape/morphology and polarity influence the YAP activity and its localization is very indicative for how the cell perceives mechanical properties and topography.59,60The expression of YAP in hBM-MSCs was assessed by immunofluorescence staining 24 hours after being seeded onto the different topographies. As shown in Fig. 6A, the topography had a substantial effect on the localization of YAP (cells with non-nuclear localization displayed in Fig. S2†). For cells cultured on Flat, W0.5 and W3 substrates, YAP was present in the cell nucleus for 52–60% of the cells (Fig. 6B). For cells cultured on W10 and W27, expression of YAP were predominantly cytoplasmic and the percentage of cells with nuclear positive YAP was only 27% and 30%, respectively. Although, all cells received the same mechanical dosing originating from an oxidized silicone surface, the only difference is the applied topographical stimulus. The percentage of nuclear YAP is conventionally higher for stiff surfaces but it clearly shows the difference in topography regulation.
Topography influences ALP expression of hBM-MSCs
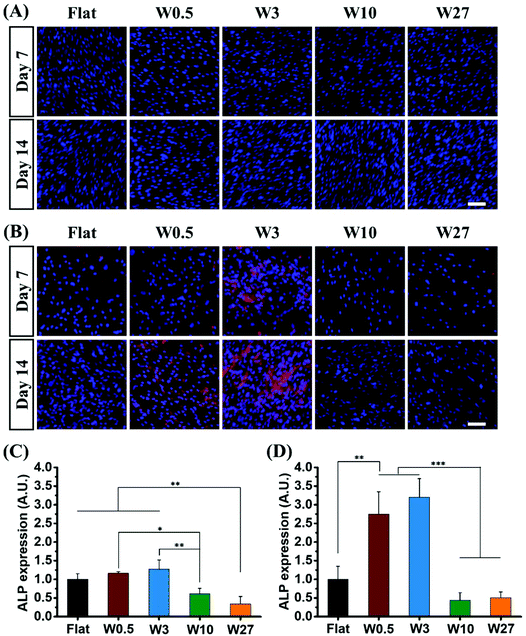
ALP is a well-known marker for the early state of osteogenic differentiation of hBM-MSCs.61 The influence of the topography on osteogenic differentiation of hBM-MSCs was investigated by immunodetection of ALP after 7 and 14 days of cell culture in GM and OM via automated imaging (TissueFaxs) that enables imaging using the same parameters with autofocus during the imaging process. Expression was assessed quantitatively by determining the fluorescence output.An immediate difference in fluorescence intensity of immunostained ALP is observed in Fig. 7A and B. Comparing MSCs cultured under growth conditions and osteogenic conditions show that hBM-MSCs cultured in GM for 7 and 14 days do not express ALP, while cells in OM showed increased expression of ALP. The expressed ALP varies among the different topographies that have been applied and illustrates the topography dependency on which the MSCs were cultured whereby W10 and W27 inhibited ALP expression as compared to the Flat control while W0.5 and W3 enhanced the ALP expression.
These effects were quantified by assessing the fluorescence and the results are shown in Fig. 7C and D for the 7 days and 14 days differentiation, respectively. The fluorescence output is corrected for the cell number and it correlated well with the qualitative analysis. The results show that W0.5 (CAR = 7.0) and W3 (CAR = 11.4) significantly facilitate osteogenic differentiation of hBM-MSCs as illustrated by a 1.2 and 1.3 fold increase, respectively as compared to the Flat substrate. Topographies W10 (CAR = 18.96) and W27 (CAR = 12.23) substantially suppressed ALP expression and displayed a 0.6 and 0.3 fold reduction, respectively (Fig. 7C). The difference became even more striking after 14 days of differentiation where a 2.8 and 3.2 fold increase was observed for W0.5 and W3 and a 0.4 and 0.5 fold reduction for W10 and W27 (Fig. 7D). While previously, an increasing CAR was considered to positively affect osteogenic differentiation, our results show that there is a limit to what extent elongation is beneficial. Interestingly, while W3 (CAR = 11.4) and W27 (CAR = 12.2) displayed similar elongation, their differentiation behavior were significantly different, indicating that cell elongation itself is not a determining factor.
Topography influences mineralization of hBM-MSCs
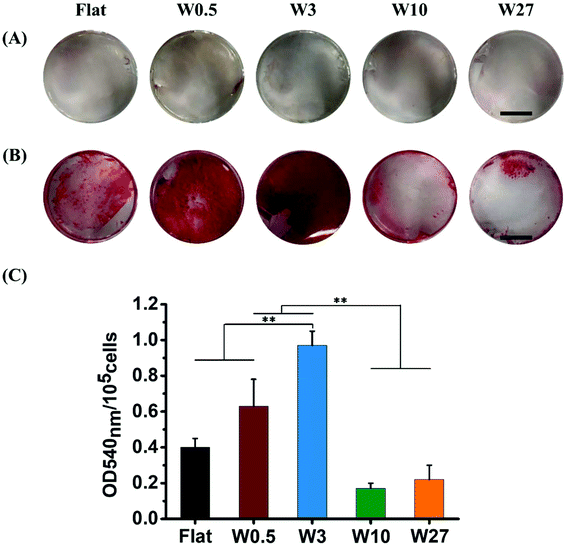
The production of mineralized calcium nodules by MSCs is an important function indicator used to evaluate the osteogenic differentiation62 and can be confirmed by Alizarin Red staining which stains calcium mineral.63 To assess the extent of osteogenesis, hBM-MSCs were stained using Alizarin Red after 21 days of culturing in either GM or OM. As shown in Fig. 8A, none of the hBM-MSCs cultured in GM deposited mineral (absence of red colored mineral), which is in line with above-mentioned results of ALP expression under the same culture conditions. For hBM-MSCs cultured in OM, mineral deposition was observed and greatly depended on the topography that was used (Fig. 8B).hBM-MSCs cultured on W0.5 and W3 in OM exhibited more mineralized calcium nodules than those on the Flat surface, while mineralization on W10 and W27 was rather minimal. To quantify the mineralization degree of hBM-MSC, the stained calcium deposits were de-stained, and the optical density (OD) of the extracted stains was measured at 540 nm. As shown in Fig. 8C, the highest OD540 was obtained for cells grown on W3 followed by those on W0.5, which indicates a higher level of osteogenesis. The OD540 was significantly lower for W10 and W27 while the OD540 obtained from the mineral deposition on Flat was in between W0.5/W3 and W10/W27. This further confirms that cells grown on the W0.5 (CAR = 7.0) and W3 (CAR = 11.4) substrates enhances osteogenic differentiation of hBM-MSC, while culturing on W10 (CAR = 19.0) and W27 (CAR = 12.2) inhibits osteogenesis. The mineralization results are in excellent agreement with the ALP expression determined on 7th and 14th day of differentiation. Overall, these results indicate that the CAR induced by topography regulates the fate of stem cells but not in the fashion as previously considered. A higher CAR does not result in enhanced osteogenic differentiation and inducing the same CAR using different topography does not lead to the same osteogenic differentiation capabilities.
Changes of cellular mechanical properties during osteogenic differentiation
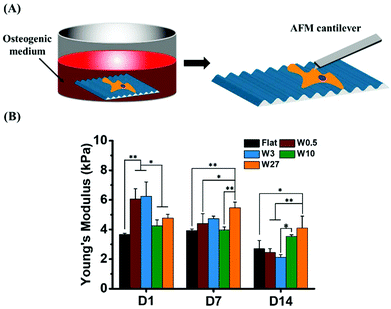
We hypothesize that cells will exhibit different mechanical properties during the process of osteogenesis. Therefore, we investigated the Young's modulus of single stem cells during the differentiation. The average values of Young's modulus obtained for single stem cell cultured in osteogenic induction medium (OM) for 1, 7 and 14 days are plotted in Fig. 9.Similar to the cells cultured in growth medium (Fig. 4B) after 1 day, hBM-MSCs grown on W0.5 and W3 displayed enhanced stiffness compared to Flat, W10 and W27. Intriguingly, the Young's modulus of cells grown on W3 in OM displayed the highest at the beginning and the fastest reduction in stiffness after 14 days of differentiation, from the initial value of ∼6.2 kPa on day one to ∼2.1 kPa on day 14. A similar trend was observed for MSCs cultured on W0.5. For cells grown on Flat, the Young's modulus slightly decreased after 14 days of cell culture from about 3.6 kPa to 2.7 kPa. The stiffness of the MSCs cultured on W10 and W27 did not display the same reduction in stiffness and thereby suggests that the mechanical alterations, reduction in stiffness, that is needed for proper differentiation is inhibited.
Discussion
The cell elongation, often addressed as the Cell Aspect Ratio or CAR, is an important factor to influence the osteogenic differentiation. Several studies have investigated the effect of aspect ratio of stem cells on the osteogenic differentiation, but it is not clear whether cell elongation (CAR) is the determining factor or that other factors are involved in this process. In this study, we investigated the effect of topography-induced cell elongation on osteogenic differentiation of hBM-MSCs by using topography to alter the CAR and to obtain similar CAR but with different topography stimulation (Fig. 3). The alterations in cell morphology and differentiation behavior were correlated to topography-induced changes in mechanical properties of single stem cells since it is known that mechanical properties of hBM-MSCs alter during osteogenic differentiation. The large differences between the different topographies is already eminent during the initial stage of cell development as first contact and adhesion phenomena of the cell to the biomaterial surface are highly indicative for further development, including differentiation.Previously, different groups studied the effect of CAR on differentiation of mesenchymal stem cells. Mrksich and co-workers32 reported that shapes leading to high contractility, an increase in CAR, increased the osteogenesis. On the other hand, according to Ding and coworkers,34 a CAR of about 2 was reported to be optimal, which is much lower than the CAR of around 7 as reported by Abagnale et al.24 These contradicting results indicate that the differentiation behavior is not directly associated with the cell shape but that other phenomena are affecting it. Based on our results (Fig. 7 and 8), we have shown that the degree of osteogenesis increases with the increasing CAR: 4.4, 7.0, 11.4. The relation between CAR and osteogenesis was non-linear, as the differentiation for cell with a CAR of 19.0 and 12.2 induced by the larger topographies, resulted in lower osteogenesis. Interestingly, despite the similar CAR for W3 and W27, the degree of osteogenesis of hBM-MSCs on those substrates was substantially different. This clearly illustrates that the somewhat contradictive results in previous studies may find its origin not in the cell shape/morphology but in another factor that directs the cellular behavior.
Despite W3 and W27 lead to similar CAR, the cells on W3 showed significantly higher stiffness at day 1 compared to W27 (Fig. 4). It is important to highlight that this is prior to differentiation induction rather than during differentiation, which means that cell stiffness is the cause for affecting stem cell differentiation rather than being an accompanying consequence of the process. More importantly, the differentiation on W3 is more efficient than on W27, which indicates that the higher cell stiffness at day 1 is another important factor compared with CAR. The higher cell mechanical properties on W3 is likely attributed to the more focal adhesions (Fig. 5), which leads to more percentage of YAP located into nuclear (Fig. 6), giving rise to higher degree of osteogenic differentiation. Our results are consistent with Dalby, Furukawa and Fu's study, which demonstrate that osteogenesis is mediated by enhanced focal adhesion,28 actin polymerization25 and YAP activation.64 A schematic representation of the mechanistic phenome at play is illustrated in Fig. 10 and describes the effect of similar CAR, stimulated by different wrinkle dimensions, on the osteogenic differentiation, which is at least partly mediated by the mechanical properties of hBM-MSCs and possibly connected to the focal adhesions providing the contact guidance information and YAP signal pathway. However, further investigation is necessary to fully elucidate focal adhesion, cytoskeleton organization, and components of YAP signaling cascade, such as the associated upstream regulators, in the regulation osteogenesis of hBM-MSCs stimulated by topography. In addition, our results illustrate that the absolute change of cell stiffness between initial and final differentiation is necessary and important for the successful osteogenic differentiation. This finding coincides well with Cho's study,65 who reported a Young's modulus for osteoblasts of about 1.7 kPa and also observed a significant decrease in the elastic modulus for hMSCs exposed to an osteogenic medium for 10 days.66 Therefore, based on the mechanical results, we not only show that the CAR is not the determining factor for osteogenesis, but that modulating the mechanical properties of the cells by means of topography is more important than the actual CAR itself for stem cell differentiation.
Several studies demonstrate that mechanical properties of the cell may be used as novel biological markers of cell phenotypes.67,68 Previous research has shown that the mechanical properties of single cells are strongly connected with their lineage.68 For example, osteoblasts exhibit stiffer properties than chondrocytes, which in turn is stiffer than adipocytes. Importantly, during the differentiation of hBM-MSCs into osteoblasts, the mechanics change accordingly. Previously, it was illustrated that there are striking different characteristics in actin organization between hBM-MSCs and osteoblasts. In hBM-MSCs, the actin is organized as thick bundles or stress fibers while thin dense microfilament meshwork are present in osteoblasts.65,66 The difference in actin organization was shown to be reflected in the cellular elasticity. The Young's modulus for hBM-MSCs is about two times higher than that for osteoblast (1.7 kPa).66 In our study, compared to control (Flat), MSCs cultured on W3 substrate showed substantial higher stiffness at the very beginning (day 1), and then exhibited fast and significant decrease of mechanical properties. In contrast, stem cells on W27 did not displayed the higher stiffness at day 1 nor the decrease during the whole differentiation process. Such detailed characterization of hMSC mechanics is helpful for the quickly and accurately distinguishing the successfully differentiation behavior or not, and could be used along or even replace the analysis of the biological or chemical processes (for example, ALP staining, Alizarin red staining, RT-PCR and western blotting), which is important for the rapidly growing field of stem-cell-based tissue engineering.
Mechano-sensing is often investigated by determining the activity of YAP, which has been correlated with mesenchymal stem cell fate decision via the interaction with key determinants of osteogenic (Runx2) or adipogenic (PPARγ) differentiation.69,70 High stiffness triggers YAP translocation to the nucleus and this process is accompanied by changes in cytoskeletal F-actin and focal adhesions.71,72 Our results showed that YAP localization and activity correlates with the cell differentiation behavior driven by topography size (Fig. 6). A higher percentage of nuclear localization of YAP was determined for cells on W0.5 and W3, which topographies facilitated osteogenic differentiation. However, for planar surface, even though the similar percentage of nuclear localization, the degree of osteogenesis was much lower when compared to W0.5 and W3. This disparity is likely attributable to two aspects. The higher nuclear localization of YAP is possibly due to the stiffness of PDMS material, which could significantly affect the localization of YAP. Previous reports shown that YAP was more localized in the cytoplasm of MSCs if cultured on soft hydrogel (0.7 kPa) whereas a stiff hydrogel (40 kPa) induces nuclear localization.72 In our study, the stiffness of PDMS used for culturing stem cells is within the range of MPa, orders of magnitude larger than kPa, so it is reasonable that cells grown on the planar surface possess high percentage of nuclear localization. hBM-MSCs cultured on the W10 and W27 displayed significantly lower nuclear YAP localization, which indicates that the topography is interfering with the mechano-sensing capabilities as the material properties in all cases is the same. Therefore, material stiffness promotes osteogenic differentiation via mechanotransduction of the material to the cell while topography promotes osteogenic differentiation via mechano-altering effects on the cell by the topography, which can be stimulated as well as inhibited by choosing the correct topography. This effect is not directly related to the cell elongation and suggests that different feature sizes act on different cellular mechanisms.
Although, here mechanical properties and cell morphology are carefully characterized, it has to be noted that the origin of the mechanical deviations is not known. Cytoskeletal arrangements, membrane tension, intracellular fluid pressure, location of larger organelles such as the nucleus below the cell membrane may all attribute to the altering properties. Also the projection of the cells are two dimensional, as is commonly done, but in terms of mechanical properties, volume could play a role as well and future investigations might provide more insights into the subcellular characteristics and the influence of these on cellular mechanical properties.
Conclusions
In this study, we investigated the effect of anisotropic topography on the single cell stiffness and also cell aspect ratio (CAR). For the first time we demonstrate that the increase in the extent of osteogenic differentiation was not only influenced by the CAR, but rather by the mechanical properties of the cells. hBM-MSCs grown on W3 were stimulated to have the highest mechanical property prior to differentiation and fastest reduction in cell stiffness during differentiation while hBM-MSCs on W27 were inhibited in their mechanical alterations resulting in impaired differentiation. Topography W3 and W27 displayed a similar CAR, hence a similar morphology, but the latter one had significantly lower osteogenic capacity indicating that single cell stiffness is another important factor than cell morphology and this was further exemplified by the enhanced focal adhesion area and nuclear localization of YAP for cells cultured on W3. Our study provides insight into how mechanical properties of the cell, controlled by topography, regulates the fate of hBM-MSCs. These insights may help us to enhance the understanding of interactions between stem cells and topography substrates for developing applications of tissue engineering and regenerative medicine.Conflicts of interest
The authors declare the following competing financial interest(s): P.v.R. also is co-founder, scientific advisor, and share-holder of BiomACS BV, a biomedical oriented screening company.Acknowledgements
The authors are very grateful for financial support of the China Scholarship Council (no. 201608310113, 201707720058 and 201406630003), the UMCG Microscopy and Imaging Center (UMIC) (NWO-grant 40-00506-98-9021), the grants from the GRF grant from the Research Grant Council of the Hong Kong Special Administrative Region Government (CityU11205514 and CityU11205815), the Scientific Research Foundation of Qingdao University (Grant No. DC1900009689), the Natural Science Foundation of Shandong Province, China (Grant No. ZR2019QC007) and China Postdoctoral Science Foundation (Grant No. RZ1900011066). We acknowledge Klaas Sjollema for assistance with TissueFaxs microscope.References
- A. Higuchi, Q. D. Ling, Y. Chang, S. T. Hsu and A. Umezawa, Chem. Rev., 2013, 113, 3297–3328 CrossRef CAS PubMed.
- D. Seliktar, Science, 2012, 336, 1124–1129 CrossRef CAS PubMed.
- Z. Chen, A. Bachhuka, S. Han, F. Wei, S. Lu, R. M. Visalakshan, K. Vasilev and Y. Xiao, ACS Nano, 2017, 11, 4494–4506 CrossRef CAS PubMed.
- M. Lin, S. Mao, J. Wang, J. Xing, Y. Wang, K. Cai and Y. Luo, Biomaterials, 2018, 162, 170–182 CrossRef CAS PubMed.
- S. Lee, A. E. Stanton, X. Tong and F. Yang, Biomaterials, 2019, 202, 26–34 CrossRef CAS PubMed.
- D. Zhang, S. Wu, J. Feng, Y. Duan, D. Xing and C. Gao, Acta Biomater., 2018, 74, 143–155 CrossRef CAS PubMed.
- M. Zhu, S. Lin, Y. Sun, Q. Feng, G. Li and L. Bian, Biomaterials, 2016, 77, 44–52 CrossRef CAS PubMed.
- E. Ko, S. J. Yu, G. J. Pagan-Diaz, Z. Mahmassani, M. D. Boppart, S. G. Im, R. Bashir and H. Kong, Adv. Sci., 2019, 6, 1801521 CrossRef PubMed.
- M. J. Dalby, N. Gadegaard and R. O. C. Oreffo, Nat. Mater., 2014, 13, 558–569 CrossRef CAS PubMed.
- A. B. Faia-Torres, S. Guimond-Lischer, M. Rottmar, M. Charnley, T. Goren, K. Maniura-Weber, N. D. Spencer, R. L. Reis, M. Textor and N. M. Neves, Biomaterials, 2014, 35, 9023–9032 CrossRef CAS PubMed.
- Y. C. Yeh, E. A. Corbin, S. R. Caliari, L. Ouyang, S. L. Vega, R. Truitt, L. Han, K. B. Margulies and J. A. Burdick, Biomaterials, 2017, 145, 23–32 CrossRef CAS PubMed.
- A. K. Yip, A. T. Nguyen, M. Rizwan, S. T. Wong, K.-H. Chiam and E. K. F. Yim, Biomaterials, 2018, 181, 103–112 CrossRef CAS PubMed.
- J. Baek, W.-B. Jung, Y. Cho, E. Lee, G.-T. Yun, S.-Y. Cho, H.-T. Jung and S. G. Im, ACS Appl. Mater. Interfaces, 2019, 11, 17247–17255 CrossRef CAS PubMed.
- F. Viela, D. Granados, A. Ayuso-Sacido and I. Rodríguez, Adv. Funct. Mater., 2016, 26, 5599–5609 CrossRef CAS.
- M. Poudineh, Z. Wang, M. Labib, M. Ahmadi, L. Zhang, J. Das, S. U. Ahmed, S. Angers and S. O. Kelley, Nano Lett., 2018, 18, 7188–7193 CrossRef CAS PubMed.
- J. Fiedler, B. Özdemir, J. Bartholomä, A. Plettl, R. E. Brenner and P. Ziemann, Biomaterials, 2013, 34, 8851–8859 CrossRef CAS PubMed.
- T. C. Von Erlach, S. Bertazzo, M. A. Wozniak, C. M. Horejs, S. A. Maynard, S. Attwood, B. K. Robinson, H. Autefage, C. Kallepitis, A. Del Río Hernández, C. S. Chen, S. Goldoni and M. M. Stevens, Nat. Mater., 2018, 17, 237–242 CrossRef CAS PubMed.
- S. Watari, K. Hayashi, J. A. Wood, P. Russell, P. F. Nealey, C. J. Murphy and D. C. Genetos, Biomaterials, 2012, 33, 128–136 CrossRef CAS PubMed.
- B. K. K. Teo, S. T. Wong, C. K. Lim, T. Y. S. Kung, C. H. Yap, Y. Ramagopal, L. H. Romer and E. K. F. Yim, ACS Nano, 2013, 7, 4785–4798 CrossRef CAS PubMed.
- L. Li, S. Yang, L. Xu, Y. Li, Y. Fu, H. Zhang and J. Song, Acta Biomater., 2019, 96, 674–685 CrossRef CAS PubMed.
- M. J. Dalby, N. Gadegaard, R. Tare, A. Andar, M. O. Riehle, P. Herzyk, C. D. W. Wilkinson and R. O. C. Oreffo, Nat. Mater., 2007, 6, 997–1003 CrossRef CAS PubMed.
- K. von der Mark, S. Bauer, J. Park and P. Schmuki, Proc. Natl. Acad. Sci. U. S. A., 2009, 106, E60–E60 CrossRef PubMed.
- S. Zhang, B. Ma, F. Liu, J. Duan, S. Wang, J. Qiu, D. Li, Y. Sang, C. Liu, D. Liu and H. Liu, Nano Lett., 2018, 18, 2243–2253 CrossRef CAS PubMed.
- G. Abagnale, M. Steger, V. H. Nguyen, N. Hersch, A. Sechi, S. Joussen, B. Denecke, R. Merkel, B. Hoffmann, A. Dreser, U. Schnakenberg, A. Gillner and W. Wagner, Biomaterials, 2015, 61, 316–326 CrossRef CAS PubMed.
- C. H. Seo, H. Jeong, Y. Feng, K. Montagne, T. Ushida, Y. Suzuki and K. S. Furukawa, Biomaterials, 2014, 35, 2245–2252 CrossRef CAS PubMed.
- C. Yang, F. W. DelRio, H. Ma, A. R. Killaars, L. P. Basta, K. A. Kyburz and K. S. Anseth, Proc. Natl. Acad. Sci. U. S. A., 2016, 113, E4439–E4445 CrossRef CAS PubMed.
- C. H. Seo, K. Furukawa, K. Montagne, H. Jeong and T. Ushida, Biomaterials, 2011, 32, 9568–9575 CrossRef CAS PubMed.
- J. Yang, L. E. McNamara, N. Gadegaard, E. V. Alakpa, K. V. Burgess, R. M. D. Meek and M. J. Dalby, ACS Nano, 2014, 8, 9941–9953 CrossRef CAS PubMed.
- W. Wang, Q. Liu, Y. Zhang and L. Zhao, Acta Biomater., 2014, 10, 3705–3715 CrossRef CAS PubMed.
- W. Wang, L. Zhao, K. Wu, Q. Ma, S. Mei, P. K. Chu, Q. Wang and Y. Zhang, Biomaterials, 2013, 34, 631–640 CrossRef CAS PubMed.
- H. Niu, D. Lin, W. Tang, Y. Ma, B. Duan, Y. Yuan and C. Liu, ACS Biomater. Sci. Eng., 2017, 3, 3161–3175 CrossRef CAS.
- K. A. Kilian, B. Bugarija, B. T. Lahn and M. Mrksich, Proc. Natl. Acad. Sci. U. S. A., 2010, 107, 4872–4877 CrossRef CAS PubMed.
- W. Song, H. Lu, N. Kawazoe and G. Chen, Langmuir, 2011, 27, 6155–6162 CrossRef CAS PubMed.
- R. Peng, X. Yao and J. Ding, Biomaterials, 2011, 32, 8048–8057 CrossRef CAS PubMed.
- M. Bao, J. Xie, A. Piruska and W. T. S. Huck, Nat. Commun., 2017, 8, 1–12 CrossRef CAS PubMed.
- X. Yao, R. Peng and J. Ding, Biomaterials, 2013, 34, 930–939 CrossRef CAS PubMed.
- P. S. Mathieu and E. G. Loboa, Tissue Eng., Part B, 2012, 18, 436–444 CrossRef CAS PubMed.
- E. K. F. Yim, E. M. Darling, K. Kulangara, F. Guilak and K. W. Leong, Biomaterials, 2010, 31, 1299–1306 CrossRef CAS PubMed.
- Q. Zhou, O. Castañeda Ocampo, C. F. Guimarães, P. T. Kühn, T. G. Van Kooten and P. Van Rijn, ACS Appl. Mater. Interfaces, 2017, 9, 31433–31445 CrossRef CAS PubMed.
- M. E. Berginski and S. M. Gomez, F1000Research, 2013, 2, 68–71 Search PubMed.
- Q. Zhou, L. Ge, C. F. Guimarães, P. T. Kühn, L. Yang and P. van Rijn, Adv. Mater. Interfaces, 2018, 1800504, 4–11 Search PubMed.
- P. T. Kuhn, Q. Zhou, T. A. B. van der Boon, A. M. Schaap-Oziemlak, T. G. van Kooten and P. van Rijn, ChemNanoMat, 2016, 2, 407–413 CrossRef.
- J. Kim, H. N. Kim, K. T. Lim, Y. Kim, S. Pandey, P. Garg, Y. H. Choung, P. H. Choung, K. Y. Suh and J. H. Chung, Biomaterials, 2013, 34, 7257–7268 CrossRef CAS PubMed.
- H. T. H. Au, I. Cheng, M. F. Chowdhury and M. Radisic, Biomaterials, 2007, 28, 4277–4293 CrossRef CAS PubMed.
- N. K. Relan, Y. Yang, S. Beqaj, J. H. Miner and L. Schuger, J. Cell Biol., 1999, 147, 1341–1350 CrossRef CAS PubMed.
- J. L. Charest, M. T. Eliason, A. J. García and W. P. King, Biomaterials, 2006, 27, 2487–2494 CrossRef CAS PubMed.
- K. Zhang, H. Zheng, S. Liang and C. Gao, Acta Biomater., 2016, 37, 131–142 CrossRef CAS PubMed.
- J. L. Charest, A. J. García and W. P. King, Biomaterials, 2007, 28, 2202–2210 CrossRef CAS PubMed.
- N. Q. Balaban, U. S. Schwarz, D. Riveline, P. Goichberg, G. Tzur, I. Sabanay, D. Mahalu, S. Safran, A. Bershadsky, L. Addadi and B. Geiger, Nat. Cell Biol., 2001, 3, 466–472 CrossRef CAS PubMed.
- P. Roca-Cusachs, A. Del Rio, E. Puklin-Faucher, N. C. Gauthier, N. Biais and M. P. Sheetz, Proc. Natl. Acad. Sci. U. S. A., 2013, 110, E1361–E1370 CrossRef CAS PubMed.
- X. Cao, E. Ban, B. M. Baker, Y. Lin, J. A. Burdick, C. S. Chen and V. B. Shenoy, Proc. Natl. Acad. Sci. U. S. A., 2017, 114, E4549–E4555 CrossRef CAS PubMed.
- D. H. Kim, K. Han, K. Gupta, K. W. Kwon, K. Y. Suh and A. Levchenko, Biomaterials, 2009, 30, 5433–5444 CrossRef CAS PubMed.
- S. Fusco, V. Panzetta, V. Embrione and P. A. Netti, Acta Biomater., 2015, 23, 63–71 CrossRef PubMed.
- I. Lauria, M. Kramer, T. Schröder, S. Kant, A. Hausmann, F. Böke, R. Leube, R. Telle and H. Fischer, Acta Biomater., 2016, 44, 85–96 CrossRef CAS PubMed.
- C. Zhou, D. Zhang, J. Zou, X. Li, S. Zou and J. Xie, ACS Appl. Mater. Interfaces, 2019, 11, 26448–26459 CrossRef CAS PubMed.
- Y. Yang, K. Kulangara, R. T. S. Lam, R. Dharmawan and K. W. Leong, ACS Nano, 2012, 6, 8591–8598 CrossRef CAS PubMed.
- A. M. Pasapera, I. C. Schneider, E. Rericha, D. D. Schlaepfer and C. M. Waterman, J. Cell Biol., 2010, 188, 877–890 CrossRef CAS PubMed.
- C. Yang, M. W. Tibbitt, L. Basta and K. S. Anseth, Nat. Mater., 2014, 13, 645–652 CrossRef CAS PubMed.
- A. Totaro, T. Panciera and S. Piccolo, Nat. Cell Biol., 2018, 20, 888–899 CrossRef CAS PubMed.
- C. Yang, M. W. Tibbitt, L. Basta and K. S. Anseth, Nat. Mater., 2014, 13, 645–652 CrossRef CAS PubMed.
- I. G. Kim, M. P. Hwang, P. Du, J. Ko, C. W. Ha, S. H. Do and K. Park, Biomaterials, 2015, 50, 75–86 CrossRef CAS PubMed.
- J. Qiu, J. Li, S. Wang, B. Ma, S. Zhang, W. Guo, X. Zhang, W. Tang, Y. Sang and H. Liu, Small, 2016, 12, 1770–1778 CrossRef CAS PubMed.
- A. B. Faia-Torres, M. Charnley, T. Goren, S. Guimond-Lischer, M. Rottmar, K. Maniura-Weber, N. D. Spencer, R. L. Reis, M. Textor and N. M. Neves, Acta Biomater., 2015, 28, 64–75 CrossRef CAS PubMed.
- X. Xue, X. Hong, Z. Li, C. X. Deng and J. Fu, Biomaterials, 2017, 134, 22–30 CrossRef CAS PubMed.
- I. Titushkin and M. Cho, Biophys. J., 2007, 93, 3693–3702 CrossRef CAS PubMed.
- I. A. Titushkin and M. R. Cho, Proc. 31st Annu. Int. Conf. IEEE Eng. Med. Biol. Soc. Eng. Futur. Biomed. EMBC 2009, 2009, vol. 60607, pp. 2090–2093.
- A. J. Engler, S. Sen, H. L. Sweeney and D. E. Discher, Cell, 2006, 126, 677–689 CrossRef CAS PubMed.
- E. M. Darling, S. Zauscher, J. A. Block and F. Guilak, Biophys. J., 2007, 92, 1784–1791 CrossRef CAS PubMed.
- J. Hong, J. Hong, E. S. Hwang, M. T. McManus, A. Amsterdam, Y. Tian, R. Kalmukova, E. Mueller, T. Benjamin, B. M. Spiegelman, P. A. Sharp, N. Hopkins, M. B. Yaffe, J. Hong, E. S. Hwang, M. T. McManus, A. Amsterdam, Y. Tian, R. Kalmukova, E. Mueller, T. Benjamin, B. M. Spiegelman, P. A. Sharp, N. Hopkins and M. B. Yaffe, Science, 2014, 1074, 1074–1078 Search PubMed.
- J. H. Hong and M. B. Yaffe, Cell Cycle, 2006, 5, 176–179 CrossRef CAS PubMed.
- S. Dupont, L. Morsut, M. Aragona, E. Enzo, S. Giulitti, M. Cordenonsi, F. Zanconato, J. Le Digabel, M. Forcato, S. Bicciato, N. Elvassore and S. Piccolo, Nature, 2011, 474, 179–183 CrossRef CAS PubMed.
- M. Aragona, T. Panciera, A. Manfrin, S. Giulitti, F. Michielin, N. Elvassore, S. Dupont and S. Piccolo, Cell, 2013, 154, 1047–1059 CrossRef CAS PubMed.
Footnotes |
| † Electronic supplementary information (ESI) available. See DOI: 10.1039/d0bm00264j |
| ‡ These authors contributed equally. |
| This journal is © The Royal Society of Chemistry 2020 |

