 Open Access Article
Metabolic profiling of rats poisoned with paraquat and treated with Xuebijing using a UPLC-QTOF-MS/MS metabolomics approach
Wen
Liu
 *abc,
Sha
Li
bd,
Yang Ke
Wu
b,
Xiao
Yan
ac,
Yi Ming
Zhu
c,
Fei Ya
Jiang
b,
Yu
Jiang
c,
Liang Hong
Zou
c and
Tong Tong
Wang
b
aDepartment of Pharmacy, Hunan Provincial People's Hospital/The First Affiliated Hospital of Hunan Normal University, Changsha, 410005, China. E-mail: liuwen@hunnu.edu.cn
bDepartment of Pharmacy, Medical School of Hunan Normal University, Changsha, China
cHunan Provincial Key Laboratory of Emergency and Critical Care Metabonomics, Changsha, China
dDepartment of Pharmacy, Changsha Stomatological Hospital, Changsha, China
First published on 13th August 2020
Abstract
Xuebijing (XBJ) is a compound Chinese medicine that contains Paeoniae Radix Rubra, ChuanXiong Rhizoma, Salvia Miltiorrhiza Radix et Rhizoma, Carthami Flos, and Angelicae Sinensis Radix. It is widely used in China to treat sepsis. Previous studies have demonstrated that XBJ can decrease mortality in patients with moderate paraquat poisoning. However, the mechanism by which it exerts this effect is not completely clear. In this study, an ultra-performance liquid chromatography quadrupole time-of-flight mass spectrometry (UPLC-QTOF-MS/MS)-based metabolomics approach was used to perform a metabolic profiling analysis. Principal component analysis (PCA), random forest (RF), and partial least squares discriminant analysis (PLS-DA) were used to identify metabolites to clarify the mechanism of XBJ's activity. XBJ clearly alleviated lung injury in a Sprague Dawley (SD) rat model of paraquat (PQ) poisoning. Seven metabolites related to four pathways, including those involved in sphingolipid and phospholipid metabolism, amino acid metabolism, unsaturated fatty acid metabolism, and pantothenic acid and CoA biosynthesis, were present at different levels in PQ-poisoned rats treated with XBJ compared with untreated rats. XBJ can ameliorate the effects of PQ poisoning in SD rats. Using a metabolomics approach enabled us to gain new insight into the mechanism underlying this effect.
1. Introduction
Xuebijing (XBJ), which is typically delivered by injection, is derived from a classical traditional Chinese medicine (TCM) decoction known as Xuefuzhuyu, which was approved by the Chinese Food and Drug Administration in 2004 and consists of Paeoniae Radix Rubra, ChuanXiong Rhizoma, Salvia Miltiorrhiza Radix et Rhizoma, Carthami Flos, and Angelicae Sinensis Radix.1 Pharmacological studies have shown that XBJ has anti-bacterial, anti-inflammatory, and anti-endotoxin properties that can block the progression of sepsis, and that it dramatically improves the symptoms of SIRS and MODS when used clinically.2Paraquat (PQ) is a fast-acting and non-selective contact herbicide that is widely used in developing countries. However, it is highly toxic to both humans and animals, and many cases of death due to acute PQ poisoning have been reported in recent decades.3 PQ accumulates in the lungs, reaching concentrations 6–10 fold higher than in the plasma, and leads to edema, hemorrhage, interstitial inflammation, severe lung injury, and progressive fibrosis.4 It is generally believed that the pathogenesis of PQ poisoning mainly involves the generation of superoxide radicals, followed by the activation of inflammatory cells, apoptosis, and other processes.5,6 The lack of a specific antidote is the main cause of the high death rate associated with PQ poisoning. XBJ, a traditional Chinese medicine, has anti-inflammatory and antioxidant effects, and can help clear toxins. Therefore, the superoxides produced by paraquat can be neutralized by XBJ.7,8 Shi et al. reported that XBJ can enhance the effectiveness of hemoperfusion in treating acute paraquat poisoning, and is better able to prevent pulmonary fibrosis than ulinastatin.2 In addition, a recent meta-analysis9 showed that the combination of XBJ and hemoperfusion in the treatment of PQ poisoning can help ameliorate organ dysfunction and prevent the occurrence of pulmonary fibrosis, thereby reducing the mortality rate. However, while there is a theoretical basis for using XBJ to treat patients with PQ poisoning, and it has been used for this purpose in China, the mechanism by which it exerts these therapeutic effects remains unclear.
Metabolomics is the study of the metabolic changes that occur in living systems in response to pathophysiological stimuli or genetic modifications.10 These changes are considered to be downstream manifestations of changes in protein expression, transcription, and gene expression, and as such could be used for diagnosing and characterizing diseases, assessing treatment response and toxicity, and making prognosis predictions, all based on sampling body fluids, which is less invasive than taking solid biopsies.11,12 Non-targeted metabolomics approaches can provide valuable information regarding the mechanisms by which TCMs exert their effects, as well as offering an overview of the multiple biochemical pathways involved in disease pathogenesis and the mechanism of action of multi-component medicines.13 Multiple analytical methods, such as nuclear magnetic resonance14 and mass spectrometry—which includes gas chromatography spectrometry (GC-MS)13 and liquid chromatography mass spectrometry (LC-MS)15—have been applied to metabolomics data. Among the aforementioned analytical methods, LC-MS is widely considered to be the most suitable method for analyzing biological samples. Ultra-high performance liquid chromatography-quadrupole time of flight mass spectrometry (UPLC-QTOF-MS) is regarded as an appropriate method for conducting metabolomics experiments due to its high accuracy and sensitivity for various metabolites.16 In this study, we used an UPLC-QTOF-MS/MS metabolomics approach combined with pattern recognition, cluster analysis, and metabolic pathway analyses to investigate changes in metabolite levels in SD rats poisoned with PQ and subsequently treated with XBJ or left untreated. Identifying potential biomarkers as well as metabolic pathways related to XBJ against PQ poisoning will help us to understand the potential efficacy and mechanism of XBJ in the treatment of PQ poisoning.
2. Materials and methods
2.1. Reagents
XBJ was purchased from Chase Sun Co., Ltd (Tianjin, China). PQ was purchased from Syngenta Nantong Crop Protection Co., Ltd. (Nantong, China). Formic acid (FA) (HPLC grade) was purchased from Aladdin Industrial Co., Ltd. (Shanghai, China). Methanol (HPLC grade) and acetonitrile (HPLC grade) were purchased from Merck (Darmstadt, Germany).2.2. Animals and groups
Sprague Dawley rats weighing 200–240 g were provided by Hunan Slack Jingda Experimental Animal Co., Ltd. (license number: SCXK (Xiang) 2016-0002). The rats were housed in an animal facility with a standard 12 h light/dark cycle under constant temperature conditions and with free access to food and water. All experimental procedures were conducted according to the Guidelines for Animal Care and were approved by the Administrative Committee for Experimental Animals of the Animal Research Center at Hunan Provincial People's Hospital. Forty-eight rats were randomized into four groups of 12 rats each: the control group, the model (PQ) group, the XBJ group, and the XBJ + PQ group. The model (PQ) group and the XBJ + PQ group received a single intragastric dose of PQ dissolved in 1 mL of saline (40 mg kg−1) on the first day, and the control group and the XBJ group received saline only. The XBJ group and the XBJ + PQ group were given 8 mL kg−1 of XBJ by tail vein injection 2 h later on the first day and the same amount of XBJ in the following six days. The control group and the model (PQ) group were given the same amount of saline by tail vein injection once a day for 7 days. At the end of the 1 day and 7 day experimental period, plasma and lung tissues were collected from the rats in each group and stored at −80 °C for subsequent analysis.2.3. Hematoxylin–eosin (HE) staining
HE staining was performed to detect lesions in the lungs. The pulmonary tissues were fixed for 24 h in 10% neutral formaldehyde, rinsed with constantly running water for 6 h, and dehydrated using an ethanol series: 70% ethanol (2 h), followed by 80% ethanol (overnight), 90% ethanol (2 h), and 100% ethanol (twice for 1 h each). Then the tissues were cleared with xylene, saturated with paraffin at 60 °C for 2 h, and embedded in paraffin blocks. The tissue blocks were sliced into 3 μm sections, floated in water to facilitate separation, mounted on glass slides, and allowed to dry at 60 °C for 24 h. Next, the slices were dewaxed with xylene and rehydrated using an ethanol series: 100% ethanol for 5 min twice, 95% ethanol for 2 min, 85% ethanol for 2 min, 75% ethanol for 2 min, and water for 2 min. The slices were then stained with hematoxylin for 5 min and eosin for 3 min, followed by dehydration in an ethanol series: 75% ethanol for 2 min, 85% ethanol for 2 min, 95% ethanol for 2 min, 100% ethanol for 5 min twice, and xylene for 10 min twice. The slices were then mounted using neutral balsam. The sections were observed and photographed using a microscope (Olympus) at 200× magnification.2.4. Determination of oxidative stress parameters and collagen measurement
The right upper lobe of each rat's lung was weighed and diluted with 10% normal saline, and then centrifuged at 3500 rpm for 10 min. The content of malondialdehyde (MDA), total superoxide dismutase (SOD), and hydroxyproline (HYP) in the supernatants was measured using an automatic biochemical detector and standard enzyme detection kits according to the manufacturer's instructions.2.5. Sample preparation
Two hundred microliter plasma samples were thawed at 4 °C, after which 600 μL of ice-cold methanol was added, and the samples were centrifuged (4 °C, 12![[thin space (1/6-em)]](https://www.rsc.org/images/entities/char_2009.gif) 000 rpm min−1, 15 min) to separate out the proteins. Next, 600 μL of the supernatant was dried under vacuum at room temperature, 200 μL of an acetonitrile
000 rpm min−1, 15 min) to separate out the proteins. Next, 600 μL of the supernatant was dried under vacuum at room temperature, 200 μL of an acetonitrile![[thin space (1/6-em)]](https://www.rsc.org/images/entities/char_2009.gif) :
:![[thin space (1/6-em)]](https://www.rsc.org/images/entities/char_2009.gif) water (1
water (1![[thin space (1/6-em)]](https://www.rsc.org/images/entities/char_2009.gif) :
:![[thin space (1/6-em)]](https://www.rsc.org/images/entities/char_2009.gif) 1) mixture was added, and the mixtures were centrifuged (4 °C, 12
1) mixture was added, and the mixtures were centrifuged (4 °C, 12![[thin space (1/6-em)]](https://www.rsc.org/images/entities/char_2009.gif) 000 rpm min−1, 15 min). Finally, 10 μL of the supernatant was analyzed by UPLC-QTOF-MS/MS. Equal volumes from all of the samples from the different groups were combined for use as a quality control (QC) sample, and this QC sample was prepared as described above.
000 rpm min−1, 15 min). Finally, 10 μL of the supernatant was analyzed by UPLC-QTOF-MS/MS. Equal volumes from all of the samples from the different groups were combined for use as a quality control (QC) sample, and this QC sample was prepared as described above.
2.6. UPLC-QTOF-MS/MS analysis
Ten microliters of each sample were separated at 30 °C on an Ultimate 3000 LC system (Thermo Fisher Scientific, USA) coupled to an Acclaim TM 120 C18 column (2.1 × 100 mm, 2.2 μm, Thermo Fisher Scientific, USA). The flow rate was set to 0.2 mL min−1. The mobile phase consisted of 0.1% formic acid in water (A) and ACN (B), and was run using an optimized gradient program with the following parameters: 2% B at 0–2 min, 2–50% B at 2–12 min, 50–90% B at 12–20 min, 90% B at 20–30 min, 2% B at 30.1 min, and 2% B at 30.1–35 min to re-equilibrate the column.The MS analysis was performed using a Bruker (IMPACT II) QTOF spectrometer. The MS parameters were as follows: the instrument was operated in positive- or negative-ion mode, with a capillary voltage of 4500 V (positive) or 3500 V (negative); a drying gas (N2) flow rate of 8.0 L min−1; a drying gas temperature of 200 °C; nebulizer at 2.0 bar; and an end-plate offset of 500 V. Mass spectra were recorded across a range of 20–1000 Da. To avoid possible contamination and maintain a stable signal, the QTOF mass spectrometer system was tuned for optimal accuracy and reproducibility using sodium formate for both the positive and negative ion modes.
2.7. Analytical method validation and quality control
Precision and repeatability, as assessed by relative standard deviation (RSD), are important aspects of analytical chemistry methods. To ensure the accuracy and repeatability of the sample analysis, a QC sample was analyzed along with the study samples. Precision was assessed by injecting 6 consecutive QC samples prior to injection of the study samples, and repeatability was assessed by injecting 1 QC sample for every 6 study samples. The RSDs of the retention times and peak intensities of 6 randomly selected ions with different m/z values across the breadth of the sample spectra were assessed, and RSD values of <15% were considered to indicate sufficient precision and repeatability. A principal component analysis (PCA) was performed for all QC samples. At the beginning of the sample analysis process, the system was equilibrated by running 5 blanks under the aforementioned chromatographic conditions. The UPLC-QTOF-MS/MS program was run in positive-ion mode and then in negative-ion mode. To avoid sequence effects, a randomized crossover method was used to determine the sample order: 6 samples, followed by 1 QC and 1 blank.2.8. Data preprocessing
The UPLC-QTOF-MS/MS data were imported into MetaScape 3.0 (Bruker Corporation) to perform peak detection and alignment. The parameters were as follows: chromatographic peaks with a retention time of 0–30 min, a peak intensity threshold of 1000, and a minimum peak length of 5 spectra were selected, the peaks were screened according to the “80% rule”, and the mass spectrometry data were normalized to sodium formate. After each peak was identified and aligned, the intensity of each ion was normalized to the total ion intensity in each chromatogram. Subsequently, the secondary mass spectra were identified by searching the Bruker spectroscopic database and HMDB online. Finally, the three-dimensional matrix information included retention time, mass-to-charge ratio (m/z), ion intensity, and compound name. Next, the data were exported to the multivariate statistical software program SIMCA (version 14.1, Umetrics, Umea, Sweden) for subsequent PCA and partial least squares discriminant analysis (PLS-DA). Then, by drawing all the data on VIP, we selected the substances with VIP > 1.0 as the primary identification metabolites.2.9. Statistical analysis
Statistical analysis was carried out using SPSS 22.0 software (IBM, USA). An independent sample t-test was applied in order to detect significant differences in all metabolites for different groups. A p-value of <0.05 was considered statistically significant.3. Results
3.1. Histopathology
To assess the protective effects of XBJ, the lung tissue sections were observed under a light microscope. As shown in Fig. 1, the lung tissues from the control group appeared normal and had an intact alveolar structure. Clear inflammatory cell infiltration was observed one day after PQ administration. By the seventh day, the local alveolar structure had disappeared, a large amount of inflammatory substances had been released, and fibroblast proliferation had occurred. Although varying degrees of inflammation were observed in lung tissue from the XBJ + PQ group, the lesions were less severe than those seen in the model group.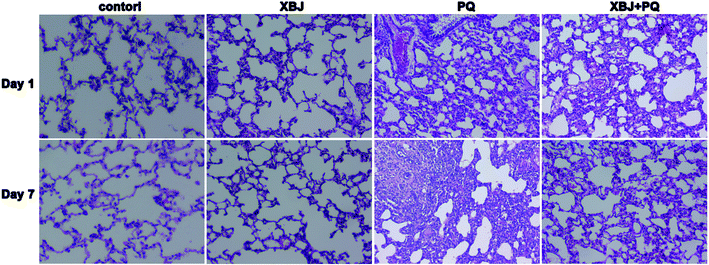 | ||
| Fig. 1 Lung histomorphological observations by light microscopy for the four groups on days 1 and 7. | ||
3.2. Oxidation parameter levels and collagen content
The experiments were performed in strict accordance with the kit instructions. The levels of the oxidation parameters for the different groups are shown in Table 1. SOD levels were higher in the control group than in the PQ group, while MDA and HYP levels were lower in the control group than in the PQ group. These differences were statistically significant (p < 0.05), indicating that the lung injury model had been successfully established. The oxidation parameters and collagen content for the XBJ + PQ group were better preserved than those for the PQ group (p < 0.05), providing powerful evidence that XBJ protected rats from PQ-induced lung injury.| Parameters | Groups | 1 d | 7 d |
|---|---|---|---|
| a * represents the comparison between the PQ group (and XBJ group) and control group, * indicates p < 0.05, ** indicates p < 0.01; # represents the comparison between XBJ + PQ and PQ group, # indicates p < 0.05, ## indicates p < 0.01. | |||
| SOD (U mgprot−1) | Control group | 231.61 ± 12.35 | 237.97 ± 12.54 |
| PQ group | 191.95 ± 6.6** | 213.11 ± 24.03 | |
| XBJ group | 211.56 ± 13.24 | 225.74 ± 10.28 | |
| XBJ + PQ group | 200.98 ± 36.56 | 256.69 ± 26.95## | |
| MDA (nmol mgprot−1) | Control group | 0.6 ± 0.04 | 0.62 ± 0.04 |
| PQ group | 0.75 ± 0.09** | 0.74 ± 0.03** | |
| XBJ group | 0.63 ± 0.02 | 0.65 ± 0.03 | |
| XBJ + PQ group | 0.65 ± 0.1# | 0.61 ± 0.05## | |
| HYP (μg mg−1) | Control group | 0.84 ± 0.06 | 0.79 ± 0.07 |
| PQ group | 0.94 ± 0.1* | 1.06 ± 0.04** | |
| XBJ group | 0.87 ± 0.05 | 0.77 ± 0.06 | |
| XBJ + PQ group | 0.94 ± 0.06 | 0.88 ± 0.04## | |
3.3. QC sample pretreatment
Six QC samples were analyzed in order to test the stability and repeatability of the system before sampling. A total of 526 ion peaks in positive-ion mode and 580 in negative-ion mode were captured from mixed QC samples using the alignment software. After normalization, the RSD of 6 ion peaks was calculated for all of the QC samples. Regarding precision, the RSD for retention time ranged from 0.00% to 0.43%, and the peak intensity ranged from 2.24% to 12.31% in positive-ion mode; the RSD for retention time ranged from 0.00% to 0.59%, and the peak intensity ranged from 3.21% to 13.55% in negative-ion mode. Regarding repeatability, the RSD for retention time ranged from 0.00% to 0.80%, and the peak intensity ranged from 4.27% to 10.28% in positive-ion mode; the RSD for retention time ranged from 0.00% to 0.58%, and the peak intensity ranged from 1.55% to 10.28% in negative-ion mode. These values were all below 15%, indicating that the analytical methods were sufficiently precise and repeatable. The scatter diagram of the first principal component of the QC sample shows that all QC samples are distributed in the range of 2SD, indicating that the consistency of experimental operation and the stability of the instrument system are within the controllable range (Fig. 2). Representative baseline peak intensity chromatograms generated from the plasma samples demonstrated that the sample metabolites were adequately separated on a UPLC C18 column by gradient elution (Fig. 3).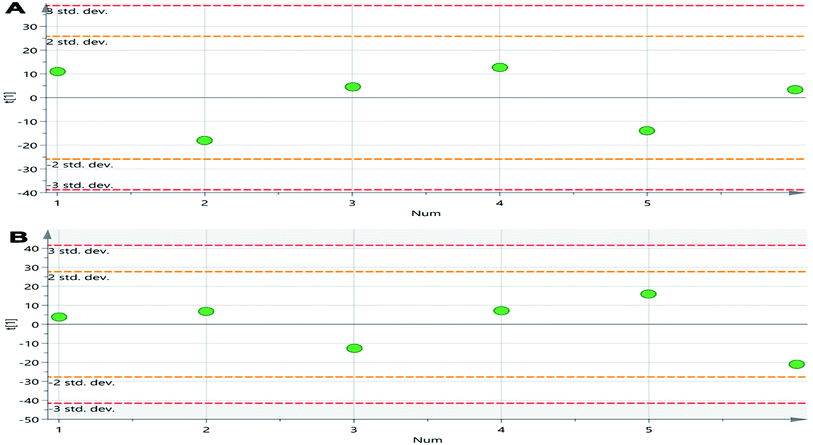 | ||
| Fig. 2 The scatter distribution plot in the first principal components in positive ion mode (A) and in negative ion mode (B). | ||
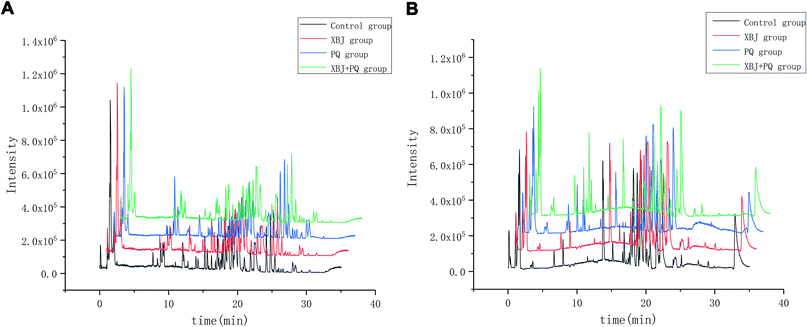 | ||
| Fig. 3 Representative base peak chromatogram (BPC) of serum obtained from different groups of rats in the positive mode (A) and negative mode (B). | ||
3.4. Screening and identification of potential biomarkers
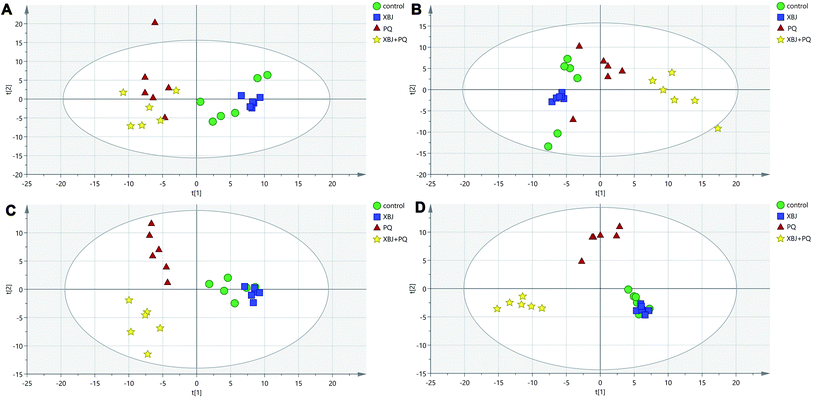
The positive and negative ions from each sample were detected simultaneously. Three hundred and three positive ions and 295 negative ions were identified using a standard database, the HMDB database, and an online database. After the ion peaks were normalized and centered, the data from the samples from the different groups (excluding the QC samples) were analyzed using SIMCA software. Automatic fitting of the PCA model generated a scatter plot showing clear separation of the different groups, as shown in Fig. 4A and B. To further differentiate the different groups, a PLS-DA model was established, and the resulting scatter plot showed complete separation between the 4 groups (Fig. 4C and D). Next, a random forest analysis was performed to generate a projected 3D image (Fig. 5A and B). The results from this analysis exhibited complete separation between the groups. Additionally, 200 permutation tests were performed to check whether the PLS-DA model over-fit or not. The R2Y and Q2 obtained from the displacement test of this model are far lower than the original point on the right, the R2Y values of all displacements are lower than the actual data (1), and Q2 values are lower than 0, indicating that the model has no over-fitting phenomenon, which proves that the model is effective (Fig. 6A and C). VIP values can be used to identify metabolites that are potentially associated with various biological states or conditions. In our study, a VIP value of >1.0 was considered significant; these values are indicated in red in Fig. 6B and D.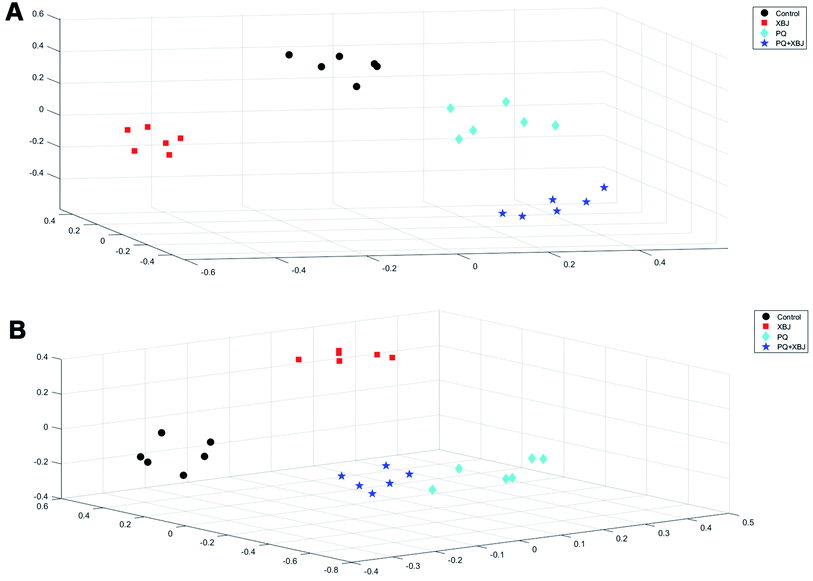 | ||
| Fig. 5 3D projection of 1000 decision trees in the RF model under positive ion mode (A) and negative ion mode (B). | ||
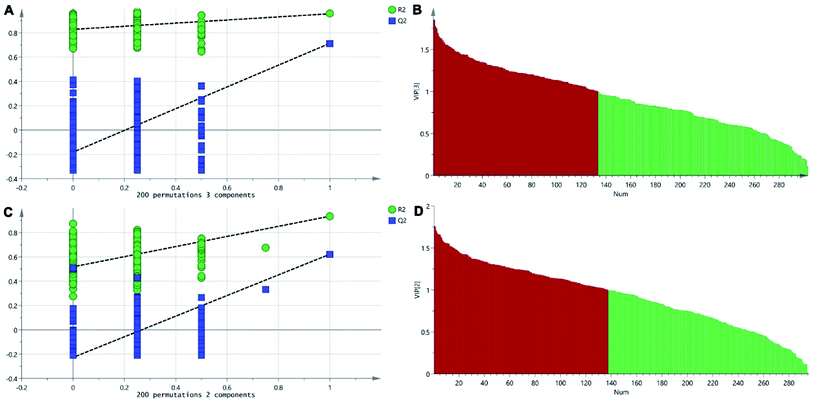 | ||
| Fig. 6 The permutation test of the three groups in positive ion mode (A) and in the negative mode (C); the VIP plot of the three groups in positive ion mode (B) and in the negative mode (D). | ||
The variable importance in the projection (VIP) value for each variable based on the PLS-DA model was calculated to determine its contribution to the phenotype. Metabolites with a VIP value > 1.0 were further subjected to a Student's t-test at the univariate level to determine the significance of the change in each metabolite's level between groups; p-values less than 0.05 were considered significant.
In total, the levels of 10 metabolites showed significant differences between the control group and the PQ group. Treatment with XBJ resulted in restoration of the levels of seven out of 10 of these metabolites to levels comparable to those observed in the control group (Table 2).
| No. | Time/min | m/z | Metabolite | Formula | Ion | VIP | Fold change (PQ/CON) | Fold change (XBJ/PQ) | Pathway involved |
|---|---|---|---|---|---|---|---|---|---|
| a * The values were statistically significant (p < 0.05); ↑ the metabolites were up-regulated; ↓ the metabolites were down-regulated. | |||||||||
| 1 | 0.23 | 170.05552 | 3,4-Dihydroxyphenylglycol | C8H10O4 | [M + H]+ | 1.99 | 0.87↓* | 0.91↓* | Tyrosine metabolism |
| 2 | 1.07 | 150.00159 | Alpha-fluoro-beta-ureidopropionic acid | C4H7FN2O3 | [M + H]+ | 1.95 | 0.95↓* | 0.83↓* | |
| 3 | 1.62 | 219.11071 | Pantothenic acid | C9H17NO5 | [M + H]+ | 1.39 | 1.27↑* | 0.77↓* | |
| 4 | 28.13 | 282.25565 | Oleic acid | C18H34O2 | [M + H]+ | 1.69 | 0.48↓* | 2.18↑* | Biosynthesis of unsaturated fatty acids/fatty acid biosynthesis |
| 5 | 9.22 | 213.00982 | Indoxyl sulfate | C8H7NO4S | [M − H]− | 1.29 | 1.36↑* | 0.72↓* | Pentose and glucuronate interconversions/starch and sucrose metabolism |
| 6 | 11.01 | 298.10561 | 2-Phenylethanol glucuronide | C14H18O7 | [M − H]− | 1.73 | 1.17↑* | 2.06↑* | |
| 7 | 17.59 | 381.26490 | Sphingosin-1 phosphate | C18H40NO5P | [M − H]− | 1.73 | 1.79↑* | 0.41↓* | Sphingolipid metabolism |
| 8 | 18.45 | 571.34901 | Lyso-PC (22:4(7Z,10Z,13Z,16Z)) | C30H54NO7P | [M − H]− | 1.49 | 1.32↑* | 0.59↓* | Glycerophospholipid metabolism |
| 9 | 24.36 | 296.19662 | 9,10-Epoxyoctadecenoic acid | C18H32O3 | [M − H]− | 1.42 | 0.94↓* | 1.66↑* | Linoleic acid metabolism |
| 10 | 27.20 | 306.25625 | 8,11,14-Eicosatrienoic acid | C20H34O2 | [M − H]− | 1.6 | 0.87↓* | 2.07↑* | Biosynthesis of unsaturated fatty acids |
3.5. Metabolite analysis
A heat map was then generated using MetaboAnalyst 4.0 software to determine whether the levels of the discriminating metabolites increased or decreased (Fig. 7A), and a metabolic pathway analysis was performed (Fig. 7B). The heat map showed clear separation between the control group and the PQ group, indicating that PQ poisoning dramatically altered the levels of these metabolites in rats, while treatment with XBJ reversed some of these changes. This suggests that XBJ plays an important role in regulating the metabolic pathways affected by PQ poisoning. | ||
| Fig. 7 (A) The heat map of the disordered metabolites in different groups. (B) The metabolic pathway map of differential metabolites. | ||
4. Discussion
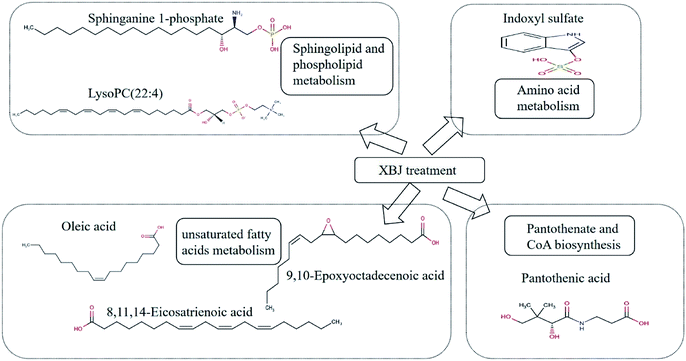
In this study, the effects of XBJ on plasma metabolites in a rat model of PQ poisoning were investigated by UPLC-QTOF-MS/MS to gain a better understanding of the therapeutic mechanism of XBJ. We found that PQ poisoning significantly altered the levels of 10 metabolites in rats. Treatment with XBJ reversed this change for 7 out of the 10 metabolites, including those involved in sphingolipid and phospholipid metabolism, amino acid metabolism, unsaturated fatty acid metabolism, and pantothenic acid and CoA biosynthesis. The identification of these disordered metabolic pathways could be used to help elucidate the mechanism underlying the therapeutic effects of XBJ.4.1. Sphingolipid and phospholipid metabolism
Sphingosin-1 phosphate (S1P) is a metabolite of lyso-phospholipid sphingomyelin, which has important biological roles and is involved in a variety of physiological processes such as cell growth, proliferation, and migration, cytoskeleton reconstruction, and lymphocyte transport.17 Earlier studies18,19 have shown that sphingolipid metabolism is closely linked to inflammation and oxidation. In addition, the sphingolipid S1P is abundant in mammals and plays a key role in the pathological changes that occur in lung disease by participating in inflammation and protecting the endothelial cell barrier, as well as potentially activating pulmonary fibroblasts and contributing to the development of pulmonary fibrosis.20–22 In our study, we detected significantly higher levels of S1P in the PQ group than in the control group. We speculate that PQ induces peroxidation, leading to serious damage to the cell membranes, thereby increasing sphingosine metabolism and ultimately increasing S1P levels. Dysregulation of this metabolic pathway may promote lung injury. The phenomenon was reversed when the rats were treated with XBJ, suggesting that, in these rats, the sphingolipid metabolic pathway was inhibited, and lung injury was reduced.Lysophosphatidylcholine is the main component of low-density lipoprotein cholesterol (LDL-c). It is the most abundant glycerol phospholipid in mammal cell membranes,23 and is a highly bioactive molecule. Lysophosphatidylcholine transmits signals through G protein-coupled receptors. Cytokines, neurotransmitters, hormones, and other extracellular signals can lead to the activation of the cytoplasmic enzyme PLA2, thereby releasing phosphatidylcholine (PC) into the cytoplasm.24 Interestingly, some types of PCs act as important biomarkers of inflammation.25 According to our results, when rats are exposed to PQ, PC (22:4) is released in large quantities, resulting in inflammation. Furthermore, treatment with XBJ significantly lowered PC (22:4) levels, protecting cell membranes and alleviating inflammation. Hence, sphingolipid and phospholipid metabolism appear to play important roles in lung injury.
4.2. Amino acid metabolism
Indole sulfate is a metabolite of dietary protein and tryptophan that stimulates glomerulosclerosis and the development of interstitial fibrosis.26 In addition, indole sulfate can substantially reduce glutathione levels27 and regulate the oxidative stress response.28 According to our results, PQ poisoning led to increased indole sulfate levels in rats, suggesting that PQ may promote the development of interstitial fibrosis. Treatment with XBJ led to a clear decline in indole sulfate levels, indicating that XBJ could play a protective role by reducing the level of oxidative stress.4.3. Unsaturated fatty acid metabolism
Oleic acid, an ω-9 monounsaturated fatty acid, is a natural agonist of the peroxisome proliferator-activated receptor (PPAR), which is a ligand-activated transcription factor that plays an important role in inflammation and lipid and glucose metabolism.29 Furthermore, PPAR can stimulate the dedifferentiation of activated myofibroblasts to adipose fibroblasts, which can help ameliorate the symptoms of idiopathic pulmonary fibrosis.30 Studies suggested that low concentrations of oleic acid accelerate LPS-induced cell death through oxidative stress and inflammation.31 In addition, 9,10-epoxy octadecanoic acid (9,10-EOA) is the peroxide product of linoleic acid (LA), which consumes excessive unsaturated fatty acids and is also the ligand of proliferator-activated receptor-2 (PPARr-2). In our study, we found that the plasma levels of oleic acid and 9,10-EOA in the PQ group were lower than those in the control group. Treatment with XBJ led to a rise in 9,10-EOA levels, which may have been caused by PPAR activation because of increased levels of unsaturated fatty acids, inhibition of the release of inflammatory mediators, amelioration of the oxidative stress induced by PQ, and reduced lung injury. In addition, 8,11,14-eicosatrienoic acid (DGLA) is an unsaturated fatty acid that can be converted to prostaglandin E1 (PGE1), which can attenuate or even reverse TGF-β1-induced differentiation of myofibroblasts.32 In addition, DGLA competes with arachidonic acid for COX and lipoxygenase and mediates the production of a series of inflammatory factors. Our results suggest that DGLA levels decreased after PQ poisoning, promoting myofibroblast differentiation and accelerating fibrosis. Treatment with XBJ may inhibit myofibroblast differentiation and play a protective role in rat lung tissue.4.4. Pantothenate and CoA biosynthesis
Pantothenic acid is a B vitamin that is required for coenzyme A synthesis, binds to acyl carrier protein (ACP), and is involved in redox and the TCA cycle in the mitochondria.25,33 Pantothenic acid deficiency can lead to stunted growth, weight loss, dermatitis, dyslipidemia, neuropathy, and adrenal disease.34 More importantly, pantothenic acid directly or indirectly synthesizes KGF and type IV collagen to build keratinocytes that proliferate and differentiate, and has certain regulatory effects on the epidermis and on barrier function.35 It can also significantly increase the activity of GSH-Px and reduce the MDA content of serum.36 Our results showed reduced plasma levels of pantothenic acid in the PQ group compared with the control group, indicating that PQ poisoning induced mitochondrial peroxidation, which led to tissue damage. Treatment with XBJ led to a significant increase in pantothenic acid levels, thereby protecting the tissues. This suggests that XBJ regulates pantothenic acid levels through the mitochondria to protect the body from oxidative stress and maintain the normal mitochondrial structure and function.5. Conclusion
In this study we used a metabolomics approach to elucidate the mechanism underlying the therapeutic effects of XBJ in a rat model of PQ poisoning. Assessment of lung tissue sections and lung injury indicators showed that XBJ had a significant effect on rats poisoned with PQ. Using a UPLC-QTOF/MS-based metabolomics approach combined with multivariate analysis, we were able to explore the metabolic changes induced by XBJ in these rats. Altogether, 10 metabolites were present at significantly different levels in the control group and the PQ group. Treatment with XBJ reversed this change for seven of the 10 metabolites. Furthermore, the pathway analysis indicated that treating the poisoned rats with XBJ altered sphingolipid and phospholipid metabolism, amino acid metabolism, unsaturated fatty acid metabolism, and pantothenic acid and CoA biosynthesis (Fig. 8). In summary, our study shows that metabolomics is an effective method for elucidating the mechanism underlying the beneficial effects of XBJ, and that XBJ mitigates the effects of PQ poisoning by regulating multiple metabolic pathways. These findings provide a better understanding of the mechanism of XBJ and could help expand its use in clinical settings.Funding
This work was supported by the Scientific Research Project of Hunan Provincial Commission of Health and Family Planning (no. B2017076), a research project with the Hunan Administration of Traditional Chinese Medicine (no. 201922), the Scientific Research Project of the Changsha Science and Technology Department (No. 201822) and the Foundation of Hunan Provincial Key Laboratory of Emergency and Critical Care Metabonomics.Author contributions
WL designed the study and amended the paper. WL, SL, YKW, XY, FJ and TTW performed the experiments and wrote the manuscript. SL, YJ, and LHZ analyzed the data, and YMZ amended the paper.Conflicts of interest
The authors have declared no conflicts of interest.Acknowledgements
We thank Emily Crow, PhD, from Liwen Bianji, for editing the English text of a draft of this manuscript.References
- H. Huang, L. Ji, S. Song, J. Wang, N. Wei, M. Jiang, G. Bai and G. Luo, Phytochem. Anal., 2011, 22, 330–338 CrossRef CAS.
- H. Shi, Y. Hong, J. Qian, X. Cai and S. Chen, Am. J. Emerg. Med., 2017, 35, 285–291 CrossRef.
- L. Senarathna, M. Eddleston, M. F. Wilks, B. H. Woollen, J. A. Tomenson, D. M. Roberts and N. A. Buckley, Q. J. Med., 2009, 102, 251–259 CrossRef CAS.
- C. Berry, C. La Vecchia and P. Nicotera, Cell Death Differ., 2010, 17, 1115–1125 CrossRef CAS.
- X. Chen, Y. Feng, X. Shen, G. Pan, G. Fan, X. Gao, J. Han and Y. Zhu, J. Ethnopharmacol., 2018, 211, 358–365 CrossRef.
- Z. Suntres, Toxicology, 2002, 180, 65–77 CrossRef CAS.
- M. Liu, M. Su, W. Zhang, Y. Wang, M. Chen, L. Wang and C. Qian, BMC Complementary Altern. Med., 2014, 14, 498–512 CrossRef.
- J. Xu, World J. Emerg. Med., 2017, 8, 61 CrossRef.
- P. Gong, Z. Lu, J. Xing, N. Wang and Y. Zhang, PLoS One, 2015, 10, e0130508 CrossRef.
- A. McCartney, A. Vignoli, L. Biganzoli, R. Love, L. Tenori, C. Luchinat and A. Di Leo, Cancer Treat. Rev., 2018, 67, 88–96 CrossRef.
- W. B. Dunn, D. I. Broadhurst, H. J. Atherton, R. Goodacre and J. L. Griffin, Chem. Soc. Rev., 2011, 40, 387–426 RSC.
- J. L. Griffin, Philos. Trans. R. Soc., B, 2006, 361, 147–161 CrossRef.
- X. Zhou, Y. Wang, Y. Yun, Z. Xia, H. Lu, J. Luo and Y. Liang, Talanta, 2016, 147, 82–89 CrossRef CAS.
- C. Zhu, V. Faillace, F. Laus, M. Bazzano and L. Laghi, Metabolomics, 2018, 14, 106 CrossRef.
- C. Fu, Q. Wu, Z. Zhang, Z. Xia, H. Ji, H. Lu and Y. Wang, J. Ethnopharmacol., 2019, 245, 112149 CrossRef CAS.
- K. M. Sas, A. Karnovsky, G. Michailidis and S. Pennathur, Diabetes, 2015, 64, 718–732 CrossRef CAS.
- S. E. Alvarez, S. Milstien and S. Spiegel, Trends Endocrinol. Metab., 2007, 18, 300–307 CrossRef CAS.
- W. Hoetzenecker, B. Echtenacher, E. Guenova, K. Hoetzenecker, F. Woelbing, J. Brück, A. Teske, N. Valtcheva, K. Fuchs, M. Kneilling, J.-H. Park, K.-H. Kim, K.-W. Kim, P. Hoffmann, C. Krenn, T. Hai, K. Ghoreschi, T. Biedermann and M. Röcken, Nat. Med., 2012, 18, 128–134 CrossRef CAS.
- Y. Zong and H. Zhang, Acta Biochim. Pol., 2017, 64, 93–98 CAS.
- I. Gorshkova, T. Zhou, B. Mathew, J. R. Jacobson, D. Takekoshi, P. Bhattacharya, B. Smith, B. Aydogan, R. R. Weichselbaum, V. Natarajan, J. G. N. Garcia and E. V. Berdyshev, J. Lipid Res., 2012, 53, 1553–1568 CrossRef CAS.
- N. C. Hait and A. Maiti, Mediators Inflammation, 2017, 2017, 1–17 CrossRef.
- J. I.-C. Sar, C.-J. Yang, Y.-S. Tsai, Y.-T. Deng, H.-M. Chen, H.-H. Chang and C.-M. Liu, J. Formosan Med. Assoc., 2015, 114, 860–864 CrossRef CAS.
- V. Ferchaud-Roucher, A. Kramer, E. Silva, P. Pantham, S. T. Weintraub, T. Jansson and T. L. Powell, Biochim. Biophys. Acta, Mol. Cell Biol. Lipids, 2019, 1864, 394–402 CrossRef CAS.
- L. M. Fox, D. G. Cox, J. L. Lockridge, X. Wang, X. Chen, L. Scharf, D. L. Trott, R. M. Ndonye, N. Veerapen, G. S. Besra, A. R. Howell, M. E. Cook, E. J. Adams, W. H. Hildebrand and J. E. Gumperz, PLoS Biol., 2009, 7, e1000228 CrossRef.
- X. Wu, H. Cao, L. Zhao, J. Song, Y. She and Y. Feng, J. Chromatogr. B, 2016, 1028, 199–215 CrossRef CAS.
- Y. Yu, X. Guan, L. Nie, Y. Liu, T. He, J. Xiong, X. Xu, Y. Li, K. Yang, Y. Wang, Y. Huang, B. Feng, J. Zhang and J. Zhao, J. Mol. Med., 2017, 95, 601–613 CrossRef CAS.
- T. Edamatsu, A. Fujieda and Y. Itoh, PLoS One, 2018, 13, e0193342 CrossRef.
- M. Praschberger, M. Hermann, J. Wanner, L. Jirovetz, M. Exner, S. Kapiotis, B. M. K. Gmeiner and H. Laggner, Free Radical Res., 2014, 48, 641–648 CrossRef CAS.
- M. D. Neher, S. Weckbach, M. S. Huber-Lang and P. F. Stahel, PPAR Res., 2012, 2012, 1–13 CrossRef.
- E. El Agha, A. Moiseenko, V. Kheirollahi, S. De Langhe, S. Crnkovic, G. Kwapiszewska, M. Szibor, D. Kosanovic, F. Schwind, R. T. Schermuly, I. Henneke, B. MacKenzie, J. Quantius, S. Herold, A. Ntokou, K. Ahlbrecht, T. Braun, R. E. Morty, A. Günther, W. Seeger and S. Bellusci, Cell Stem Cell, 2017, 20, 261–273.e3 CrossRef CAS.
- I. M. Medeiros-de-Moraes, C. F. Gonçalves-de-Albuquerque, A. R. M. Kurz, F. M. de J. Oliveira, V. H. P. de Abreu, R. C. Torres, V. F. Carvalho, V. Estato, P. T. Bozza, M. Sperandio, H. C. de Castro-Faria-Neto and A. R. Silva, Oxid. Med. Cell. Longevity, 2018, 2018, 1–13 CrossRef.
- P. Sieber, A. Schäfer, R. Lieberherr, F. Le Goff, M. Stritt, R. W. D. Welford, J. Gatfield, O. Peter, O. Nayler and U. Lüthi, PLoS One, 2018, 13, e0207872 CrossRef.
- D. J. Lanska, Ann. Nutr. Metab., 2012, 61, 246–253 CrossRef CAS.
- D. W. Taylor, Nature, 1959, 183, 257 CrossRef CAS.
- D. Kobayashi, M. Kusama, M. Onda and N. Nakahata, J. Pharmacol. Sci., 2011, 115, 230–234 CrossRef CAS.
- B. Wang, X. Zhang, B. Yue, W. Ge, M. Zhang, C. Ma and M. Kong, Animal Nutrition, 2016, 2, 312–317 CrossRef.
| This journal is © The Royal Society of Chemistry 2020 |

