
 Open Access Article
 This Open Access Article is licensed under a
 Creative Commons Attribution 3.0 Unported Licence
The influence of lateral flake size in graphene/graphite paste electrodes: an electroanalytical investigation†
Alejandro
García-Miranda Ferrari
 a,
Hadil M.
Elbardisy
ab,
Valentine
Silva
a,
Tarek S.
Belal
c,
Wael
Talaat
b,
Hoda G.
Daabees
d,
Craig E.
Banks
a and
Dale A. C.
Brownson
*a
a,
Hadil M.
Elbardisy
ab,
Valentine
Silva
a,
Tarek S.
Belal
c,
Wael
Talaat
b,
Hoda G.
Daabees
d,
Craig E.
Banks
a and
Dale A. C.
Brownson
*a
aFaculty of Science and Engineering, Manchester Metropolitan University, Chester Street, Manchester M1 5GD, UK. E-mail: d.brownson@mmu.ac.uk; Tel: +44 1612476561
bPharmaceutical Analysis Department, Faculty of Pharmacy, Damanhour University, Damanhour, 22511, Egypt
cDepartment of Pharmaceutical Analytical Chemistry, Faculty of Pharmacy, Alexandria University, Alexandria, 21521, Egypt
dPharmaceutical Chemistry Department, Faculty of Pharmacy, Damanhour University, Damanhour, 22511, Egypt
First published on 3rd April 2020
Abstract
We report the electroanalytical properties of graphene and graphite paste electrodes comprising varying lateral flake sizes. The fabricated electrodes are first electrochemically validated using a standard redox probe prior to the influence of their heterogeneous electron transfer (HET) kinetics/flake sizes being explored towards sensing applications. Electrochemical analysis is employed using a range of relevant biomolecules and prominent drugs of abuse. It is inferred that smaller lateral flake sizes result in an increased number of edge plane sites ‘available’ upon the electrode surface, leading to greater sensitivity and Limit of Detection (LOD) values. Calibration plots show an improvement in LODs from 0.7 to 0.19 μM and sensitivity from 0.023 to 0.038 A M−1 for the detection of ascorbic acid and LODs from 3.43 to 1.3 μM and sensitivities from 0.009 to 0.025 A M−1 for the detection of β-nicotinamide adenine dinucleotide (NADH) when comparing ‘typical’ (12.2 μm) and ‘small’ (0.5 μm) lateral flake sizes. In the case of uric acid, the reported sensitivity and LOD with typical sizes is 0.046 A M−1 and 1.42 μM, in comparison to 0.168 A M−1 and 0.85 μM with smaller flakes, with dopamine also supporting these findings. In terms of the drugs of abuse considered, methamphetamine exhibits an improved LOD from 0.82 to 0.65 μg mL−1 and sensitivity from 0.15 to 0.25 A μg mL−1 when comparing typical and small flakes respectively. However, cocaine and 3,4-methylenedioxymethamphetamine (MDMA) exhibit variable results, likely due to complex oxidation mechanisms and each paste electrode's specific heterogeneous surface nature. This work demonstrates the sensing capabilities of graphene and graphite paste electrodes comprising varying lateral flake sizes. It is inferred that smaller lateral flake sizes give rise to improved electroanalytical responses and enhanced graphitic based electrochemical sensors; which is important to consider when designing and optimising carbon based electrochemical sensor devices and likely has wider implications in the energy sector when utilising such electrodes.
Introduction
Carbon nanomaterials such as nano-graphite, carbon black, carbon nanotubes (CNTs), graphene and graphene oxide1–10 have long been utilised as electrode materials within electrochemistry, outperforming traditional noble metals11–13 and even the conventional carbon materials based on graphite or glassy carbon in recent years.14–17 This global interest is due to the unique enhanced/beneficial properties of the 2D materials over traditional electrochemical materials, such as having higher surface areas, high mechanical strength, wide potential windows, good thermal and electrocatalytic activities to name a few; giving benefits in a plethora of electrochemical applications. Graphene electrochemical sensors, due to their high surface area to volume ratio in a layered material,18 have been reported towards the detection of biologically relevant molecules such as dopamine,19 glucose,20 hydrazine,21 nitric oxide,22 β-nicotinamide adenine dinucleotide (NADH),23 uric acid,24 epinephrine24 and acetaminophen,25 allowing the improvement of detection limits.25,26Over the last decade, drugs of abuse (including morphine, fentanyl, cannabinoids, etc.) have given rise to a critical issue that threatens the health and safety of societies on a global scale and which continues to provide serious challenges for public health officials and police agencies.27 There is a need for the development of quick, accurate, simple and cost effective sensors for the detection and quantification of such abused drugs. Current methods utilised for the determination of cocaine and amphetamines include powerful but complex equipment and require experienced experimentalists; such as, chromatography-tandem mass spectrometry (LC-MS and GC-MS),28–31 spectrofluorimetry32 and nuclear magnetic resonance spectroscopy (NMR).33 Although these analytical techniques are sensitive, reliable and precise, they do however require expensive instrumentation, are labour intensive (extensive sample preparation) and thus are not available in all laboratories for routine analysis.34,35 Consequently, low cost and portable electrochemical platforms can be easily integrated into in-the-field hand-held devices to be used by health/law enforcement offering high sensitivity, good selectivity, significantly faster analysis and reasonable prices.36,37 An example of this is the application of graphitic screen-printed electrodes towards the detection of drugs of abuse such as heroin, fentanyl and mephedrone metabolites.36–39
In terms of understanding the electrochemical properties of carbon-based electrodes, carbon paste electrodes (CPEs) are an easy, well-known, fast and low cost solution to prototype and benchmark different carbonaceous materials.40 CPEs are mixtures prepared from graphitic powders with various non-electrolytic binders, packed into an inert holder with an electrical connection at the back.41,42 Suitable graphitic materials should follow these criteria: micrometric and uniform particle size, high chemical purity and low adsorption capabilities.43 It is important to note that a lack of observable differences in the electrochemical capabilities between graphene and graphite paste electrodes has been previously reported when comparing similar lateral flake sizes; due to the presence of multiple layers of graphene effectively becoming graphite.44 In terms of the electrochemical properties of carbon materials, it should be noted that there is a reported distinction between basal and edge planes in graphitic materials,45 where basal planes are considered almost “electrochemically inert”,46–49 and edge plane like-sites/defects are considered to have “anomalously fast” heterogeneous electron transfer (HET) kinetics.46,49–53 Regarding the electrochemical capabilities of edge plane like-sites/defects in graphitic materials, recent work involving the HET kinetics of graphitic paste electrodes has shown a trend demonstrating that as lateral flake size (La) decreases, the edge plane to basal plane ratio shifts, increasing the electrochemical activity of such electrodes.54 However, there is an ongoing debate regarding the true contributions of edge and basal plane like-sites/defects at the macroscopic scale49,55–60 with respect to their observed HET kinetics. Recent work by Slate et al. suggests the presence of a lateral size threshold of around 2 μm, below which the improvement of HET is negligible due to the proximity to the reversibility limit of the electrochemical process.54
Given the above insights, in this manuscript we report the electrochemical performance of a range of graphene and graphite paste electrodes. We vary the lateral flake sizes towards the detection of several relevant biological molecules and drugs of abuse. In addition, to achieve the next level of improved sensors, insights concerning optimising and selecting the best graphitic materials as a beneficial working electrode for improved detection devices are offered. Given that the differences between graphene and graphite capabilities do not alter the electrochemical performance of paste electrodes, and in order to elucidate the presence (or not) of the La threshold, flake size is the only variable factor under investigation. Therefore, we focus on graphite and graphene powders with lateral flake sizes from 0.5 μm to 12.2 μm in order to establish a correlation between La, their HET kinetics, and their sensitivity and LODs to detect and benchmark relevant biomolecules and drugs of abuse.
Results and discussion
It is important to first characterise and benchmark our electrochemical systems (graphene nano-powders (AO1, AO2, AO3, AO4 and C1) and graphite (high crystalline natural graphite (HCNG) and nanostructured graphite-250 (G250)) paste electrodes: see Experimental section for full details) to correlate the performance with reported literature, ensuring reliability/accuracy/repeatability. Herein, the electrochemical systems were benchmarked against the near-ideal outer sphere redox probe hexaammineruthenium(III) chloride (RuHex) in order to calculate the Heterogeneous Electron Transfer (HET) rate constant (k0), real electroactive area (Areal) and %RealArea (percentage comparison from Areal to geometrical area) for the range of graphitic-paste electrodes. These values are calculated as described in the Experimental section and are shown in Table 1 (see voltammetry in Fig. 1).| L a/μm (N = 20)54 | Oxygen avg.54/% | Avg. k0/cm s−1 | ΔEp/V (at 15 mV s−1) | Avg. Areal/cm2 | %Realarea | ||
|---|---|---|---|---|---|---|---|
| Graphite | HCNG | 12.2 (±0.7) | 2.88 | 1.15 × 10⁻³ (±2.62 × 10⁻⁴) | 0.063 | 0.195 | 122.5 (±2.4) |
| Graphene | AO1 | 9.4 (±0.7) | 4.56 | 1.20 × 10⁻³ (±2.39 × 10⁻⁴) | 0.087 | 0.120 | 75.6 (±13.6) |
| AO3 | 5.0 (±0.3) | 4.27 | 1.12 × 10⁻³ (±2.19 × 10⁻⁴) | 0.059 | 0.219 | 138.0 (±9.8) | |
| AO4 | 4.0 (±0.3) | 3.18 | 1.23 × 10⁻³ (±3.40 × 10⁻⁴) | 0.061 | 0.214 | 134.7 (±8.1) | |
| AO2 | 2.3 (±0.5) | 3.01 | 1.22 × 10⁻³ (±2.23 × 10⁻⁴) | 0.061 | 0.203 | 127.8 (±11.0) | |
| C1 | 1.3 (±0.1) | 3.03 | 1.21 × 10⁻³ (±3.31 × 10⁻⁴) | 0.068 | 0.207 | 132.2 (±15.9) | |
| Graphite | G250 | 0.5 (±0.1) | 3.56 | 1.21 × 10⁻³ (±3.16 × 10⁻⁴) | 0.059 | 0.192 | 120.8 (±2.3) |
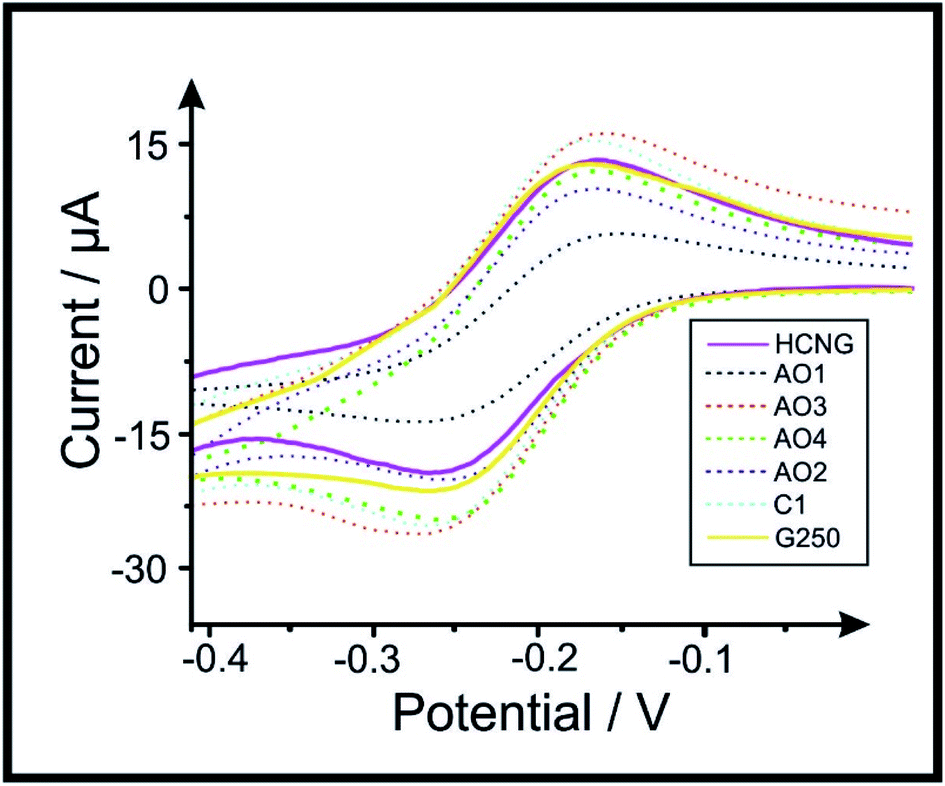 | ||
| Fig. 1 Voltammetric profiles of 1 mM RuHex in 0.1 M KCl using the range of graphite and graphene paste electrodes. Scan rate: 15 mV s−1 (vs. Ag/AgCl). Solid lines represent the largest (HCNG) and the smallest (G250) flakes used, dotted lines represent the intermediate flake sizes (AO1, AO3, AO4, AO2 and C1 respectively). | ||
Table 1 shows the average lateral flake size, percentage of oxygen (determined via Scanning Electron Microscopy (SEM) coupled with Energy Dispersive X-ray (EDX) analysis), average HET kinetics (k0), peak-to-peak (ΔEp) separation, electroactive area (Areal) and the percentage difference between Areal and geometrical area (i.e. %RealArea) for each of the electrode materials. SEM images and Raman profiles from the ‘batch characterisation’ of the graphitic powders utilised in this work (previously reported in ref. 54) are included in the ESI; in Fig. S4 and S5† respectively. ΔEp values for RuHex, which is known to be independent of surface oxygenated species and therefore only related to the electronic density of states,61 indicate a trend in which the use of smaller lateral flake sizes correlates to a decrease in the observed peak-to-peak separation, ΔEp. This indicates that the electrochemical process becomes more reversible when the lateral flake size is decreased, and therefore, the HET (k0) properties improve too (see Table 1). This is likely due to the edge-to-basal plane ratio changing as a dependence on the lateral flake size, where the amount of available edge sites increases when the lateral flake size decreases (and the ‘un-reactive’46 basal plane site contribution decreases in comparison to at larger flake sizes; see Raman spectroscopy and SEM characterisation that is included in the ESI† for further details). Resultantly, it was electrochemically estimated that graphite HCNG, with the largest lateral flake size (La) studied here (12.2 μm), exhibited a ΔEp of 68.36 mV (at 15 mV s−1) and has an average HET value of 1.15 × 10⁻³ (± 2.62 × 10⁻⁴ cm s−1). This is in clear contrast to the graphite G250 (La of 0.5 μm), which is the smallest flake size used and exhibited a ΔEp of 59 mV (at 15 mV s−1) and an average HET value of 1.21 × 10⁻³ (± 3.16 × 10⁻⁴ cm s−1). The values/trend corresponds well with that previously reported,54 confirming that our system is working and we can now explore the implication of this towards relevant electrochemical sensing applications. Note that, as shown in Fig. S5,† the Raman profiles of AO1 and G250 samples depict a larger D band (ca. 1335 cm−1), which is usually related to edge plane like-sites/defects,60 where more defects/edges relate to the higher electrochemical reactivity and therefore this is likely to influence the voltammetric behaviour of these materials.
Attention was next turned now to estimating the Areal of the range of different paste electrodes using the Randles–Ševćik equation62,63 (see Experimental section, eqn (3)). The Areal of the graphene and graphite electrodes is included in Table 1, with results that vary from 0.120 cm2 for graphene AO1 (9.4 μm) to a range of between 0.19–0.22 cm2 for the rest of the electrode materials. Overall, the above results indicate that as the reversibility of the electrochemical reaction increases (and therefore its HET kinetics), the La of the graphitic material comprising the electrode decreases. An increase in the ΔEp separation is observed when larger La are used, representing a lower k0 and therefore a less reversible process; however this does not appear to result in a clear trend relating to the Areal/%RealArea.
We now turn to exploring the electrochemical performance of these graphitic paste electrodes towards the electrochemical detection of relevant biological analytes and drugs of abuse, such as dopamine (DA), uric acid (UA), ascorbic acid (AA), β-nicotinamide adenine dinucleotide (NADH) and methamphetamine (MA) and will correlate the responses based upon the La. Cocaine (COC) and 3,4-methylenedioxymethamphetamine (MDMA) were also studied, however their results were inconsistent, likely due to the paste electrode's heterogeneous nature and specific porosity, and/or surface species etc. present (given the complex mechanisms followed for these probes) and as such these are reported only in the ESI†. The percentage Relative Standard Deviation (%RSD) for the electrochemical sensing platforms is included in Table S1 of the ESI.† Fig. S4† shows the SEM characterisation for the graphitic powders utilised herein, where one can compare the size, edge to basal plane ratio and porosity of the polished paste electrodes (and further information on this batch of characterisation has been previously reported in ref. 54 using the same materials; including additional transmission electron microscopy, TEM, analysis). Cyclic voltammograms (CVs) of DA, UA, AA, NADH and MA are reported in Fig. 2 and peak position for each CV and electrode material are depicted in Table 2 (Fig. S2† depicts CV for COC and MDMA; Table S2† show peak position values for COC and MDMA). In order to obtain a clear overview of the recorded data, we compare the over-potential for the analytical detection of the analytes (Eoxp) when using graphite HCNG (La of 9.4 μm), graphene AO4 (La of 4.0 μm) and graphite G250 (La of 0.5 μm) electrodes as representative sizes.
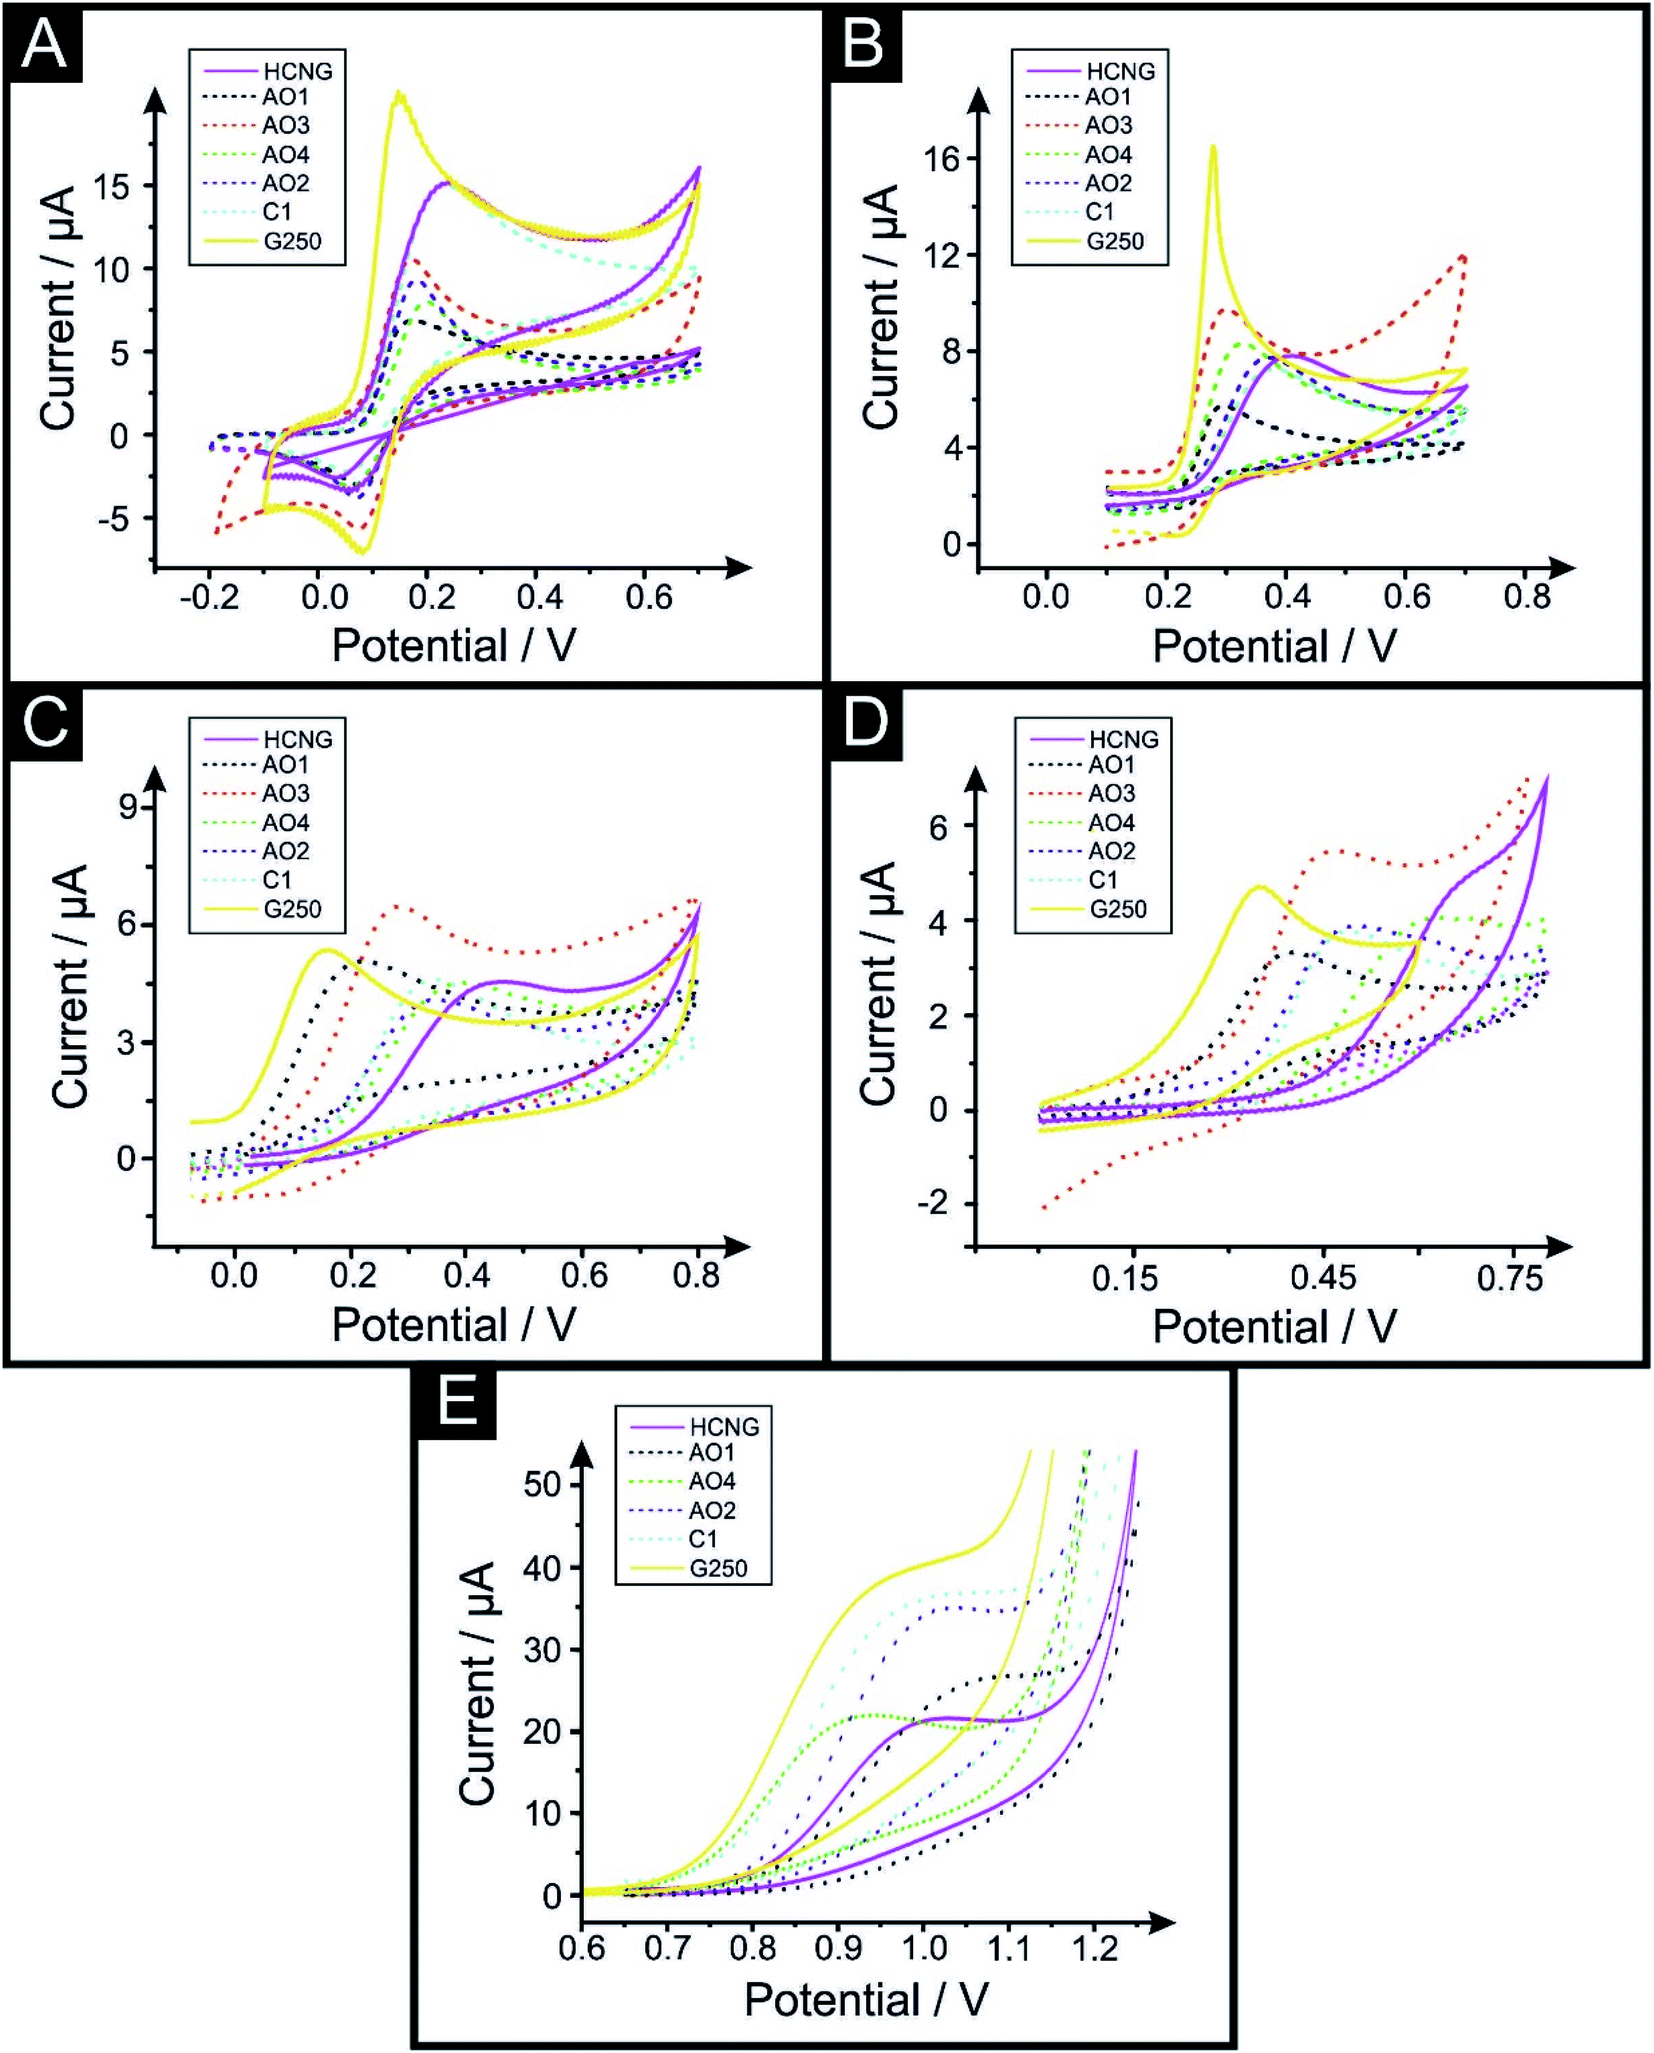 | ||
| Fig. 2 Voltammetric profiles of 100 μM dopamine (A), uric acid (B), ascorbic acid (C), NADH (D) in PBS pH 7.4 and 115 μg mL−1 and MA (E) in B–R pH 10 using the range of graphene (AO1, AO3, AO4, AO2 and C1) and graphite (HCNG and G250) paste electrodes. Scan rate 50 mV s−1 (vs. Ag/AgCl). MA data recorded using AO3 electrode has not been included due to a high capacitive background current that does not allow one to distinguish a redox peak. Solid lines represent the largest (HCNG) and the smallest (G250) lateral flake sizes used, dotted lines represent the intermediate flakes (AO1, AO3, AO4, AO2 and C1 respectively). | ||
| DA/V | UA/V | AA/V | NADH/V | MA/V | ||
|---|---|---|---|---|---|---|
| Graphite | HCNG | 0.220 | 0.442 | 0.447 | 0.664 | 1.016 |
| Graphene | AO1 | 0.162 | 0.296 | 0.195 | 0.397 | 0.980 |
| AO3 | 0.170 | 0.293 | 0.266 | 0.446 | 1.000 | |
| AO4 | 0.178 | 0.315 | 0.310 | 0.489 | 1.001 | |
| AO2 | 0.195 | 0.337 | 0.373 | 0.588 | 1.004 | |
| C1 | 0.219 | 0.359 | 0.359 | 0.495 | 1.032 | |
| Graphite | G250 | 0.147 | 0.283 | 0.163 | 0.354 | 1.015 |
DA is a well-known neurotransmitter that plays an important role in the hormonal, renal and central nervous systems.64 DA is reported to be affected by oxide species and needs adsorption onto the surface of the electrode to be oxidised.63Fig. 2A depicts typical CV responses of DA obtained using the range of graphitic electrodes described above and exhibits voltammetric peaks (Eoxp) decreasing from 0.220 V to 0.178 V and 0.147 V when using HCNG, AO4 and G250 respectively. The %RSD for the DA sensing platforms fluctuates from 4.4% to 10.2% for G250 and AO3 respectively.
UA, the primary end compound of purine metabolism, is a neurochemical commonly encountered in biological samples.65 Unusual levels of UA can indicate illnesses such as hyperuricaemia and gout.65Fig. 2B depicts typical CVs recorded for UA using the different graphitic paste electrodes, where similar to the above case, it exhibits Eoxp values decreasing from 0.442 V to 0.315 V and 0.283 V when using HCNG, AO4 and G250 respectively. The %RSD values for the UA sensors varies from 2.5% to 13.0% for AO4 and HCNG respectively.
AA, vitamin C, is an antioxidant and a co-substrate of many important dioxygenases and its high presence in urine can interfere with other target molecules such as DA or UA.19,66,67 AA is reported to be affected by oxide species on the surface of the electrode.63 As with the first two cases above, Fig. 2C depicts the CV responses recoded, exhibiting Eoxp shifts from 0.447 V to 0.310 V and 0.163 V when using HCNG, AO4 and G250 respectively. Lowest and highest %RSD values for the AA sensors are 3.5% and 9.2% for AO1 and AO2 respectively.
NADH is part of the NAD+/NADH redox reaction, which is used in many cellular processes, mainly NAD+ acts as a substrate of enzymes that add or remove chemical groups from proteins, making NAD+ metabolism a target for drug discovery.68 NADH is reported to be affected by oxide species and needs adsorption sites on the surface of the electrode to be oxidised.63Fig. 2D depicts the CV responses recoded, exhibiting Eoxp values ranging from 0.664 V to 0.489 V and 0.354 V when using HCNG, AO4 and G250 respectively. All of NADH's %RSD values are between 5.5% and 9.1% (for AO4 and HCNG respectively).
Last, we turn to MA, COC and MDMA detection as Fig. 2E, S2A and S2B† depict respectively. COC and amphetamines have been at the forefront of recreational drugs triggering crises (as stated by the World Drug Report 2018).69 MA plays a role in the redistribution of catecholamines in the mammalian body through the induction of reverse transport of transmitters through the plasma membrane uptake carriers.70 MA's %RSD values vary from 4.3% to 17.3% for AO4 and AO2 respectively. Fig. 2E depicts the typical MA CV response recorded using the different graphitic paste electrodes described above, exhibiting Eoxp between 1.016 V and 1.015 V when using HCNG and G250, indicating that the Eoxp for MA is not considerably affected by the flake size. Similarly, the Eoxp for COC and MDMA did not change significantly by varying the lateral flake size (see Table S2†).
Overall, it is clear that the use of smaller lateral flake sizes reduces the over-potential needed for the analytical detection of the biomolecules studied above; likely due to higher HET kinetics promoting improved charge transfer.54 However, this merit was not feasible in the case of the drugs of abuse that were studied herein.
Fig. 3 depicts the analytical studies resulting in calibration plots for DA, UA, AA, NADH and MA respectively, using the different graphitic pastes within a range of 5 to 100 μM in Phosphate Buffer Solution (PBS, pH 7.4) and from 9.9 to 115.04 μg mL−1 in 0.04 M Britton–Robinson (B–R, pH 10) buffer for MA. Fig. S3† shows the corresponding calibration plots for COC in 0.04 M B–R (pH 9) buffer and MDMA in PBS (pH 7.4) in the concentration ranges 11.86–72.36 and 5.96–72.36 μg mL−1 respectively. The sensitivity of such analytes is calculated from the slope of their respective calibration plots (in A M−1 and A μg−1 mL respectively). Table 3 shows the sensitivities of all analytes obtained from the slopes depicted in Fig. 3 (Table S3† shows sensitivity values for COC and MDMA).
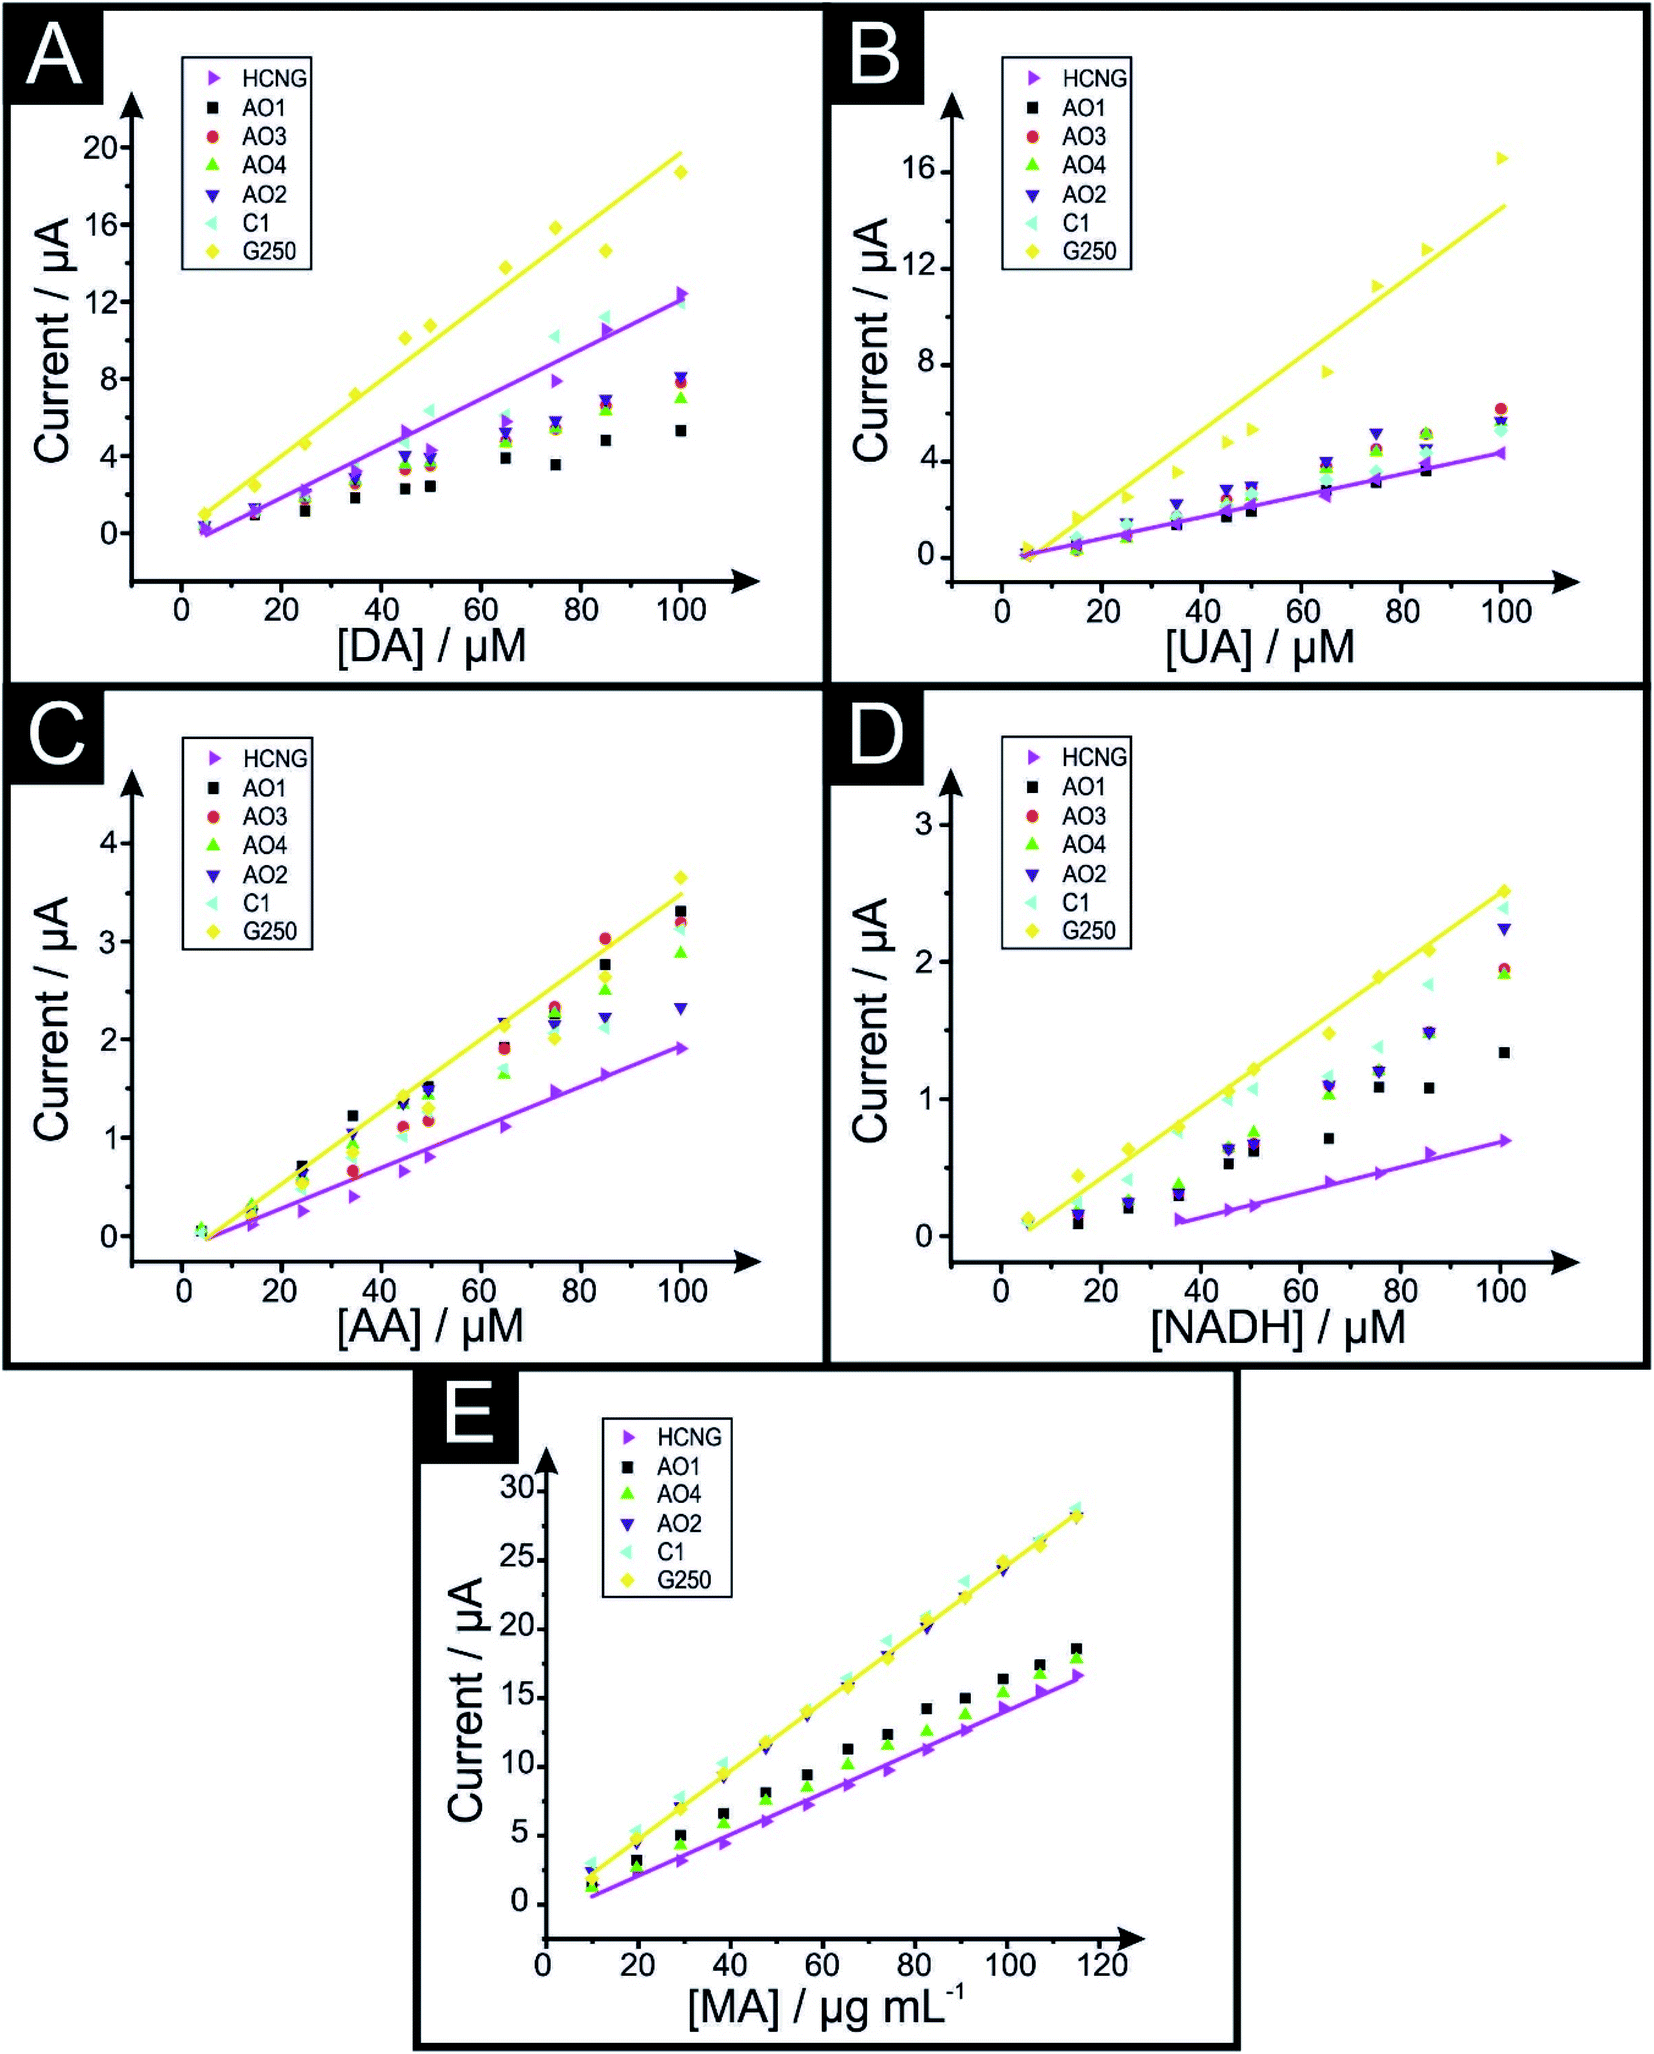 | ||
| Fig. 3 Calibration plots of dopamine (A), uric acid (B), ascorbic acid (C), NADH (D) in PBS pH 7.4 and MA (E) in B–R pH 10 using the graphene (AO1, AO3, AO4, AO2 and C1) and graphite (HCNG and G250) paste electrodes. Analytical sensitivities from these calibration plots are shown in Table 3. Scan rate 50 mV s−1 (vs. Ag/AgCl). Solid lines represent the largest (HCNG) and the smallest (G250) flakes used, dots represent the intermediate flake sizes (AO1, AO3, AO4, AO2 and C1 respectively). | ||
| DA/A M−1 | UA/A M−1 | AA/A M−1 | NADH/A M−1 | MA/A μg−1 mL | ||
|---|---|---|---|---|---|---|
| Graphite | HCNG | 0.126 | 0.046 | 0.023 | 0.009 | 0.150 |
| Graphene | AO1 | 0.054 | 0.044 | 0.034 | 0.015 | 0.163 |
| AO3 | 0.079 | 0.069 | 0.037 | 0.021 | 0.052 | |
| AO4 | 0.071 | 0.064 | 0.030 | 0.020 | 0.157 | |
| AO2 | 0.080 | 0.059 | 0.026 | 0.021 | 0.247 | |
| C1 | 0.133 | 0.049 | 0.031 | 0.023 | 0.246 | |
| Graphite | G250 | 0.190 | 0.168 | 0.038 | 0.025 | 0.249 |
The electrochemical sensitivity of DA increases from a value of 0.126 A M−1 to 0.190 A M−1 when using HCNG and G250 respectively. In the case of UA, its sensitivity increases from a value 0.046 A M−1, 0.064 A M−1 and 0.168 A M−1 for HCNG, AO4 and G250 electrodes respectively. The electrochemical sensitivity of AA shifts from 0.023 A M−1 to 0.030 A M−1 and 0.038 A M−1 for the electrodes comprising HCNG, AO4 and G250 respectively. Likewise, sensitivity studies for NADH go from 0.009 A M−1 to 0.020 A M−1 and to 0.025 A M−1 for the HCNG, AO4 and G250 electrodes. In the case of MA, electrochemical sensitivity varies from 0.150 A μg mL−1 to 0.157 and to 0.249 A μg mL−1 for the HCNG, AO4 and G250 electrodes respectively. For COC and MDMA, the results of the sensitivity study revealed an improvement between the smallest and the largest graphitic flakes; as the values ranged from 0.107 (HCNG) to 0.160 (G250) A μg mL−1 for COC and 0.108 to 0.124 A μg mL−1 for MDMA. However, AO4 demonstrated a reduced sensitivity in both analytes (AO4 sensitivity values for COC and MDMA were 0.043 and 0.099 A μg mL−1 respectively).
The above analysis indicates that, generally, an increase in the electroanalytical sensitivity is present when smaller lateral fake sizes are used within the graphene/graphite paste electrodes; compared to the responses obtained when using ‘relatively’ larger flakes.
The electrochemical Limit of Detections (LODs, 3σ) presented in Table 4 were obtained from the data depicted in Fig. 3. One can see from the data presented in Table 4 that for the majority of analytes there is a trend where the LOD improves with decreased values as the lateral flake size decreases (Table S4† shows the LOD values for COC and MDMA). As an example, in the case of the detection of UA, the calculated LOD decreases from 1.42 to 1.06 and 0.85 μM for the HCNG, AO4 and G250 electrodes respectively, indicating that using a smaller lateral flake size enables one to detect the target analyte at lower levels.
| DA/μM | UA/μM | AA/μM | NADH/μM | MA/μg mL−1 | ||
|---|---|---|---|---|---|---|
| Graphite | HCNG | 0.25 | 1.42 | 0.70 | 3.43 | 0.82 |
| Graphene | AO1 | 0.59 | 0.94 | 0.73 | 2.11 | 0.64 |
| AO3 | 0.41 | 0.85 | 0.46 | 1.50 | 66.48 | |
| AO4 | 0.45 | 1.06 | 0.50 | 1.57 | 0.45 | |
| AO2 | 0.40 | 1.24 | 0.54 | 1.49 | 0.65 | |
| C1 | 0.24 | 1.03 | 0.65 | 1.42 | 1.32 | |
| Graphite | G250 | 0.17 | 0.85 | 0.19 | 1.30 | 0.65 |
Considering the observations using a wide range of relevant biomolecules and the outer-sphere redox probe RuHex, it is clear that the nanostructured graphite G250, with the smallest lateral flake size (0.5 μm), offers the ‘best’ overall electrochemical performance in terms of HET kinetics towards detecting molecules where influences from oxygenated species or surface groups are not contributory factors on the performance. These results indicate that smaller lateral flake sizes (with improved HET kinetics) give rise to an improved electrochemical sensitivity and lower limits of detection in contrast to larger flake sizes.
Further to the above, it is important to note that one may observe ambiguous results that do not follow the strict trend reported herein for purely HET observations (or the degree to which a difference is measured/observed will vary somewhat). Depending on the electrochemical probe/analyte, the presence of oxygen or other chemical species on an electrode's surface could affect the performance (as previously reported in the literature for DA or AA respectively63 and for many more specific analytes with complex oxidation/reduction mechanisms). As indicated by Figueiredo-Filho et al.,44 similar percentage levels of oxygen present can be comprised of different oxygenated functional groups, which are likely to result in variations in the electrochemical response. It is also important to note that specific oxygenated species have been reported to give rise to larger capacitance values on graphitic structures (as was the case of graphene AO3 towards some of the probes studied herein, depending on the voltammetric region under investigation).71,72 Some of these electrochemical processes undergo complex adsorption routes that may have an unknown interaction with surface groups/carbonaceous debris on the working electrode, resulting in a perturbed electrochemical response, i.e. carbonaceous and nano-graphitic impurities have been reported to significantly interfere with the overall redox properties of some graphitic electrodes.73,74
This work shows the importance of considering lateral flake size when graphitic materials are considered for use as an electrode material within electroanalytical sensors; potentially leading to improved/enhanced electrochemical sensitivities and LODs at smaller lateral flake sizes. Given the results shown above, one should ideally implement a material with a higher edge plane density in order to obtain improved/optimum sensitivity and lower limits of detection LODs, however, depending on the target molecule, for specific biosensor applications one must also consider the fundamental properties and oxygen content of the graphitic material used.
Conclusions
We have shown that in the case of the analytes studied herein (namely; dopamine hydrochloride, uric acid, ascorbic acid, NADH and methamphetamine), the sensitivity of graphite and graphene based paste electrodes with varying lateral flake sizes depends directly on the structural composition. Decreasing the lateral flake sizes at graphitic paste electrodes results in enhanced electrochemical and analytical responses. We infer that the observed improvement is related to the “edge plane” content from the different lateral flake sizes. Although we have found that the HET properties improve with smaller flakes due to the contribution from the electronic structure (edge plane sites), the electrochemical response is also dependent on other influencing factors, such as porosity, surface species, O/C ratio, and so on. With the selection of analytes utilised herein ranging from ‘simple’ (dependent only on electronic properties (density of states)) through to ‘complex’ (which are dependent on surface oxygenated species), this has allowed the true electroanalytical properties of the graphitic paste electrodes to be fully explored. Clearly, in addition to careful consideration of the lateral flake size, future work should monitor the O/C ratio and how this can be improved to produce beneficial voltammetric signatures towards select electro-active analytes.Experimental section
All chemicals used were of analytical grade and were used as received from the supplier (Sigma-Aldrich, Irvine, UK) without any further purification. All solutions were prepared with deionised water of resistivity no less than 18.2 MΩ cm and were vigorously degassed prior to electrochemical measurements with high purity, oxygen free nitrogen in order to remove any trace of oxygen, which could affect the analyte's voltammetric current (analytical signal). Test solutions were: 1 mM RuHex (in 0.1 M KCl), dopamine, uric acid or ascorbic acid (in phosphate buffer solution (PBS) pH 7.4 separately in solution). Methamphetamine (MA) was prepared in 0.04 M Britton–Robinson buffer (pH 10);75 cocaine (COC) was prepared in 0.04 M Britton–Robinson buffer (pH 9) and acetonitrile (70![[thin space (1/6-em)]](https://www.rsc.org/images/entities/char_2009.gif) :30% v/v);76 and MDMA was prepared in 0.1 M phosphate buffer (pH 7.4). COC, MA and MDMA were synthesized under U.K. Home Office Drug Licence (No. 337201) as their corresponding hydrochloride salts at the Faculty of Science and Engineering, Manchester Metropolitan University (UK). The drug stock solutions were prepared at a concentration of 1 mg mL−1.
:30% v/v);76 and MDMA was prepared in 0.1 M phosphate buffer (pH 7.4). COC, MA and MDMA were synthesized under U.K. Home Office Drug Licence (No. 337201) as their corresponding hydrochloride salts at the Faculty of Science and Engineering, Manchester Metropolitan University (UK). The drug stock solutions were prepared at a concentration of 1 mg mL−1.
Electrochemical measurements were carried out using an Autolab PGSTAT204 potentiostat (Metrohm Autolab, Utrecht, The Netherlands). All measurements were conducted using a three-electrode system. Working paste electrodes were fabricated in-house using a piston-driven polymeric-composite electrode shell with an inner diameter of 4.5 mm (0.159 cm2 area) and graphite and graphene powders from Graphene Supermarket (Reading, MA, USA) as shown in Fig. S1.† The graphite powders are as follows: ‘High Crystalline Natural graphite (HCNG)’ and ‘Nanostructured graphite – 250 (G250)’ which comprised of an average La of 12.2 (±0.7) μm and 0.5 (±0.1) μm respectively. The graphene powders are as follows: ‘AO1’, ‘AO3’, ‘AO4’, ‘AO2’ and ‘C1’ which comprised of an average La of 9.4 (±0.7) μm, 5.0 (±0.3) μm, 4.0 (±0.3) μm, 2.3 (±0.5) μm and 1.3 (±0.1) μm respectively.54 Fig. S1† shows the fabrication process of graphite and graphene paste electrodes, resulting in using a mixture of 60% graphitic materials with 40% mineral oil (Nujol), and were used without any modification other than polishing the surface of the electrode. A platinum wire counter/auxiliary electrode and a silver/silver chloride electrode (Ag/AgCl) reference electrode completed the circuit. Raman spectroscopy was performed using a Raman Renishaw (Renishaw, UK) fitted with a 514.3 nm excitation laser at a low power of 0.8 mW to avoid any heating effects. Scanning electron microscope (SEM) images were obtained using a JSM-5600LV (JEOL, Japan) model SEM equipped with an energy-dispersive X-ray microanalysis (EDX) package.
The electron transfer rate constants, k0obs, were calculated as an average at 4 different scan rates (15, 50, 100 and 500 mV s−1) using the near ideal outer-sphere redox probe RuHex (in 0.1 M KCl) using the well-known63 and widely utilised Nicholson method,77 for quasi-reversible electrochemical reactions via the following formula:78
| φ = k0obs[πDnνF/RT]−1/2 | (1) |
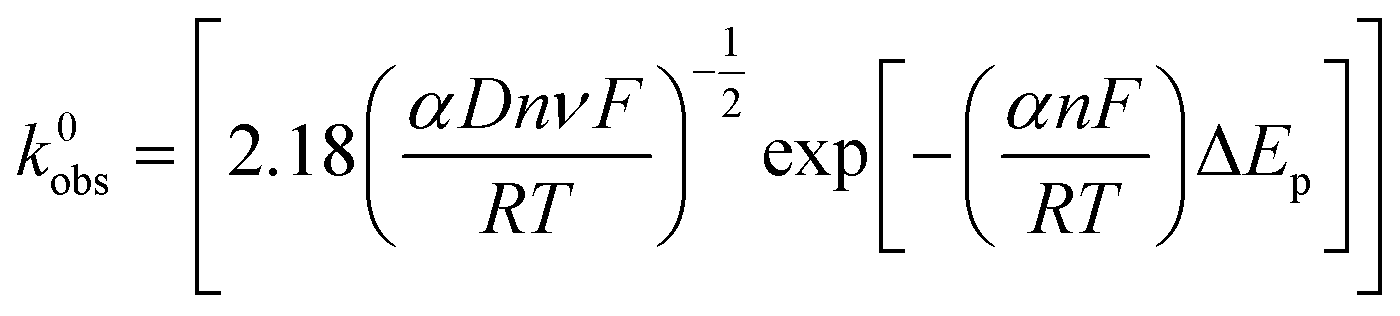 | (2) |
The electroactive area of the electrode, Areal, is calculated using the Randles–Ševćik equation at non-standard conditions for quasi-reversible electrochemical processes:62
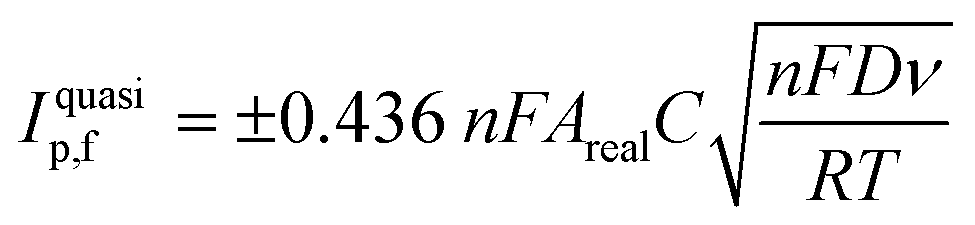 | (3) |
Limit of Detection (LOD) values were calculated as 3 times the standard deviation of the blank (3σ) divided by the gradient of the calibration plot (slope).
Conflicts of interest
There are no conflicts to declare.References
- T. Narayanan, P. Ajayan, S. Viswanathan, G. Manickam and V. Renugopalakrishnan, MRS Proceedings, 2015, 1725, mrsf14-1725-i08-05 CrossRef.
- P. Suvarnaphaet and S. Pechprasarn, Sensors, 2017, 17, 2161 CrossRef PubMed.
- Y. Chen, H. Liu, T. Ye, J. Kim and C. Mao, J. Am. Chem. Soc., 2007, 129, 8696–8697 CrossRef CAS PubMed.
- Z. Liu, X. Li, S. M. Tabakman, K. Jiang, S. Fan and H. Dai, J. Am. Chem. Soc., 2008, 130, 13540–13541 CrossRef CAS PubMed.
- A. K. Geim and I. V. Grigorieva, Nature, 2013, 499, 419–425 CrossRef CAS PubMed.
- M. Pumera, A. Ambrosi, A. Bonanni, E. L. K. Chng and H. L. Poh, TrAC, Trends Anal. Chem., 2010, 29, 954–965 CrossRef CAS.
- M. Liang and L. Zhi, J. Mater. Chem., 2009, 19, 5871–5878 RSC.
- W. Yang, K. R. Ratinac, S. P. Ringer, P. Thordarson, J. J. Gooding and F. Braet, Angew. Chem., Int. Ed., 2010, 49, 2114–2138 CrossRef CAS PubMed.
- Y. Shao, J. Wang, H. Wu, J. Liu, I. A. Aksay and Y. Lin, Electroanalysis, 2010, 22, 1027–1036 CrossRef CAS.
- D. Chen, L. Tang and J. Li, Chem. Soc. Rev., 2010, 39, 3157–3180 RSC.
- D. A. C. Brownson, D. K. Kampouris and C. E. Banks, J. Power Sources, 2011, 196, 4873–4885 CrossRef CAS.
- D. A. C. Brownson and C. E. Banks, Analyst, 2010, 135, 2768–2778 RSC.
- M. Pumera, Chem. Rec., 2009, 9, 211–223 CrossRef CAS PubMed.
- D. A. C. Brownson, P. J. Kelly and C. E. Banks, RSC Adv., 2015, 5, 37281–37286 RSC.
- K. Zeng and D. Zhang, Prog. Energy Combust. Sci., 2010, 36, 307–326 CrossRef CAS.
- W. M. Singh, T. Baine, S. Kudo, S. Tian, X. A. N. Ma, H. Zhou, N. J. DeYonker, T. C. Pham, J. C. Bollinger, D. L. Baker, B. Yan, C. E. Webster and X. Zhao, Angew. Chem., Int. Ed., 2012, 51, 5941–5944 CrossRef CAS PubMed.
- S. Srinivasan and F. J. Salzano, Int. J. Hydrogen Energy, 1977, 2, 53–59 CrossRef.
- M. J. Allen, V. C. Tung and R. B. Kaner, Chem. Rev., 2010, 110, 132–145 CrossRef CAS PubMed.
- Y. R. Kim, S. Bong, Y. J. Kang, Y. Yang, R. K. Mahajan, J. S. Kim and H. Kim, Biosens. Bioelectron., 2010, 25, 2366–2369 CrossRef CAS PubMed.
- X. Kang, J. Wang, H. Wu, I. A. Aksay, J. Liu and Y. Lin, Biosens. Bioelectron., 2009, 25, 901–905 CrossRef CAS PubMed.
- Y. Wang, Y. Wan and D. Zhang, Electrochem. Commun., 2010, 12, 187–190 CrossRef CAS.
- J.-F. Wu, M.-Q. Xu and G.-C. Zhao, Electrochem. Commun., 2010, 12, 175–177 CrossRef CAS.
- W.-J. Lin, C.-S. Liao, J.-H. Jhang and Y.-C. Tsai, Electrochem. Commun., 2009, 11, 2153–2156 CrossRef CAS.
- D. A. C. Brownson, M. Gomez-Mingot and C. E. Banks, Phys. Chem. Chem. Phys., 2011, 13, 20284–20288 RSC.
- X. Kang, J. Wang, H. Wu, J. Liu, I. A. Aksay and Y. Lin, Talanta, 2010, 81, 754–759 CrossRef CAS PubMed.
- D. Brownson and C. Banks, Analyst, 2010, 135, 2768–2778 RSC.
- J. P. Smith, O. B. Sutcliffe and C. E. Banks, Analyst, 2015, 140, 4932–4948 RSC.
- L. Ambach, E. Menzies, M. C. Parkin, A. Kicman, J. R. H. Archer, D. M. Wood, P. I. Dargan and C. Stove, Drug Test. Anal., 2019, 11, 709–720 CrossRef CAS PubMed.
- S. Chen, J. Ma, X. Wang and P. Geng, Acta Chromatogr., 2020, 32, 145–148 CrossRef.
- M. K. Woźniak, L. Banaszkiewicz, M. Wiergowski, E. Tomczak, M. Kata, B. Szpiech, J. Namieśnik and M. Biziuk, Forensic Toxicol., 2019 DOI:10.1007/s11419-019-00485-y.
- L. Fernandez-Lopez, A. Luna-Maldonado, M. Falcon, L. Mastrobattista, J. Navarro-Zaragoza and R. Mancini, J. Pharm. Biomed. Anal., 2019, 164, 636–641 CrossRef CAS PubMed.
- B. Xu, Y. Ye and L. Liao, Forensic Sciences Research, 2019, 4, 179–187 CrossRef PubMed.
- W. W. F. Rocha, J. d. A. Leite, R. M. Correia, F. Tosato, N. C. L. Madeira, P. R. Filgueiras, V. Lacerda, J. C. C. Freitas, W. Romão and Á. C. Neto, Anal. Methods, 2018, 10, 1685–1694 RSC.
- R. Martino, V. Gilard, F. Desmoulin and M. Malet-Martino, J. Pharm. Biomed. Anal., 2005, 38, 871–891 CrossRef CAS PubMed.
- M. V. Silva Elipe, Anal. Chim. Acta, 2003, 497, 1–25 CrossRef CAS.
- H. M. Elbardisy, A. García-Miranda Ferrari, C. W. Foster, O. B. Sutcliffe, D. A. C. Brownson, T. S. Belal, W. Talaat, H. G. Daabees and C. E. Banks, ACS Omega, 2019, 4, 1947–1954 CrossRef CAS.
- H. M. Elbardisy, C. W. Foster, L. Cumba, L. H. Antonides, N. Gilbert, C. J. Schofield, T. S. Belal, W. Talaat, O. B. Sutcliffe, H. G. Daabees and C. E. Banks, Anal. Methods, 2019, 11, 1053–1063 RSC.
- H. M. Elbardisy, C. W. Foster, J. Marron, R. E. Mewis, O. B. Sutcliffe, T. S. Belal, W. Talaat, H. G. Daabees and C. E. Banks, ACS Omega, 2019, 4(11), 14439–14450 CrossRef CAS PubMed.
- M. A. Mohamed, D. M. El-Gendy, N. Ahmed, C. E. Banks and N. K. Allam, Biosens. Bioelectron., 2018, 101, 90–95, DOI:10.1016/j.bios.2017.1010.1020.
- I. Švancara, K. Vytřas, K. Kalcher, A. Walcarius and J. Wang, Electroanalysis, 2009, 21, 7–28 CrossRef.
- B. Uslu and S. A. Ozkan, Anal. Lett., 2007, 40, 817–853 CrossRef CAS.
- I. Švancara, K. Vytřas, J. Barek and J. Zima, Crit. Rev. Anal. Chem., 2001, 31, 311–345 CrossRef.
- Š. Ivan, V. Karel, K. Kurt, W. Alain and W. Joseph, Electroanalysis, 2009, 21, 7–28 CrossRef.
- L. C. S. Figueiredo-Filho, D. A. C. Brownson, M. Gómez-Mingot, J. Iniesta, O. Fatibello-Filho and C. E. Banks, Analyst, 2013, 138, 6354–6364 RSC.
- R. L. McCreery, Chem. Rev., 2008, 108, 2646–2687 CrossRef CAS PubMed.
- W. Yuan, Y. Zhou, Y. Li, C. Li, H. Peng, J. Zhang, Z. Liu, L. Dai and G. Shi, Sci. Rep., 2013, 3, 2248 CrossRef PubMed.
- D. A. Brownson, S. A. Varey, F. Hussain, S. J. Haigh and C. E. Banks, Nanoscale, 2014, 6, 1607–1621 RSC.
- W. Li, C. Tan, M. A. Lowe, H. D. Abruña and D. C. Ralph, ACS Nano, 2011, 5, 2264–2270 CrossRef CAS PubMed.
- D. A. C. Brownson, D. K. Kampouris and C. E. Banks, Chem. Soc. Rev., 2012, 41, 6944–6976 RSC.
- D. A. C. Brownson, S. A. Varey, F. Hussain, S. J. Haigh and C. E. Banks, Nanoscale, 2014, 6, 1607–1621 RSC.
- M. E. Hyde, T. J. Davies and R. G. Compton, Angew. Chem., 2005, 44, 6491–6496 CrossRef CAS PubMed.
- R. E. G. Smith, T. J. Davies, N. d. B. Baynes and R. J. Nichols, J. Electroanal. Chem., 2015, 747, 29–38 CrossRef CAS.
- R. E. G. Smith, T. J. Davies, N. d. B. Baynes and R. J. Nichols, J. Electroanal. Chem., 2015, 747, 29–38 CrossRef CAS.
- A. J. Slate, D. A. C. Brownson, A. S. Abo Dena, G. C. Smith, K. A. Whitehead and C. E. Banks, Phys. Chem. Chem. Phys., 2018, 20, 20010–20022 RSC.
- S. J. Rowley-Neale and C. E. Banks, Encyclopedia of Interfacial Chemistry: Electrocatalytic Properties of Carbon Electrode Surfaces, 2018, pp. 531–538, ISBN: 9780128097397 Search PubMed.
- A. T. Valota, I. A. Kinloch, K. S. Novoselov, C. Casiraghi, A. Eckmann, E. W. Hill and R. A. W. Dryfe, ACS Nano, 2011, 5, 8809–8815 CrossRef CAS PubMed.
- M. A. Edwards, P. Bertoncello and P. R. Unwin, J. Phys. Chem. C, 2009, 113, 9218–9223 CrossRef CAS.
- D. A. C. Brownson, L. J. Munro, D. K. Kampouris and C. E. Banks, RSC Adv., 2011, 1, 978–988 RSC.
- D. Brownson and C. E. Banks, The Handbook of Graphene Electrochemistry, 2014 Search PubMed.
- A. Garcia-Miranda Ferrari, C. W. Foster, D. A. C. Brownson, K. A. Whitehead and C. E. Banks, Sci. Rep., 2019, 9, 12814 CrossRef PubMed.
- A. D. Clegg, N. V. Rees, O. V. Klymenko, B. A. Coles and R. G. Compton, J. Am. Chem. Soc., 2004, 126, 6185–6192 CrossRef CAS PubMed.
- A. Bard and L. Faulkner, Electrochemical Methods: Fundamentals and Applications, John Wiley & Sons, Inc, 2001 Search PubMed.
- A. García-Miranda Ferrari, C. W. Foster, P. Kelly, D. C. Brownson and C. E. Banks, Biosensors, 2018, 8(2), 53 CrossRef PubMed.
- Y. Wang, Y. Li, L. Tang, J. Lu and J. Li, Electrochem. Commun., 2009, 11, 889–892 CrossRef CAS.
- J. Du, R. Yue, Z. Yao, F. Jiang, Y. Du, P. Yang and C. Wang, Colloids Surf., A, 2013, 419, 94–99 CrossRef CAS.
- O. Arrigoni and M. C. De Tullio, Biochim. Biophys. Acta, Gen. Subj., 2002, 1569, 1–9 CrossRef CAS.
- G.-C. Yen, P.-D. Duh and H.-L. Tsai, Food Chem., 2002, 79, 307–313 CrossRef CAS.
- J. Zhu, X. Chen and W. Yang, Sens. Actuators, B, 2010, 150, 564–568 CrossRef CAS.
- S. N. E. X. United Nations publication, World Drug Report 2018, June 2018, accessed August 2019.
- D. Sulzer, M. S. Sonders, N. W. Poulsen and A. Galli, Prog. Neurobiol., 2005, 75, 406–433 CrossRef CAS PubMed.
- W. Song, X. Ji, W. Deng, Q. Chen, C. Shen and C. E. Banks, Phys. Chem. Chem. Phys., 2013, 15, 4799–4803 RSC.
- W. Deng, X. Ji, M. Gómez-Mingot, F. Lu, Q. Chen and C. E. Banks, Chem. Commun., 2012, 48, 2770–2772 RSC.
- M. Pumera, A. Ambrosi and E. L. K. Chng, Chem. Sci., 2012, 3, 3347–3355 RSC.
- L. Wang, A. Ambrosi and M. Pumera, Anal. Chem., 2013, 85, 6195–6197 CrossRef CAS PubMed.
- Ľ. Švorc, M. Vojs, P. Michniak, M. Marton, M. Rievaj and D. Bustin, J. Electroanal. Chem., 2014, 717–718, 34–40 CrossRef.
- D. P. Rocha, R. M. Dornellas, E. Nossol, E. M. Richter, S. G. Silva, M. H. P. Santana and R. A. A. Munoz, Electroanalysis, 2017, 29, 2418–2422 CrossRef CAS.
- R. S. Nicholson, Anal. Chem., 1965, 37, 1351–1355 CrossRef CAS.
- S. J. Rowley-Neale, D. A. C. Brownson and C. E. Banks, Nanoscale, 2016, 8, 15241–15251 RSC.
- F. E. Galdino, C. W. Foster, J. A. Bonacin and C. E. Banks, Anal. Methods, 2015, 7, 1208–1214 RSC.
- C. W. Foster, M. P. Down, Y. Zhang, X. Ji, S. J. Rowley-Neale, G. C. Smith, P. J. Kelly and C. E. Banks, Sci. Rep., 2017, 7, 42233 CrossRef.
Footnote |
| † Electronic supplementary information (ESI) available. See DOI: 10.1039/d0ay00169d |
| This journal is © The Royal Society of Chemistry 2020 |