 Open Access Article
Creative Commons Attribution 3.0 Unported Licence
Potential of triacylglycerol profiles in latent fingerprints to reveal individual diet, exercise, or health information for forensic evidence†
Kelly C.
O'Neill
,
Paige
Hinners
and
Young Jin
Lee
 *
*
Iowa State University, Department of Chemistry, Ames, IA 50011, USA. E-mail: yjlee@iastate.edu
First published on 20th January 2020
Abstract
Triacylglycerols (TGs) are a primary component of human skin oils and are therefore a major constituent present in latent fingerprint residue. We hypothesize that differences in the TG profile of the latent fingerprint, such as the relative level of saturation of the fatty acyl chains, may link back to the overall health of the subject, specifically correlated to diabetes. A small scale proof-of-concept study was performed to test this hypothesis. The biggest differences observed were in the relative amounts of completely saturated TGs compared to TGs with one or more double bonds; however, hierarchical clustering could not differentiate diabetic and non-diabetic participants. The role of other factors such as diet and exercise was explored from subsets of the non-diabetic participants. Vegetarian participants had higher relative levels of saturated TGs compared to those without diet restrictions; however, people on a low carbohydrate or ketogenic diet were not distinguishable from the control population. In terms of exercise, male participants who were very active had lower levels of saturated TGs compared to males who did not exercise at all. In contrast, exercise did not have much of an effect on the TG profile of female participants. While the outcome of this study is only tentative due to the lack of statistical power, it suggests the potential of TG profiles to be linked to health information, diet and exercise.
Introduction
Fingerprints are one of the most common means of personal identification and have been used in the criminal justice system for more than a century. However, there are several limitations in the way latent fingerprints are currently analyzed. The biggest limitation with this workflow is that fingerprints are useful evidence only if a match for the obtained fingerprint is found in the database. If the fingerprint cannot be connected back to a specific individual, it is not useful for evidence. Recent research is looking to increase the evidentiary value of such fingerprints by obtaining additional information from the chemical profile of the fingerprint.1–4 Latent fingerprints consist of chemicals that are naturally present in sweat or those that are excreted through pores in the finger. These chemicals are known as endogenous compounds and include fatty acids, amino acids, and triacylglycerols (TGs). Fingermarks may also contain chemicals with which the finger has come into contact, often called exogenous compounds. These can include anything from consumer products to illicit drugs and explosives. Previous research efforts have studied endogenous compounds in latent fingerprints to determine traits that correspond to the donor.5 For example, amino acids are known to be useful for determining the sex of the subject6 and lipid profiles have been used to narrow down the age of the subject.7 Research has also shown that exogenous compounds in fingerprints can be used to connect an individual to a certain lifestyle or illicit activity.8–11Mass spectrometry imaging (MSI) provides the advantage of simultaneous collection of both chemical and spatial information, making it popular for the analysis of latent fingerprints because an image that could be used for a database search is generated while additional chemical information is being obtained. As a surface technique, MSI requires very little sample preparation. This is in contrast to gas chromatography (GC) and liquid chromatography (LC)-MS techniques, which both require lengthy extractions. Additionally, GC-MS and LC-MS often require the extraction of 3–5 fingerprints to get good signal for endogenous compounds,12 whereas MSI only requires one. Moreover, the imaging capability of MSI allows for the differentiation of fingerprint compounds from surface contaminations. Desorption electrospray ionization (DESI)13 and secondary ion mass spectrometry (SIMS)14 have both been utilized for imaging of latent fingerprints; however, matrix assisted laser desorption/ionization (MALDI) has become the most popular technique for this application because it is robust, versatile, and minimally destructive.1,15 Fingerprints have almost no apparent damage after MALDI-MSI analysis and could be used as evidence in court proceedings or for additional analysis. Furthermore, MALDI-MSI is useful for forensic analysis of latent fingerprints because it has proven to be compatible with current forensic development techniques, making integration into labs more likely.16,17
TGs are one of the most common classes of compounds found in latent fingerprints and consist of a glycerol backbone and three fatty acid chains of various lengths and double bonds. Attempts have been made to use TGs to distinguish particular traits such as sexes,18–20 races,21 ages,7 and diets;20 however, each case was found to be inconclusive, not statistically significant, or only tentative due to a relatively small sample size. As TGs are involved in many health conditions,22 we hypothesize the TG profiles in latent fingerprints could potentially identify health information of individuals, specifically how they relate to metabolic diseases such as diabetes. Previous research has shown free fatty acid composition, such as chain length and level of unsaturation, effect the release of insulin,23,24 suggesting a potential correlation between fatty acyl chains on TGs and diabetes. This could be useful in the forensic field because the ability to determine if an unknown suspect is diabetic would drastically narrow the suspect pool. In addition, this could also have potential applications in medical diagnostics. Analyzing a latent fingerprint is extremely non-invasive, making it a potentially very useful diagnostic tool. In this work, a small scale study is conducted to test the hypothesis that the TG profile in latent fingerprints is a feasible way to determine health information about an individual, specifically in relation to diabetes.
Methods
Sample collection and preparation
In order to determine the variability in the TG profile of an individual, a single donor gave a fingerprint at five different times over the course of several months. These fingerprints were prepared as described below and were run separately on the mass spectrometer, taking both individual and instrument variability into account.Volunteers were recruited among the students, staff, and faculty of Iowa State University for fingerprint donation. All methods involving the research on human subjects was approved by our institutional review board. Participants were asked to briefly rub a finger against their forehead before lightly placing it on a glass slide. Groomed fingerprints were used to ensure good TG signals from all participants. 79 total participants were recruited and they varied in sex, race, age, and lifestyle. There were 36 male and 43 female participants and 16 total who had previously been diagnosed with diabetes (no discrimination between type 1 and type 2 diabetes). Fingerprints were collected 4–8 at a time so they would all fit in the sample plate at the same time and were stored in a desiccator until analysis (desiccator storage time did not exceed four hours).
Once the fingerprints were collected, they were sprayed with a sodium acetate (Alfa Aesar, Ward Hill, MA) solution and sputter coated with a gold target (Ted Pella Inc. Redding, CA). The sodium acetate (10 mM in methanol) was applied using a TM Sprayer (HTX Technologies LLC, Chapel Hill, NC). The TM Sprayer method included 8 passes at 30 °C with a flow rate of 0.03 mL min−1 and a linear velocity of 1200 mm min−1. The gold sputter coating was done at 40 mA for 10 seconds (∼2.8 nm thickness)25 on a 108 Auto Sputter Coater (Ted Pella Inc. Redding, CA). The combination of spraying sodium acetate and sputter coating with gold was modified from a previously reported method.26
Instrumentation
Data was exclusively collected on a MALDI-linear ion trap (LIT)-Orbitrap mass spectrometer (MALDI-LTQ-Orbitrap Discovery; Thermo Finnigan, San Jose, CA). The mass spectrometer includes a modification to incorporate an external frequency tripled 355 nm Nd:YAG laser (UVFQ; Elforlight, Daventry, UK). Mass spectra were collected in positive ion mode using the Orbitrap mass analyzer from m/z 500–1000 with 10 laser shots per spectrum and a raster step of 100 microns. Data analysis was done using Xcaliber and ImageQuest (ThermoFisher Scientific).Hierarchical clustering
Mass spectra were averaged over the entire region of the fingerprint that was imaged. Hierarchical clustering was done using the online statistical software MetaboAnalyst.27 The data submitted to MetaboAnalyst was a list of the normalized TG signal for the 20 most abundant TGs observed in the latent fingerprints of each participant. The TGs were normalized to the most abundant TG in the spectrum.Results and discussion
Day-to-day variation in an individual
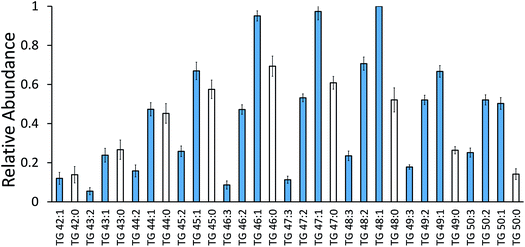
First, an experiment was performed to determine the variability for a single individual and the best method to minimize day-to-day variation. Previous research has shown that there is a fair amount of variability in the chemical profile of a fingerprint made by the same donor on different days.28 Weyermann et al. showed that cholesterol and squalene levels measured by GC-MS were different not only from day to day, but also in different measurements on the same day. Similarly, we experienced differences in the absolute signal of TG species in our experiment. ESI Fig. 1† shows variation in absolute signal of the most abundant TG over three separate 24 hour time periods. In order to account for some of this variability, TG species were normalized to the most abundant TG in each fingerprint. ESI Fig. 2† shows three normalized TG profiles that were extracted from these trials and look similar regardless of the time of day. The normalized ratios proved to be relatively consistent with relative errors of less than 10% for each TG. Fig. 1 shows the average TG profile for a single donor on five separate days (and at different times of day) over the course of several months. The standard deviations were also for the most part less than 10%, with a few exceptions for TGs with low absolute signal. Similar results were obtained regardless of individuals or instrument conditions. These results indicate that normalized TG profiles are a reliable way to compare between individuals. Thus, our subsequent study was focused on comparing relative TG patterns (i.e., fatty acyl chain length and unsaturation) depending on health information.Impact of diabetes on TG profile
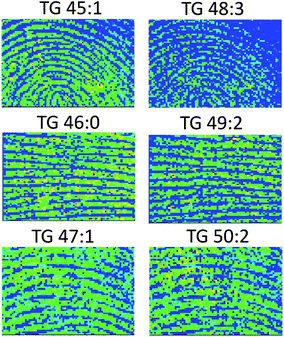
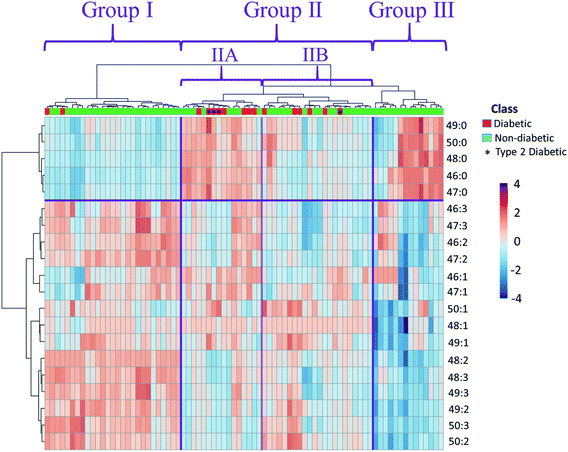
A small scale study was performed with the intent to determine if TG profiles could be used as a means to distinguish between diabetic and non-diabetic individuals. In this study, fingerprints were collected from 79 total individuals (36 males and 43 females). This number includes 16 people who have previously been diagnosed with diabetes and 63 healthy individuals. Six representative MS images of different TGs detected in the fingerprints of three participants are shown in Fig. 2. Each row has an odd and an even chain length TG from the same individual, both of which are localized to the fingerprint ridges. While the color (representing the signal intensity) may be slightly different between images, each TG is localized to the fingerprint ridges regardless of chain length or level of unsaturation. It has been well known that human sebaceous glands produce unusual surface lipids containing odd chain fatty acyl chains.29A visualization of the twenty most abundant TG profiles is made as a heat map in Fig. 3, with hierarchical clustering analysis using MetaboAnalyst (https://www.metaboanalyst.ca/). It clusters participants with similar TG profiles together in the same part of the heat map. The columns in the heat map represent each individual participant and the rows represent each specific TG species. The color of each square indicates the relative intensity of the given TG for each individual, with red meaning there is a higher relative intensity for that peak than blue.
The heat-map is broken up into three main clusters of participants. No particular TG species stands out more than the others; instead it seems the abundance of overall unsaturated TG species plays a key role in this clustering. Group I consists of individuals with overall high levels of unsaturated TG species. In contrast, Group III has mostly low levels of unsaturated TGs. Group II seems to have relatively good balance of high and low unsaturated TGs. As Group II is the largest, it can be split up into two subgroups: Group IIA and Group IIB. The best distinguishing feature between the two subgroups is that Group IIA has higher relative abundance of saturated TGs than Group IIB. Most diabetic participants (14 out of 16) are present in Group II. Within Group II, the diabetics are pretty evenly split between Groups IIA and IIB, although there are more type 2 diabetes participants (3 out of 4) in Group IIA. Overall, there is no clear distinction between diabetic participants and healthy individuals.
There is a fair amount of variation even among the healthy controls. Some healthy individuals were clustered in Group I with high unsaturated TGs and low saturated TGs, while some healthy individuals show the opposite trend in Group III. There are some general trends suggesting diabetes patients have more abundant saturated TGs, especially for type 2 diabetes (i.e., Group IIA); however, this effect is obscured by other factors in the current small scale study. For example, most of the participants in Group III with elevated saturated TGs were participants who do not exercise at all or rarely exercise. For a better understanding of other factors, the data set for healthy individuals was carefully examined to find any correlations between diet or exercise and relative TG saturation levels. The results are discussed in the following sections.
Impact of exercise on TG profile
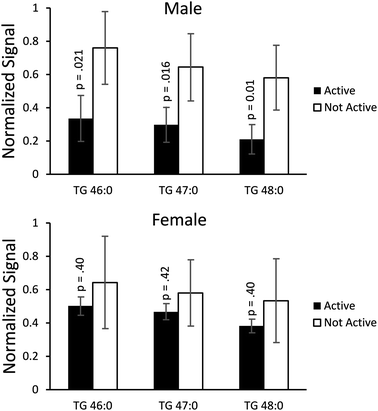
After noticing the similarities between the participants in Group III, the effect of exercise on TG profiles was explored. Out of 63 total healthy individuals from the previous section, fingerprint data from 8 male and 8 female participants were separated out for further data analysis. These individuals were chosen because their surveys indicated they had a very clear exercise routine (either they exercised regularly or not at all) while also having a similar diet. These 16 participants all had an average diet with three meals per day and no diet restrictions. The male participants include 4 that exercise every day and 4 that do not exercise, whereas the female participants include 5 that exercise on a regular basis, and 3 that do not exercise. The most apparent difference between the two groups is the highly abundant saturated fatty acyl chains (i.e., TG x:0) among the non-active males compared to the active males as shown in ESI Fig. 3† with two representative examples. Saturated TGs marked in red show almost three times greater relative ion signals for the non-active participant than that of the active participant. It should be noted that di-unsaturated TGs (i.e., TG x:2) are often more abundant than mono-unsaturated TGs (i.e., TG x:1) in the active participant, especially for TGs with long chain acyl groups such as TG 48:2 at m/z 825.69 and TG 49:2 at m/z 839.70.The result is summarized in Fig. 4 for the three most abundant saturated TGs normalized to the most abundant TG in the series with the same number of carbons. Other normalization strategies were also tested and similar results were achieved (data not shown). For most participants, the monounsaturated TG was the most abundant in the series (i.e., TG x:1), although some people had the doubly unsaturated or saturated TG as the most abundant. The three most abundant saturated TGs were chosen in an effort to achieve a ratio that best represents the individual. The error bars on these graphs are relatively large because they combine the TG profiles for different individuals. The results indicate that exercise has a larger effect on the TG profiles of males than females. The males who exercise daily have significantly lower levels of saturated TGs compared to non-active males (44%, 46%, and 36% of the relative abundance for non-active males for TG 46:0, TG 47:0, and TG 48:0, respectively), with p-values less than 0.05 or 0.01. Active females also have lower levels of saturated TGs compared to non-active females, but the difference is relatively minor (78%, 80%, and 72% for TG 46:0, TG 47:0, and TG 48:0, respectively) and not statistically significant (p > 0.3). TG 48:0 seems to have the biggest effect on both male and female participants with the active participants having relative abundances 36% and 72% of the non-active participants respectively. Overall, this data suggests that routine exercise results in lowering the saturated to unsaturated TG ratios on fingerprints, especially in males. Similar effects have been previously reported in literature for the effect of exercise on TGs in serum.30,31
Impact of diet on TG profile
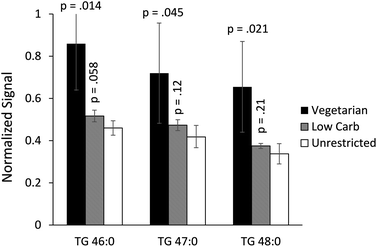
Next, the effect of diets on relative TG patterns was studied. TG profiles from twelve healthy participants were extracted from the original diabetes data set that have a clear diet pattern. This group of twelve includes 5 vegetarians, 3 people with low carbohydrate/ketogenic diets, and 4 people that reported no diet restrictions. Each of these participants had similar exercise routines, exercising regularly several times per week. This sub-set data for diet includes 4 males and 7 females, but there are no apparent differences between male and female participants that are a part of the same diet group. The three most abundant saturated TG species were compared and are shown in Fig. 5. There is no significant difference in the relative abundance of saturated TGs between the low carbohydrate and unrestricted diets (p values of 0.06–0.2). However, the vegetarians had significantly higher levels of saturated TGs on average than either of the other two diets (p < 0.05). Unlike the effect of exercise in the previous section, the relative differences in the three most abundant saturated TGs are similar between the vegetarian and control groups (1.9, 1.7, and 1.9 times higher in the vegetarian group than the control for TG 46:0, TG 47:0, and TG 48:0, respectively). This suggests that vegetarians could have higher levels of saturated TGs compared to people without any diet restrictions.Conclusions
The presented data from this small proof of concept experiment shows that the relative abundance of TGs in latent fingerprints may be impacted by lifestyle choices such as diet and exercise or health conditions such as diabetes. While the current small scale study was inconclusive in regards to diabetes, the elevated relative abundance of completely saturated TGs is partially correlated with diabetes, particularly for type 2 diabetic participants. This correlation is complicated by other factors, as the data from small subsets of healthy participants suggests. Male participants in particular had much lower levels of saturated TGs when they had an active lifestyle and exercised every day compared to inactive individuals. On the other hand, the TG profiles of female participants were not significantly impacted. Individuals with a vegetarian diet also had higher than average saturated TGs compared to people that had no restrictions to their diet. Despite the fact that the current finding is only tentative, this study leads to an important discovery that there might be a potential correlation between TG profiles and lifestyle or health status. To further study the effect of diabetes on TG profiles, a large scale study is currently being planned in the coming years with a much larger population of type 2 diabetics that carefully controls for diet and exercise. If this can be successfully accomplished, it could lead to significant applications not only in forensics, but also diagnostics as a quick and non-invasive procedure.Conflicts of interest
The authors declare no conflicts of interest. The research was conducted in the absence of any financial or commercial relationships that could possibly be construed as a conflict of interest.Acknowledgements
This work was funded by the National Institute of Justice [2016-DN-BX-0008].References
- S. Francese, R. Bradshaw, L. S. Ferguson, R. Wolstenholme, M. R. Clench and S. Bleay, Beyond the ridge pattern: multi-informative analysis of latent fingermarks by MALDI mass spectrometry, Analyst, 2013, 138(15), 4215–4228 RSC.
- L. Ferguson, R. Bradshaw, R. Wolstenholme, M. Clench and S. Francese, Two-Step Matrix Application for the Enhancement and Imaging of Latent Fingermarks, Anal. Chem., 2011, 83(14), 5585–5591 CrossRef CAS PubMed.
- G. B. Yagnik, A. R. Korte and Y. J. Lee, Multiplex mass spectrometry imaging for latent fingerprints, J. Mass Spectrom., 2013, 48(1), 100–104 CrossRef CAS PubMed.
- N. Lauzon, M. Dufresne, V. Chauhan and P. Chaurand, Development of Laser Desorption Imaging Mass Spectrometry Methods to Investigate the Molecular Composition of Latent Fingermarks, J. Am. Soc. Mass Spectrom., 2015, 26(6), 878–886 CrossRef CAS PubMed.
- Z. Zhou and R. N. Zare, Personal Information from Latent Fingerprints Using Desorption Electrospray Ionization Mass Spectrometry and Machine Learning, Anal. Chem., 2017, 89(2), 1369–1372 CrossRef CAS PubMed.
- C. Huynh, E. Brunelle, L. Halámková, J. Agudelo and J. Halámek, Forensic Identification of Gender from Fingerprints, Anal. Chem., 2015, 87(22), 11531–11536 CrossRef CAS PubMed.
- K. M. Antoine, S. Mortazavi, A. D. Miller and L. M. Miller, Chemical Differences Are Observed in Children's Versus Adults' Latent Fingerprints as a Function of Time, J. Forensic Sci., 2010, 55(2), 513–518 CrossRef CAS PubMed.
- M. J. Bailey, R. Bradshaw, S. Francese, T. L. Salter, C. Costa, M. Ismail, R. P. Webb, I. Bosman, K. Wolff and M. de Puit, Rapid detection of cocaine, benzoylecgonine and methylecgonine in fingerprints using surface mass spectrometry, Analyst, 2015, 140(18), 6254–6259 RSC.
- A. Banas, K. Banas, M. B. H. Breese, J. Loke and S. K. Lim, Spectroscopic detection of exogenous materials in latent fingerprints treated with powders and lifted off with adhesive tapes, Anal. Bioanal. Chem., 2014, 406(17), 4173–4181 CrossRef CAS PubMed.
- P. Hinners, K. C. O'Neill and Y. J. Lee, Revealing Individual Lifestyles through Mass Spectrometry Imaging of Chemical Compounds in Fingerprints, Sci. Rep., 2018, 8(1), 5149 CrossRef PubMed.
- N. Lauzon and P. Chaurand, Detection of exogenous substances in latent fingermarks by silver-assisted LDI imaging MS: perspectives in forensic sciences, Analyst, 2018, 143(15), 3586–3594 RSC.
- A. A. Frick and C. Weyermann, An untargeted lipidomic approach for qualitative determination of latent fingermark glycerides using UPLC-IMS-QToF-MSE, Analyst, 2019, 144(11), 3590–3600 RSC.
- D. R. Ifa, N. E. Manicke, A. L. Dill and R. G. Cooks, Latent Fingerprint Chemical Imaging by Mass Spectrometry, Science, 2008, 321(5890), 805 CrossRef CAS PubMed.
- S. Muramoto and E. Sisco, Strategies for Potential Age Dating of Fingerprints through the Diffusion of Sebum Molecules on a Nonporous Surface Analyzed Using Time-of-Flight Secondary Ion Mass Spectrometry, Anal. Chem., 2015, 87(16), 8035–8038 CrossRef CAS PubMed.
- R. Bradshaw, S. Bleay, R. Wolstenholme, M. R. Clench and S. Francese, Towards the integration of matrix assisted laser desorption ionisation mass spectrometry imaging into the current fingermark examination workflow, Forensic Sci. Int., 2013, 232(1–3), 111–124 CrossRef CAS PubMed.
- K. C. O'Neill, P. Hinners and Y. J. Lee, Chemical Imaging of Cyanoacrylate-Fumed Fingerprints by Matrix-assisted Laser Desorption/Ionization Mass Spectrometry Imaging, J. Forensic Sci., 2018, 63(6), 1854–1857 CrossRef PubMed.
- P. Hinners and Y. J. Lee, Carbon-Based Fingerprint Powder as a One-Step Development and Matrix Application for High-Resolution Mass Spectrometry Imaging of Latent Fingerprints, J. Forensic Sci., 2019, 64(4), 1048–1056 CrossRef CAS PubMed.
- B. Emerson, J. Gidden, J. O. Lay Jr and B. Durham, Laser Desorption/Ionization Time-of-Flight Mass Spectrometry of Triacylglycerols and Other Components in Fingermark Samples*, J. Forensic Sci., 2011, 56(2), 381–389 CrossRef CAS PubMed.
- K. Asano, C. Bayne, K. Horsman and M. Buchanan, Chemical Composition of Fingerprints for Gender Determination, J. Forensic Sci., 2002, 47(4), 805–807 CAS.
- R. S. Croxton, M. G. Baron, D. Butler, T. Kent and V. G. Sears, Variation in amino acid and lipid composition of latent fingerprints, Forensic Sci. Int., 2010, 199(1–3), 93–102 CrossRef CAS PubMed.
- S. Michalski, R. Shaler and F. L. Dorman, The Evaluation of Fatty Acid Ratios in Latent Fingermarks by Gas Chromatography/Mass Spectrometry (GC/MS) Analysis, J. Forensic Sci., 2013, 58(s1), S215–S220 CrossRef CAS PubMed.
- R. V. Farese and T. C. Walther, Lipid Droplets Finally Get a Little R-E-S-P-E-C-T, Cell, 2009, 139(5), 855–860 CrossRef CAS PubMed.
- E. C. Opara, M. Garfinkel, V. S. Hubbard, W. M. Burch and O. E. Akwari, Effect of fatty acids on insulin release: role of chain length and degree of unsaturation, Am. J. Physiol. Endocrinol. Metabol., 1994, 266(4), E635 CrossRef CAS PubMed.
- T. Plötz, M. Hartmann, S. Lenzen and M. Elsner, The role of lipid droplet formation in the protection of unsaturated fatty acids against palmitic acid induced lipotoxicity to rat insulin-producing cells, Nutr. Metabol., 2016, 13(1), 16 CrossRef PubMed.
- R. L. Hansen, M. E. Dueñas and Y. J. Lee, Sputter-Coated Metal Screening for Small Molecule Analysis and High-Spatial Resolution Imaging in Laser Desorption Ionization Mass Spectrometry, J. Am. Soc. Mass Spectrom., 2019, 30(2), 299–308 CrossRef CAS PubMed.
- M. Dufresne, J.-F. Masson and P. Chaurand, Sodium-Doped Gold-Assisted Laser Desorption Ionization for Enhanced Imaging Mass Spectrometry of Triacylglycerols from Thin Tissue Sections, Anal. Chem., 2016, 88(11), 6018–6025 CrossRef CAS PubMed.
- J. Chong, M. Yamamoto and J. Xia, MetaboAnalystR 2.0: From Raw Spectra to Biological Insights, Metabolites, 2019, 9(3), 57 CrossRef CAS PubMed.
- C. Weyermann, C. Roux and C. Champod, Initial Results on the Composition of Fingerprints and its Evolution as a Function of Time by GC/MS Analysis, J. Forensic Sci., 2011, 56(1), 102–108 CrossRef CAS PubMed.
- N. Nicolaides, Skin Lipids: Their Biochemical Uniqueness, Science, 1974, 186(4158), 19 CrossRef CAS PubMed.
- N. Kokalas, A. Petridou, M. G. Nikolaidis and V. Mougios, Effect of aerobic exercise on lipaemia and its fatty acid profile after a meal of moderate fat content in eumenorrhoeic women, Br. J. Nutr., 2005, 94(5), 698–704 CrossRef CAS PubMed.
- V. Mougios, C. Kotzamanidis, C. Koutsari and S. Atsopardis, Exercise-induced changes in the concentration of individual fatty acids and triacylglycerols of human plasma, Metabolism, 1995, 44(5), 681–688 CrossRef CAS.
Footnote |
| † Electronic supplementary information (ESI) available. See DOI: 10.1039/c9ay02652e |
| This journal is © The Royal Society of Chemistry 2020 |

