
 Open Access Article
 This Open Access Article is licensed under a Creative Commons Attribution-Non Commercial 3.0 Unported Licence
Ultra-trace determination of domoic acid in the Ebro Delta estuary by SPE-HILIC-HRMS†
Cristina
Bosch-Orea
 a,
Josep
Sanchís
bc,
Damiá
Barceló
ab and
Marinella
Farré
*a
a,
Josep
Sanchís
bc,
Damiá
Barceló
ab and
Marinella
Farré
*a
aWater and Soil Quality Research Group, Department of Environmental Chemistry, IDAEA-CSIC, Barcelona, Spain. E-mail: mfuqam@cid.csic.es
bCatalan Institute for Water Research (ICRA), Scientific and Technological Park of the University of Girona, H2O Building, C/Emili Grahit, 101, E17003, Girona, Spain
cUniversity of Girona, 17071, Girona, Spain
First published on 28th February 2020
Abstract
Marine phytoplankton, such as diatoms, are responsible for a considerable part of carbon fixation and form the basis of the marine food web. However, different factors, such as eutrophication, can affect their population growth and induce the production of toxins. During the last few years, the presence of domoic acid (DA) has increased worldwide in coastal areas. Its toxic properties and capacity to bioaccumulate through the food chain have reinforced the need for developing monitoring strategies to ensure the safety and quality of marine resources. In this work, a highly sensitive analytical method has been developed to be used as an early detection and quantification tool for DA in seawater. The method is based on a sample pre-treatment step by solid-phase extraction (SPE) and an instrumental analysis by hydrophilic interaction liquid chromatography coupled with high-resolution mass spectrometry (HILIC-HRMS). The method has been validated, showing good results in terms of sensitivity and repeatability. Limits of detection and quantification were 0.25 and 0.75 ng L−1 respectively, and acceptable recovery was in the range of 48–69%. Then, the method was applied to study a real scenario in the Ebro Delta where mariculture activities are relevant for the economy of the area. A total of 34 samples were collected in different campaigns during three seasons covering the two main delta bays (Alfacs and Fangar) and four lagoons (La Tancada, Illa de Buda, l'Encanyissada and Canal Vell). 65% of the samples had concentrations of DA at the ng L−1 level, ranging from 0.90 to 69.6 ng L−1. The highest levels were found in samples from Alfacs bay and the summer campaign. In the case of the lagoons, DA was detected only in La Tancada at 8.78 ng L−1 in the winter campaign. This study proves the prevalence of DA in highly eutrophic areas, during all seasons, often at trace level concentrations.
1. Introduction
The frequency of harmful algal blooms (HABs) has globally increased due to water eutrophication and global warming. This results in negative consequences for ecosystems because of the release of toxins by such harmful algae. Domoic acid (DA) is a potent neurotoxin produced by diatoms of the genus Pseudo-nitzschia (present in all coastal areas). DA has bioaccumulation capacity1 and is the cause of the Amnesic Shellfish Poisoning (ASP) syndrome, known since the first documented intoxication in 1987, through blue mussel consumption in Canada.2 Since this event, many programs have been established to understand the toxin-release mechanism from algae and to predict and prevent contamination incidents. However, the subject still remains poorly understood; in the case of diatoms, not all species of this genus can produce DA, and the toxicity within the same species can vary even within different strains of the same toxigenic species.3 Moreover, the presence of other microbial communities can induce the release of DA as a defensive mechanism.4 In addition, the production of DA depends on miscellaneous factors; the availability of nutrients, temperature and growth phase of the organisms are also relevant parameters. Due to the difficulties in controlling all these abiotic and biotic factors, the assessment of DA has to be done with more selective methodologies to have reliable results.Liquid chromatography coupled with mass spectrometry (LC-MS) has been proved to be a sensitive and selective technique in the analysis of marine toxins. The European Commission5 established the use of LC-MS techniques as reference methods for the determination of toxins in shellfish. These techniques, in combination with appropriate sample extraction and clean-up procedures, permit the determination of DA in seafood and other matrices such as phytoplankton and seawater.6–10 Solid-phase extraction (SPE) is an exceptional technique that provides the isolation of DA from seawater and the elimination of matrix interference, especially the high content of dissolved salts. Moreover, the possibility of concentrating the sample by several orders of magnitude greatly benefits the increase of the overall sensitivity of the method.
In this study, the development of a sensitive and selective analytical method to determine and quantify DA in seawater is presented. The analytical approach is based on solid-phase extraction (SPE) followed by hydrophilic interaction liquid chromatography (HILIC) coupled with high resolution mass spectrometry (HRMS) using electrospray ionisation (ESI). The analytical approach has been in-house validated and applied to assess DA in the Ebro Delta embayment, which is the major mollusc harvesting area (mussels, oysters and clams) of the Catalan coast. The assurance of the quality and safety of these products is mandatory. Evidence of Pseudo-nitzschia spp. has been widely reported in the Ebro Delta bays during the last few years although, to date, the occurrence of Pseudo-nitzschia has never been directly related to the presence of DA.11–14 The developed method has allowed the direct accurate measurement of DA in this area and, consequently, the possibility of studying its spatial and temporal distribution. Three sample campaigns have been conducted in two bays, Fangar and Alfacs, and four lagoons, La Tancada, Illa de Buda, l'Encanyissada and Canal Vell, during three different seasons. Then, the occurrence of DA has been discussed.
2. Materials and methods
2.1 Chemicals and reagents
Domoic acid and C5′-epi-domoic acid (a diastereomer of domoic acid) (DA, 44.5 ± 3.1 μg g−1, ≥99% purity and reference CRM-03-DA) were purchased from the Cifga laboratory (Lugo, Spain). Auxiliary reagents such as ammonium formate, HPLC-grade methanol (MeOH), ultra-pure water, acetonitrile (ACN) and formic acid (FA) were supplied by Merck (Darmstadt, Germany). Standard solutions of DA were prepared in MeOH.2.2 Sampling
Three sampling campaigns were carried out in the Ebro Delta wetland (north-east Spain, Mediterranean Sea) during October 2015, February 2016 and June 2016. Surface seawater was collected from two semi-closed bays, Fangar and Alfacs bays, and from four lagoons, La Tancada, Illa de Buda, l'Encanyissada and Canal Vell. Temperature (°C), salinity and pH (Table S2†) were measured with a multiparameter probe Professional Plus YSI 2030 from Yellow Springs Instruments (Ohio, USA) on each sampling date. Sampling point details are shown in Fig. S1,† and detailed information is provided in Table S1 of the ESI.†Seawater samples were collected at a 1 m depth using a Niskin bottle and were stored in amber glass bottles at −20 °C until the analyses.
2.3 Sample treatment
The optimized sample treatment (see optimization details in Results section 3.1) was as follows: 500 mL of seawater was extracted by solid-phase extraction (SPE) employing hydrophilic–lipophilic balance cartridges (OASIS HLB, 200 mg) from Waters (Cerdanyola del Vallès, Spain). Cartridge conditioning and equilibration were accomplished with 6 mL of MeOH and 6 mL of ultrapure water with 0.1% FA. Then, the samples were acidified with 0.1% FA, and cartridge loading was performed at a flow rate of 1 mL min−1. After loading, the cartridges were cleaned with 6 mL of ultra-pure water acidified with 0.1% FA. Finally, MeOH was evaporated from the extracts under gentle N2 flow in a TurboVap from Biotage (Uppsala, Sweden). Extracts were reconstituted with 250 μL of acetonitrile–ammonium formate/FA buffer (9 : 1), which is the mobile phase composition at the beginning of the chromatographic run.2.4 Instrumental analysis by HILIC-HRMS
The optimal instrumental conditions (see optimization details in Results section 3.1) were as follows: chromatographic separation was achieved by ultra-high performance liquid chromatography (UPLC) using the Acquity Waters (Harwich, Massachusetts, USA) system equipped with a HILIC (HILIC LUNA® 150 mm × 2 mm, 3 μm, 200 Å) column from Phenomenex (Torrance, California, USA). The mobile phase was composed of (A) 90% of acetonitrile and 10% of 50 mM ammonium formate at pH 3.2 and (B) 50% acetonitrile, 40% water and 10% of 50 mM ammonium formate at pH 3. The elution gradient was programmed as follows: 0 min (100% A) – 2 min (100% A) – 8 min (100% B) – 9 min (100% A) – 10 min (100% A). An extra 5 minutes was added between each analysis in order to stabilize the pressure in the column. The flow rate was established to be 0.3 mL min−1. The samples were kept at 10 °C in an auto-sampler, and the injection volume was 20 μL.Liquid chromatography was coupled with mass spectrometry through a heated electrospray ionization source (HESI-II) from Thermo Fisher Scientific (San Jose, California, USA) operating in positive ion mode. The optimal parameters of the source are as follows: sheath flow gas of 60 a.u., auxiliary gas of 15 a.u., and sweep gas of 2 a.u. Heater and capillary temperatures were set at 350 and 320 °C, respectively. The S-lens RF level was 60% and the spray voltage was 3.5 kV.
Mass spectrometry was performed with a Thermo Scientific Q-Exactive™ mass spectrometer from Thermo Fisher Scientific (San Jose, California, USA) with a hybrid quadrupole-Orbitrap analyser. Data were acquired in full scan mode in the range of 50–800 m/z at a resolution of 70![[thin space (1/6-em)]](https://www.rsc.org/images/entities/char_2009.gif) 000 [full width at half maximum (FWHM)], and contemporary in the MS/MS spectrum at a resolution of 35000 FWHM in parallel reaction monitoring (PRM) mode. The normalized collision energy (NCE) was set at 10 a percentage of 30 for the molecular ion [M + H]+ = 312.1 of the target toxin.
000 [full width at half maximum (FWHM)], and contemporary in the MS/MS spectrum at a resolution of 35000 FWHM in parallel reaction monitoring (PRM) mode. The normalized collision energy (NCE) was set at 10 a percentage of 30 for the molecular ion [M + H]+ = 312.1 of the target toxin.
Data analysis was carried out using Thermo Xcalibur 3.1.667 software from Thermo Fisher Scientific. Identification of DA was achieved with the retention time and exact mass (never exceeding 2 ppm of error between the accuracy mass and the calculated exact mass) of the precursor ion in the full scan mode and the fragment ions. Using the same criteria, quantification was performed by integrating the area of the most intense product ions (peaks with at least seven scan points) and the confirmation was performed with two other fragment ions following the abundance ratio of each one.
2.5 Validation of the method
Method validation was accomplished with the evaluation of the selectivity, linearity, precision, sensibility, accuracy, limits of detection (LODs) and limits of quantification (LOQs) using standard solutions of DA and fortified seawater.Because of the lack of noticeable instrumental noise, the lowest concentration at which the signal can be measured (fulfilling the required points per peak and selectivity criteria) was considered the iLOD. Consequently, the instrumental LOQ (iLOQ) was calculated, which was 10/3 times the iLOD.
The method LOD (mLOD) for each extraction procedure was determined by the analysis of the standard solution in the matrix resulting from the particulate and the filtrate extracts. LODs were established to be the lowest concentration measurable of the matrix-matched calibration curve. The method LOQs (mLOQs) were estimated to be 10/3 times the mLODs.
For this, fortified blanks of seawater were subjected to the pre-treatment process. Values obtained were compared with those from the extracts subjected to the same process but fortified for the LC-MS analysis.
The matrix effect was evaluated to determine a possible signal enhancement or ion suppression during the ionization process at source by interferent substances present in seawater. To assess the effects of the matrix, fortified solutions of DA in seawater extracts and pure solvent were compared, and the percentage of effect was calculated according to the following expression:
% Matrix effects = ([area]seawater/[area]solvent) × 100, where [area]seawater is the integrated area of DA in the seawater extracts and [area]solvent is the corresponding area in pure solvent.
3. Results and discussion
3.1 Analytical method optimisation
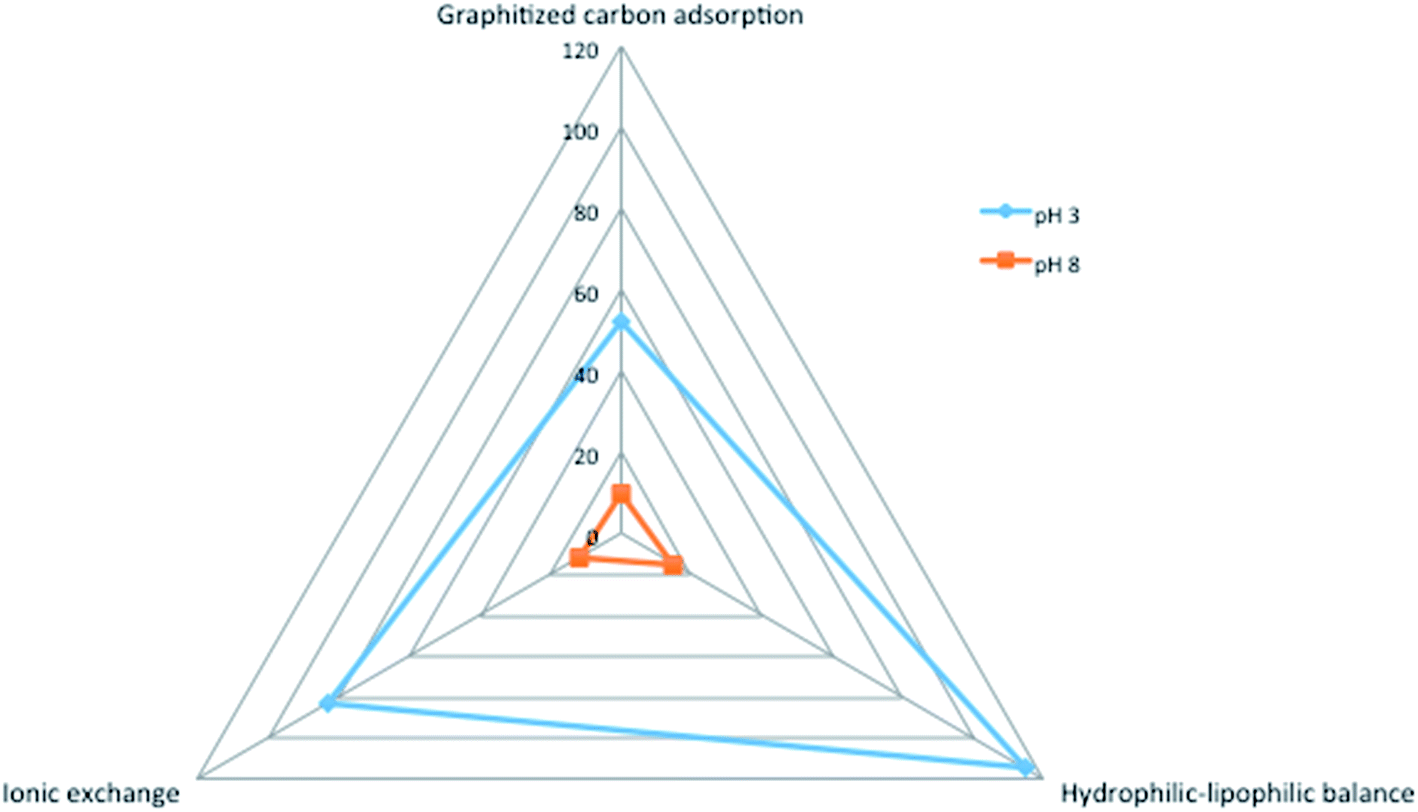
The high polarity of DA increases the difficulty in isolating it from the aqueous phase during extraction. The molecule possesses three carboxylic acid groups and one amino group, with pKas ranging from 1.85, 4.47, and 4.75 to 10.6.15 To optimise extraction from seawater different stationary phases and procedures have been studied: (i) the hydrophilic–lipophilic balance using OASIS HLB (500 mg, 6 cm3) cartridges from Waters; (ii) carbon adsorption using ENVI CARB graphitized charcoal cartridges (500 mg, 6 cm3), from Merck; and (iii) ionic exchange, in both cation and anion exchange modalities, with Isolute WCX (500 mg, 6 cm3) and Isolute SAX (500 mg, 6 cm3) cartridges, respectively, both from Biotage (Uppsala, Sweden).All cartridges were conditioned with 6 mL of methanol and equilibrated with 6 mL of water adjusted at the same pH of the sample. Loading and elution conditions were optimized for each cartridge independently:
For HLB, 100 mL spiked seawater was loaded at pH 3 or pH 8. A washing step after loading was performed with 6 mL of water at pH 3 or pH 8, and elution was carried out with 20 mL of methanol.
For ENVI CARB, 100 mL spiked seawater at pH 3 and pH 8 was loaded into the cartridge. A washing step with 20 mL of water at pH 3 or 8 was added. Elution was performed with 25 mL of a mixture of methanol/acetonitrile/acetone (1:1:1).
For SAX and WCX, 25 mL of spiked seawater was loaded into the cartridges conditioned at pH 8 for anion exchange and at pH 3 for cation exchange. Elution was carried out with 25 mL of methanol.
All extracts from the elution step were concentrated and reconstituted as explained in Section 2.3 for the subsequent analysis.
Recovery values for different SPE treatments are presented in Fig. 1. As can be seen, the best recovery rates were obtained for the HLB stationary phase when the spiked samples were conditioned at pH 3. The graphitized carbon showed as well acceptable values with the samples conditioned at acidic pH but repeatability was higher with HLB. On the other hand, the elution of DA graphitized carbon required higher volumes of solvent than the HLB. Regarding the cation/anion exchange strategy, the cation exchange allowed better recovery of DA than the anion one, but lower than that with HLB and samples at acidic pH. Considering the results under these conditions HLB cartridges were selected for further optimisation.
 | ||
| Fig. 1 Values of recovery obtained in the different SPE treatments. | ||
The HLB phase was tested by loading different volumes of samples: 100 mL, 250 mL, 500 mL and 1.0 L. A sample volume of 500 mL was selected as the maximum volume without the critical loss of the compounds and the clogging of the cartridge, reaching a value of 69.24 ± 1.14% and 48.09 ± 17% at concentration levels of 20 ng L−1 and 50 ng L−1, respectively. Although the recoveries were a bit lower when loading higher volumes of samples, a significant improvement in the mLOQ was obtained with 500 mL of seawater instead of 100 mL because of the high pre-concentration of the sample; thus 500 mL was selected as the optimal volume. For quantification purposes, recovery correction was applied for each sample.
For the chromatographic separation, two different types of chromatography techniques were compared: reversed-phase liquid chromatography (RPLC) using a C18 Synergy (50 mm × 2 mm, 5 μm, 80 Å) analytical column, and hydrophilic interaction liquid chromatography (HILIC) using a HILIC LUNA® (150 mm × 2 mm, 3 μm, 200 Å) analytical column, both from Phenomenex. For HILIC, the mobile phase was composed of (A) acetonitrile and (B) water with FA and ammonium formate (see the optimised elution gradient in Section 2.4). RPLC was performed using a mobile phase composed of (A) 90% acetonitrile 0.1% FA and (B) 10% water 0.1% FA with an isocratic gradient. The working flow rate was established to be 0.3 mL min−1 and the total analysis run was for 10 min.
The extracted ion chromatograms of DA using RPLC and HILIC are shown in Fig. 2. As can be seen, a good peak shape was obtained in both cases, but using RPLC the retention time was 1.40 min. Such a short retention time is favourable in terms of rapid screening, but this retention time is too close to the dead time. While RPLC chromatographic approaches have been used for the analysis of DA in shellfish and plankton in combination with some other lipophilic toxins,16,17 poor retention of DA may cause its coelution with multiple matrix components that may elute at the beginning of the chromatogram in complex extracts, potentially interfering with its detection and causing matrix effect. Because of this, HILIC has been selected as the optimal column since it increases DA retention and allows the separation of DA from its isomer epi-DA with a retention time of 7.40 min. This type of chromatography gives the possibility of combining the analysis of DA with other hydrophilic marine toxins, allowing a high throughput analysis of polar compounds in seawater. In mussel analysis, HILIC columns have already been employed in the determination of DA along with PSP toxins with a suitable resolution.6,18
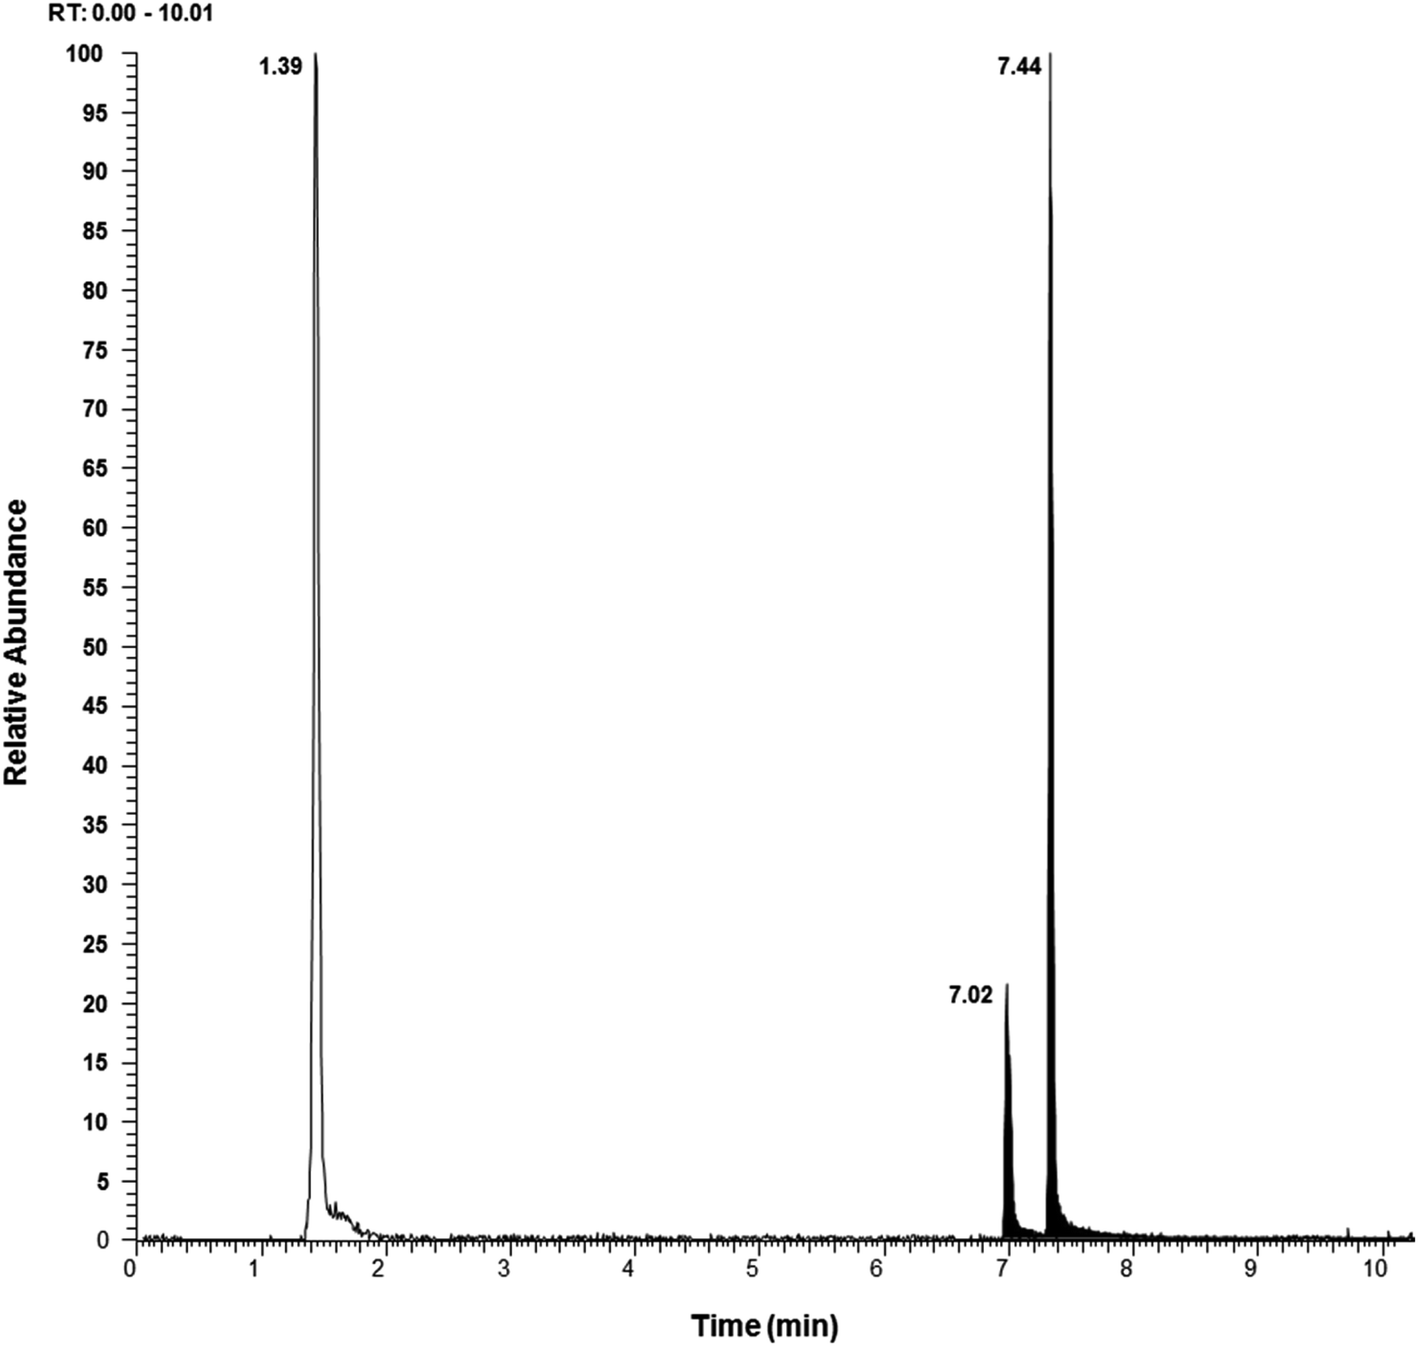 | ||
| Fig. 2 Extracted ion chromatograms of DA from the two different chromatography techniques: white color corresponds to the reverse-phase column (C18) while the black color corresponds to the hydrophilic interaction column (HILIC) which separates DA (tr 7.44) from its isomer epi-DA (tr 7.02). | ||
Two mass spectrometer analysers were compared for the determination of DA: a triple quadrupole working in the acquisition mode of Selected Reaction Monitoring (SRM), and an Orbitrap operating in PRM mode. A standard solution of DA in MeOH was directly infused into the mass spectrometers by soft ionization with an electrospray ionization (ESI) source. Optimal conditions were obtained for the ionization of DA and its fragmentation in the two instruments. Fragmentation patterns are shown in Table 1.
| Chemical formula | Precursor ion | m/z | Collision energy 1 | Product ion 1 | m/z | Collision energy 2 | Product ion 2 | m/z | |
|---|---|---|---|---|---|---|---|---|---|
| Orbitrap | C15H21NO6 | [M + H]+ | 312.1442 (1.5 ppm) | 30% NCE* | [C14H20O4N]+ | 266.1382 (1 ppm) | 30% NCE* | [C14H18O3N]+ | 248.1275 (1.5 ppm) |
| QqQ | 312 | 16.6 V | 266 | 17.6 V | 248 |
Sensitivity, resolution and selectivity were compared for both analysers, and Orbitrap was selected for this study. In terms of sensitivity, there is no significant difference between both mass spectrometer analysers, but working in PRM mode provides extra selectivity than working in SRM, thanks to accurate mass measurements. Also, the PRM mode can be combined with parallel full-MS acquisition, which allows the possibility of performing retrospective analysis for the detection of suspected compounds and even non-target analysis at high resolution for the identification of other pollutants. The high-resolution mass spectrum of DA obtained at 30% of NCE is shown in Fig. 3.
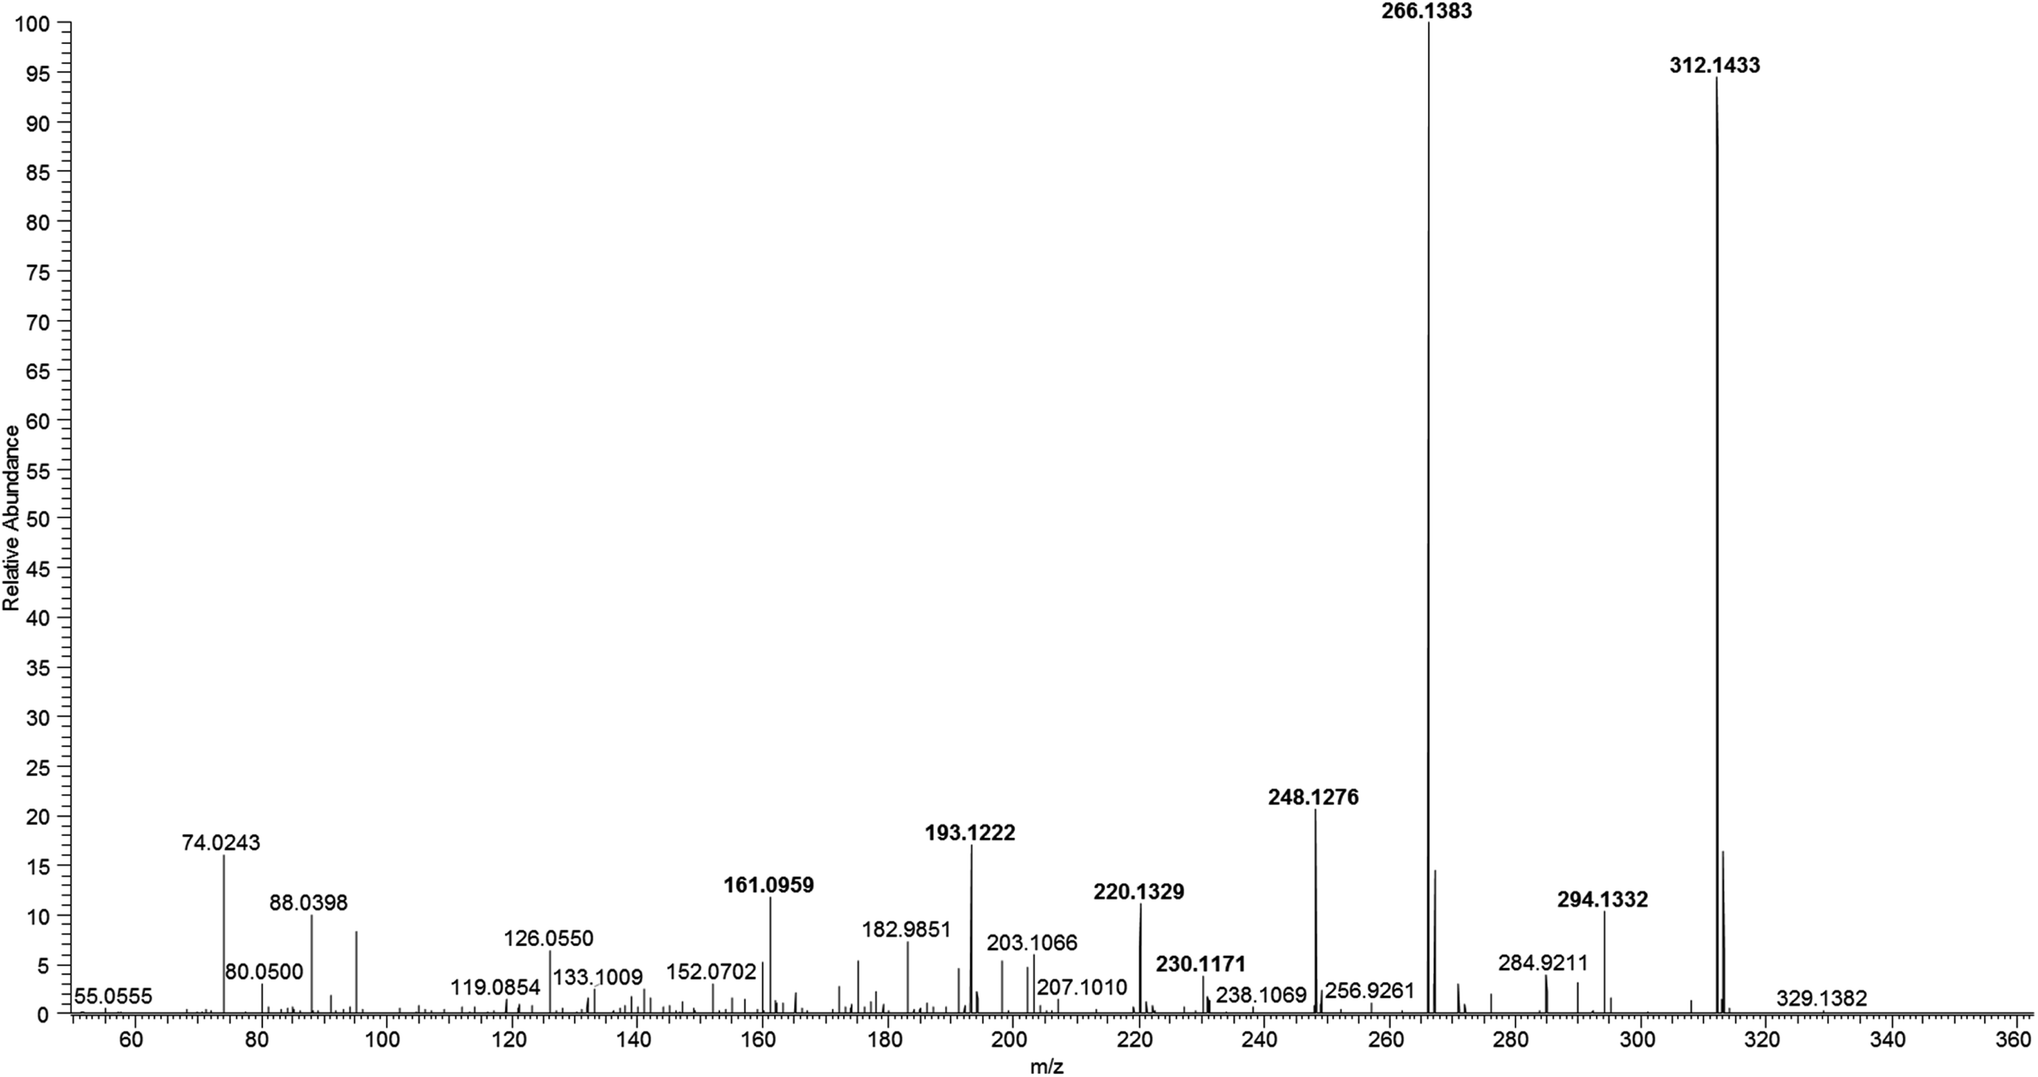 | ||
| Fig. 3 High resolution mass spectrum of DA obtained with Q Exactive. | ||
In Table 2, the quality parameters of this method are summarized. Good performance of the method has been achieved. The most notable quality is the high sensitivity with the mLOD reaching 0.25 ng L−1 for DA. To our knowledge, these are the lowest values reported in the literature. Other sensitive methods based on LC-MS presented mLOD values ranging from 750 ng L−1,8 30 ng L−1 (ref. 7) to the lowest value of 0.3 ng L−1.19
| Instrumental parameters | |||
|---|---|---|---|
| iLOD (pg on column) | Linearity range (ng L−1), R2 | Intra-day precision | Inter-day precision |
| 10 μg L−1 (RSD%, n = 6) | 10 μg L−1 (RSD%, n = 3) | ||
| 1 | 50–50000 (0.999) |
5.53 | 2.91 |
| Method parameters | ||||
|---|---|---|---|---|
| mLOD/mLOQ (ng L−1) | Linearity range (ng L−1) and linearity (R2) | Recovery (%, n = 3) | Matrix effect (%) | |
| 20 ng L−1 | 50 ng L−1 | |||
| 0.25/0.75 | 2–50 (0.995) | 69.24 ± 1.14 | 48.09 ± 7 | 73 |
3.4 Levels of DA in coastal waters
In Table 3, the DA concentrations detected in 34 seawater samples from Ebro's Delta are summarised. DA was present in 65% of the samples at the ng L−1 level. The concentration of DA ranged from 0.90 to 69.6 ng L−1 with a mean value of 17.3 ng L−1 and a median of 5.59 ng L−1. The presence of DA was prevalent in Alfacs and Fangar bays during the seasons analysed while in the lagoons only La Tancada showed a positive result with a concentration of 8.78 ng L−1. The La Tancada lagoon was similar to the bays in terms of salinity. Pseudo-nitzschia spp. are marine and preferably grow in a saline environment.20 Moreover, the production of DA can be favoured at high salinity.21 Then, this influence from seawater could explain why DA is present in this lagoon and not in the rest.| Coordinates | Sampling campaign | |||
|---|---|---|---|---|
| 1 (Oct-15) | 2 (Feb-16) | 3 (Jun-16) | ||
| Alfacs | 40.610, 0.724 (beach) | 11.6 | 67.2 | 14.6 |
| 40.601, 0.610 (shore) | 18.4 | 14.3 | 69.6 | |
| 40.584, 0.579 (open sea) | 15.0 | 21.6 | 41.7 | |
| 40.605, 0.609 (open sea) | No sample | 8.08 | 24.7 | |
| Fangar | 40.800, 0.700 (beach) | 2.20 | 8.11 | 5.1 |
| 40.798, 0.713 (shore) | 4.16 | 2.29 | 11.2 | |
| 40.815, 0.743 (open sea) | 6.09 | 0.9 | 10.1 | |
| 40.817, 0.751 (open sea) | No sample | <LOQ | 13.9 | |
| La Tancada | 40.645, 0.742 (lagoon) | 8.78 | <LOQ | <LOD |
| Illa de Buda | 40.703, 0.841 (lagoon) | <LOD | <LOD | <LOD |
| L'Encanyissada | 40.657, 0.673 (lagoon) | <LOD | <LOD | <LOD |
| Canal Vell | 40.745, 0.788 (lagoon) | <LOD | <LOD | <LOD |
The highest concentrations were found in Alfacs bay in the summer season, with a maximum value of 69.6 ng L−1, followed by 67.2 ng L−1, which was detected at the same sampling site during wintertime. This last value was unexpected, considering that during the coldest months the upwelling phenomenon takes place, driving the nutrients from the surface to deeper waters, and the temperatures are lower, having a negative influence on the phytoplankton growth. But these bay areas constantly receive agricultural discharges of freshwater with a high content of nutrients that can disrupt the annual variation of nutrient availability. In other studies, DA has also been detected in shellfish during winter months along the Catalan coast. Giménez-Papiol et al. reported concentrations of DA in February and April exceeding the EFSA suggested regulation levels (4.5 mg DA per kg shellfish) and even the maximum permitted in the current legislation (20 mg DA per kg shellfish).13 These values are in the same range as other studies that determined DA in estuarine areas in the Mediterranean Sea.
For example, Barbaro E. et al. registered concentrations ranging from 1.5 to 16.2 ng L−1 in the Venice lagoon that is strongly influenced by the seawater from the Adriatic Sea.19 More focused on the studied area of Ebro's Delta, Busch et al. reported concentrations of DA between 3.2 and 18.8 ng L−1 in Fangar bay but not in Alfacs.12
Comparing the results of the two bays, Alfacs had, in general, higher levels of DA than Fangar. The differences between the total concentration of DA along with the three sampling campaigns in the two bays are displayed in Fig. 4. The location of the bays could be the factor that explains this difference since both have a semi-closed shape but water residence time and stratification differ significantly in both cases: Fangar bay is in the northern part of the delta and influenced by the littoral current coming from the north to the south (Northern current22), whereas Alfacs is a bay located in the southern part where marine recirculation of water is slower because of the physical barrier that the delta imposes,23 and freshwater inputs have longer residence times. Water stratification,14 the occurrence of inorganic components (i.e. silicates and Cu2+)24 and organic nutrients25 are known to be correlated with the abundance of Pseudo-nitzschia spp. (or other algae responsible for their emission, as hypothesized by Busch et al.), and all these parameters in the Ebro Delta embayments are substantially affected by the dynamics of irrigation channels. Then, growth of algal phytoplankton could be more favoured in Alfacs, and consequently, the release of DA.
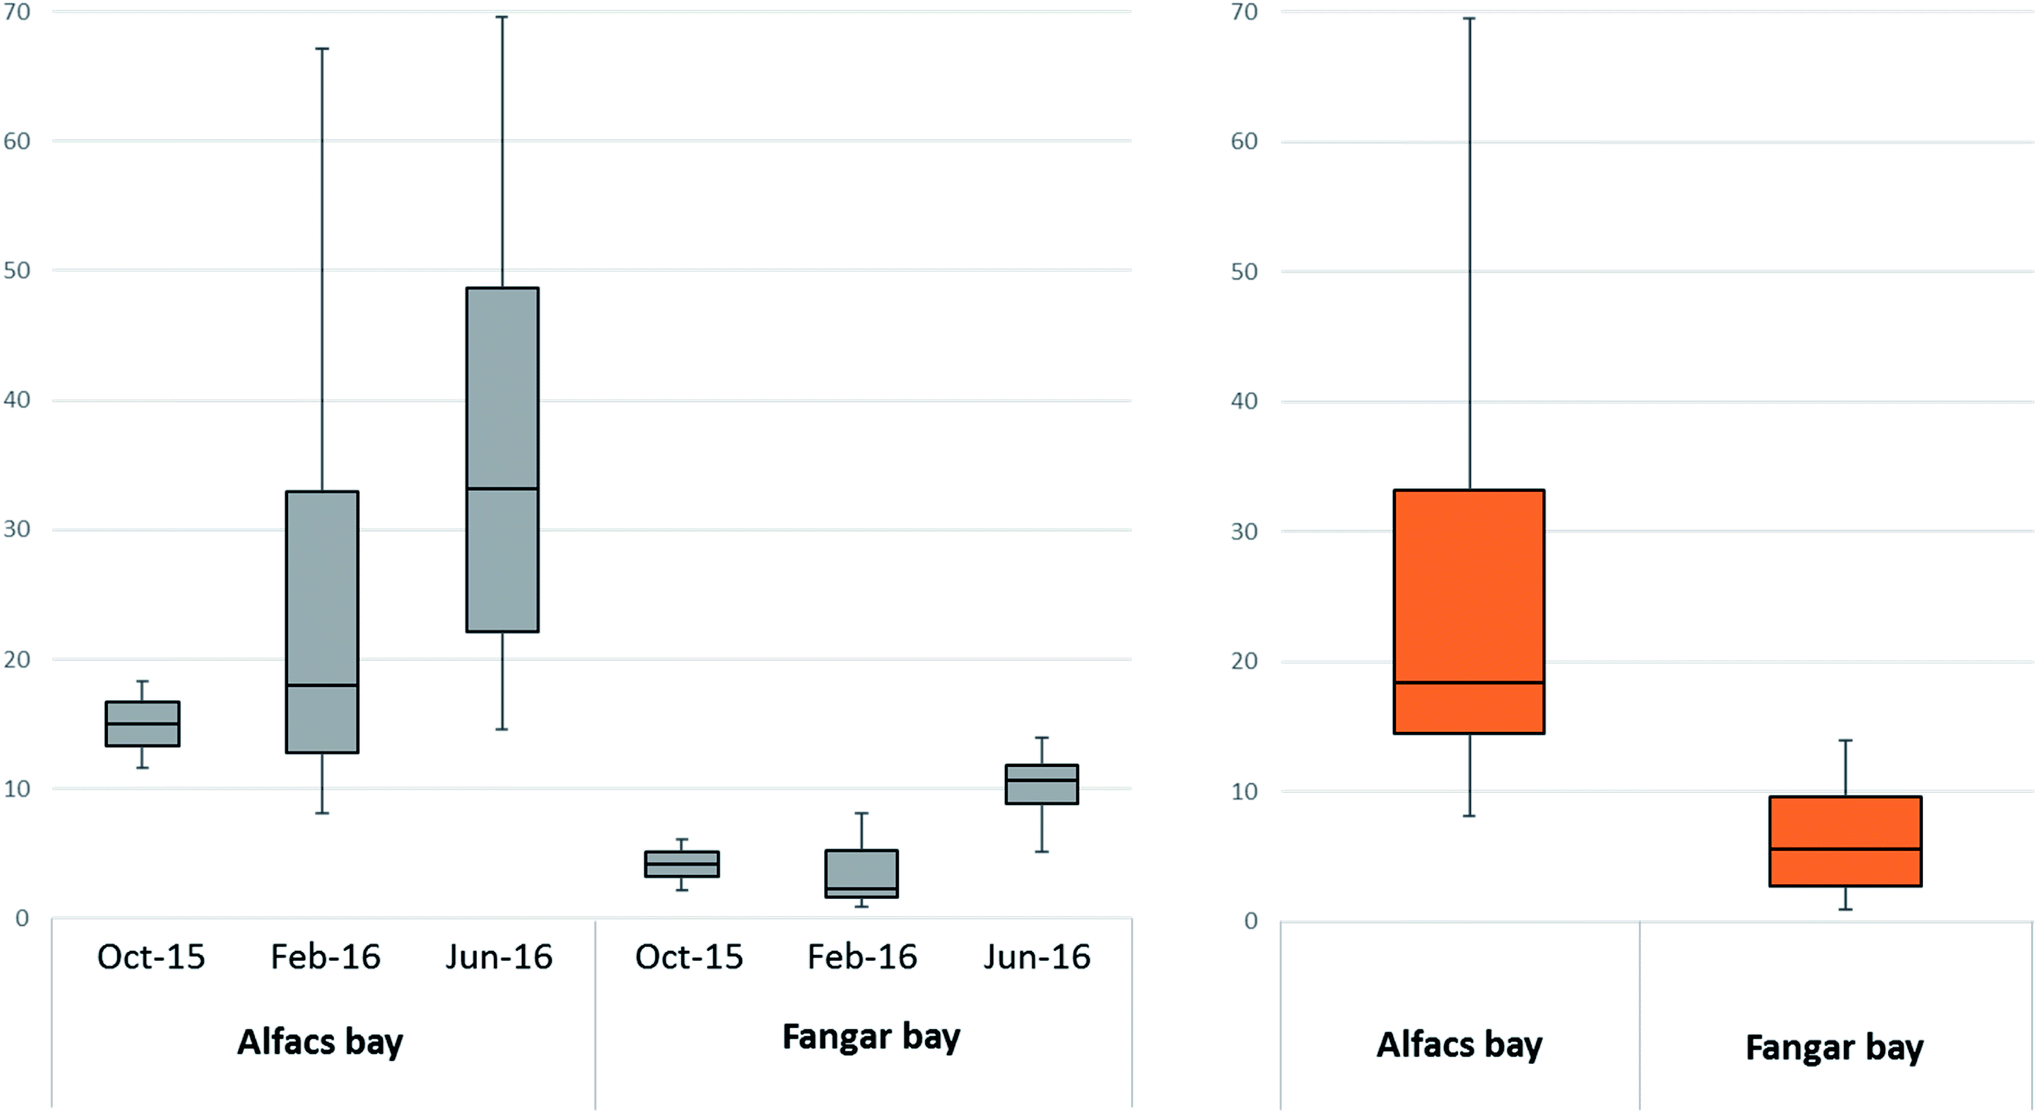 | ||
| Fig. 4 Box plot graphs of the DA concentration: grey color for the two bays during the three sample campaigns; October 2015, February and June 2016; orange for the total concentration in three campaigns in the two different bays. | ||
Regarding seasonal variability, a slight tendency can be observed from the lowest DA concentrations in autumn months to the highest in summer months. The differences in the DA concentrations in each bay during different months of sampling are shown in Fig. 4. This tendency can be observed when considering the median values of all the concentrations detected in each bay across different months. More in detail, this tendency seems to be clearer for the samples taken in the open sea than for those samples from a beach and shore, where the concentration of DA did not seem to follow a clear temporary pattern. This tendency can be as well observed in the box-and whisker plot for the tree sampling campaign presented in Fig. S2.† However, the P-value was 0.1196 that can be considered insignificant. Therefore, the variation among campaign medians is not significantly greater than expected by chance. The Kruskal–Wallis test was applied because the distribution of the results did not pass the normality test for all sampling campaigns.
As commented previously, these semi-closed bays are constantly influenced by variable freshwater discharges from agricultural activities, leading to no regular values of salinity, nutrients and turbidity in the nearshore.
4. Conclusions
A highly sensitive analytical method for the detection and quantification of DA in seawater has been developed and applied to the analysis of water samples from the marine bays of the Ebro Delta.For the method development, several stationary phases were tested and Oasis HLB cartridges were selected. Mean recovery values ranging from 48 to 69% were obtained when treating 500 mL samples acidified with FA. A low matrix effect was observed, indicating the elimination of interference and salt from seawater. Anyway, this effect of ion suppression was assessed by quantification with a matrix-matched calibration curve. High sensitivity has been achieved, thanks to the 2000-fold concentration of the samples, allowing a mLOD and mLOQ of 0.25 and 0.75 ng L−1, respectively.
The high polarity of DA allows the option of using both RPLC and HILIC with suitable resolution and peak shapes. However, HILIC has been selected in this study to determine DA because of its higher retention factor and for a possible combination in the joint analysis of other hydrophilic compounds present in seawater. Moreover, the separation of DA and its isomer epi-DA was possible.
The Orbitrap and triple-quadrupole mass spectrometers presented good sensitivity and selectivity. However, the Orbitrap-MS was selected for the method, not only for its highest resolution but also for its capability to acquire comprehensive sample screenings in the full-MS mode at high resolution and the possibility of conducting retrospective analyses and carrying out non-target screening of other MBTs and contaminants.
Final validation of the method showed excellent performance in terms of sensitivity, linearity, repeatability, selectivity and recovery. Application of the method to real samples was successful.
DA was present in 65% of the samples analysed with a mean value of 17.3 ng L−1. The concentration of DA ranged from 0.90 to 69.6 ng L−1 and was higher during the summer campaign. Highest levels were found in Alfacs bay in every season. The occurrence of DA was not observed in the lagoons except in La Tancada where DA was detected in autumn and winter, at concentrations of <mLOQ and 8.78 ng L−1.
This study confirms the presence of DA in Ebro's Delta bays during all seasons. Although this marine toxin is present at trace level concentrations, it is essential to monitor and control DA due to its toxic properties and capability to accumulate in feeder filters which are necessary for the mariculture activities of the area.
Conflicts of interest
There are no conflicts to declare.Acknowledgements
This study was funded by the Ministry of Economy and Competitiveness through the project PLAS-MED (CTM 2017-89701C3-1-R) and by the Generalitat de Catalunya (Consolidated Research Group 2017 SGR 01404 – Water and Soil Quality Unit). The authors express their deepest gratitude to R. Chaler and D. Fanjul for their technical assistance.Bibliography
- G. D. Wohlgeschaffen, et al., Dynamics of the phycotoxin domoic acid: accumulation and excretion in two commercially important bivalves, J. Appl. Phycol., 1992, 4(4), 297–310 CrossRef CAS.
- S. Bates, et al., Pennate diatom Nitzschia pungens as the primary source of domoic acid, a toxin in shellfish from eastern Prince Edward Island, Canada, Can. J. Fish. Aquat. Sci., 1989, 46(7), 1203–1215 CrossRef CAS.
- F. Cerino, et al., The alternation of different morphotypes in the seasonal cycle of the toxic diatom Pseudo-nitzschia galaxiae, Harmful Algae, 2005, 4(1), 33–48 CrossRef CAS.
- N. Lundholm, et al., Induction of domoic acid production in diatoms—Types of grazers and diatoms are important, Harmful Algae, 2018, 79, 64–73 CrossRef CAS PubMed.
- European Commission, Commission Regulation (EU) No 15/2011 of 10 January 2011 amending Regulation (EC) No 2074/2005 as regards recognised testing methods for detecting marine biotoxins in live bivalve molluscs, Off. J. Eur. Commun., 2011, 50, 3–4 Search PubMed.
- P. Ciminiello, et al., Hydrophilic interaction liquid chromatography/mass spectrometry for determination of domoic acid in Adriatic shellfish, Rapid Commun. Mass Spectrom., 2005, 19(14), 2030–2038 CrossRef CAS PubMed.
- Z. Wang, et al., Determination of domoic acid in seawater and phytoplankton by liquid chromatography-tandem mass spectrometry, J. Chromatogr. A, 2007, 1163(1), 169–176 CrossRef CAS PubMed.
- A.-L. Gagez, et al., Identification and quantification of domoic acid by UHPLC/QTOF tandem mass spectrometry, with simultaneous identification of non-target photodegradation products, Int. J. Environ. Anal. Chem., 2017, 97(12), 1192–1205 CAS.
- L. L. Mafra Jr, et al., Analysis of trace levels of domoic acid in seawater and plankton by liquid chromatography without derivatization, using UV or mass spectrometry detection, J. Chromatogr. A, 2009, 1216(32), 6003–6011 CrossRef PubMed.
- J. Y. Zhao, P. Thibault and M. A. J. E. Quilliam, Analysis of domoic acid isomers in seafood by capillary electrophoresis, Electrophoresis, 1997, 18(2), 268–276 CrossRef CAS PubMed.
- S. Quijano-Scheggia, et al., Pseudo-nitzschia species on the Catalan coast: characterization and contribution to the current knowledge of the distribution of this genus in the Mediterranean Sea, Sci. Mar., 2010, 74(2), 395–410 CrossRef.
- J. A. Busch, et al., Toxigenic algae and associated phycotoxins in two coastal embayments in the Ebro Delta (NW Mediterranean), Harmful Algae, 2016, 55, 191–201 CrossRef CAS PubMed.
- G. Giménez Papiol, et al., Management of domoic acid monitoring in shellfish from the Catalan coast, Environ. Monit. Assess., 2013, 185(8), 6653–6666 CrossRef PubMed.
- M. Fernández-Tejedor, et al., Toxic phytoplankton response to warming in two Mediterranean bays of the Ebro Delta, Phytoplankton Response to Mediterranean Environmental Changes, ed. F. Briand, CIESM Publisher, Monaco, 2010, pp. 83–86 Search PubMed.
- J. A. Walter, D. M. Leek and M. J. C. J. o. C. Falk, NMR study of the protonation of domoic acid, Can. J. Chem., 1992, 70(4), 1156–1161 CrossRef CAS.
- L. J. Chiou, T. S. Yeh and J. C. Chen, LC-MS/MS method for the detection of multiple classes of shellfish toxins, Czech J. Food Sci., 2019, 37(3), 173–179 CrossRef.
- C. Hummert, et al., Simultaneous analysis of different algal toxins by LC-MS, Chromatographia, 2002, 55(11), 673–680 CrossRef CAS.
- P. Blay, et al., Screening for multiple classes of marine biotoxins by liquid chromatography-high-resolution mass spectrometry, Anal. Bioanal. Chem., 2011, 400(2), 577–585 CrossRef CAS PubMed.
- E. Barbaro, et al., Domoic acid at trace levels in lagoon waters: assessment of a method using internal standard quantification, Anal. Bioanal. Chem., 2013, 405(28), 9113–9123 CrossRef CAS PubMed.
- A. E. Thessen, et al., Effect of salinity on pseudo-nitzschia species (bacillariophyceae) growth and distribution 1, J. Phycol., 2005, 41(1), 21–29 CrossRef.
- G. J. Doucette, et al., The effect of salinity on domoic acid production by the diatom Pseudo-nitzschia multiseries, Nova Hedwigia, 2008, 133, 31–46 Search PubMed.
- J. Bethoux, Mean water fluxes across sections Mediterranean Sea in the Mediterranean Sea, evaluated on the basis, Oceanol. Acta, 1980, 3(1), 79–88 Search PubMed.
- C. Llebot, Interactions between Physical Forcing, Water Circulation and Phytoplankton Dynamics in a Microtidal Estuary, 2010 Search PubMed.
- M. S. Fuentes and G. H. Wikfors, Control of domoic acid toxin expression in Pseudo-nitzschia multiseries by copper and silica: relevance to mussel aquaculture in New England (USA), Mar. Environ. Res., 2013, 83, 23–28 CrossRef CAS PubMed.
- A. Lelong, et al., Pseudo-nitzschia (Bacillariophyceae) species, domoic acid and amnesic shellfish poisoning: revisiting previous paradigms, Phycologia, 2012, 51(2), 168–216 CrossRef CAS.
Footnote |
| † Electronic supplementary information (ESI) available. See DOI: 10.1039/c9ay02617g |
| This journal is © The Royal Society of Chemistry 2020 |