DOI:
10.1039/C9AY02357G
(Communication)
Anal. Methods, 2020,
12, 8-17
A simple “on–off–on” ECL sensor for glucose determination based on Pd nanowires and Ag doped g-C3N4 nanosheets†
Received
31st October 2019
, Accepted 26th November 2019
First published on 4th December 2019
Abstract
One-dimensional Pd nanowires (PdNWs) and Ag doped g-C3N4 nanosheets (Ag-g-C3N4 NSs) were prepared and applied to construct a simple “on–off–on” ECL sensor for glucose detection. Compared to some complex and time-consuming synthetic procedures, in this work, Ag-g-C3N4 NSs were prepared via one step thermal polymerization of melamine and AgNO3 without any handling to get the layered structure. PdNW-functionalized Ag-g-C3N4 NSs were used as luminophores, which displayed prominent ECL performance and superior efficient electron transport capacity. Combining PdNW-functionalized Ag-g-C3N4 NSs with the competitive binding reaction of the glucose–ConA–dextran system, the prepared “on–off–on” sensor showed high sensitivity and wide linearity for glucose detection. The linear range was 1.0 × 10⁻¹¹ M to 1.67 × 10⁻⁶ M and the detection limit was 3.0 × 10⁻¹² M (S/N = 3).
1. Introduction
One-dimensional (1D) nanomaterials with distinctive structural and electronic properties, such as nanowires (NWs), are receiving considerable attention because of their importance in basic research and potential applications.1–3 In particular, palladium nanowires (PdNWs), a widely applied metal nanomaterial in catalysis,4,5 have stimulated great interest for energy storage6 and sensors.7 Many studies have suggested that this intrinsic catalytic activity of PdNWs emerges from their inherent unique anisotropic structure and the synergistic effect between their different physical and chemical properties.8–10 To date, considerable effort has been made for preparing 1D nanowires, such as by the template synthesis,11 electrospinning method,12 wet-chemical method,13etc. However, it is still essential to introduce a simple and mild method to fabricate PdNWs. In this work, we proposed a one pot wet-chemical reduction route for synthesizing PdNWs using K2PdCl4, polyvinylpyrrolidone (PVP), KI and ultrapure water.
PdNWs have attracted more and more attention due to their inherent advantages such as the low background signal, high detection sensitivity, and short time consumption to drive the dreams to explore their possible applications in electrochemiluminescence (ECL).14,15 Few studies have focused on PdNW-based ECL sensors.16–18 Wang et al.16 established a sandwiched and sensitive ECL immunosensor for carcinoembryonic antigen (CEA) detection based on Pd nanowires obtained by a green approach. Ran et al.17 used platinum and palladium nanowires (Pt–Pd NWs) as signal amplification materials for the detection of L-alanine. Ye et al.18 proposed one-dimensional Pd–Au nanowires as an immobilization platform for the ECL detection of acetylcholinesterase (AChE) activity.
In recent years, a switch strategy in the ECL assay named “on–off–on” has attracted increasing attention due to its low background signal and high sensitivity compared to the “on–off” mode and “off–on” mode.19–21 Lei et al.22 constructed an “on–off–on” ECL biosensor for copper ion (Cu2+) detection. The first signal-on state with remarkably high ECL intensity was achieved by supramolecular nanorods with a co-reaction accelerator. Later, the signal-off state was achieved by ECL quencher probes (Fc-NH2/Cu-Sub/nanoAu). As expected, the second signal-on state was the ECL signal recovery when the Cu2+-specific DNAzyme irreversibly cleaved, causing the release of the quencher probes from the sensor interface. Zhao et al.23 designed a label-free ECL aptasensor via a novel “on–off–on” switch system for highly sensitive determination of kanamycin by the quenching effect of hemin/G-quadruplex DNAzymes towards the S2O82−–O2 system. Inspired by the above features of the “on–off–on” mode, finding a high initial ECL emitter as the first signal-on state is necessary to achieve a sensitive analysis.
Graphite-like carbon nitride (g-C3N4) nanosheets, which present intriguing advantages such as better film-forming properties, higher fluorescence quantum yield and lower toxicity than their bulk counterparts,24 have become a focus of attention to be effective, strong, stable and promising ECL luminophores. Many attempts have been made to synthesize g-C3N4 nanosheets from bulk g-C3N4 such as by the ultrasound process. Sha et al.25 obtained g-C3N4–COOH nanosheets by placing bulk g-C3N4 in mixed acid (VH2SO4![[thin space (1/6-em)]](https://www.rsc.org/images/entities/char_2009.gif) :VHNO3 = 3:1) and sonicating it for 12 hours. Zhang et al.26 prepared g-C3N4 nanosheets by liquid phase exfoliation in water by sonicating bulk g-C3N4 powder for 16 hours. And also many reports investigated hybridizing g-C3N4 with some nanomaterials (such as Au and Ag nanoparticles, carbon materials and polymers) to improve the ECL properties of g-C3N4.27–30 All these above processes were related to relatively complex and time-consuming synthetic procedures, which greatly limit the further applications of g-C3N4. To circumvent this challenge, we introduced a method31 to prepare Ag doped g-C3N4 nanosheets (Ag-g-C3N4 NSs) via one step thermal polymerization of melamine and AgNO3 without any handling to get the layered structure. The ECL intensity of g-C3N4 could be enhanced by chemical doping and modification of the luminophore.
:VHNO3 = 3:1) and sonicating it for 12 hours. Zhang et al.26 prepared g-C3N4 nanosheets by liquid phase exfoliation in water by sonicating bulk g-C3N4 powder for 16 hours. And also many reports investigated hybridizing g-C3N4 with some nanomaterials (such as Au and Ag nanoparticles, carbon materials and polymers) to improve the ECL properties of g-C3N4.27–30 All these above processes were related to relatively complex and time-consuming synthetic procedures, which greatly limit the further applications of g-C3N4. To circumvent this challenge, we introduced a method31 to prepare Ag doped g-C3N4 nanosheets (Ag-g-C3N4 NSs) via one step thermal polymerization of melamine and AgNO3 without any handling to get the layered structure. The ECL intensity of g-C3N4 could be enhanced by chemical doping and modification of the luminophore.
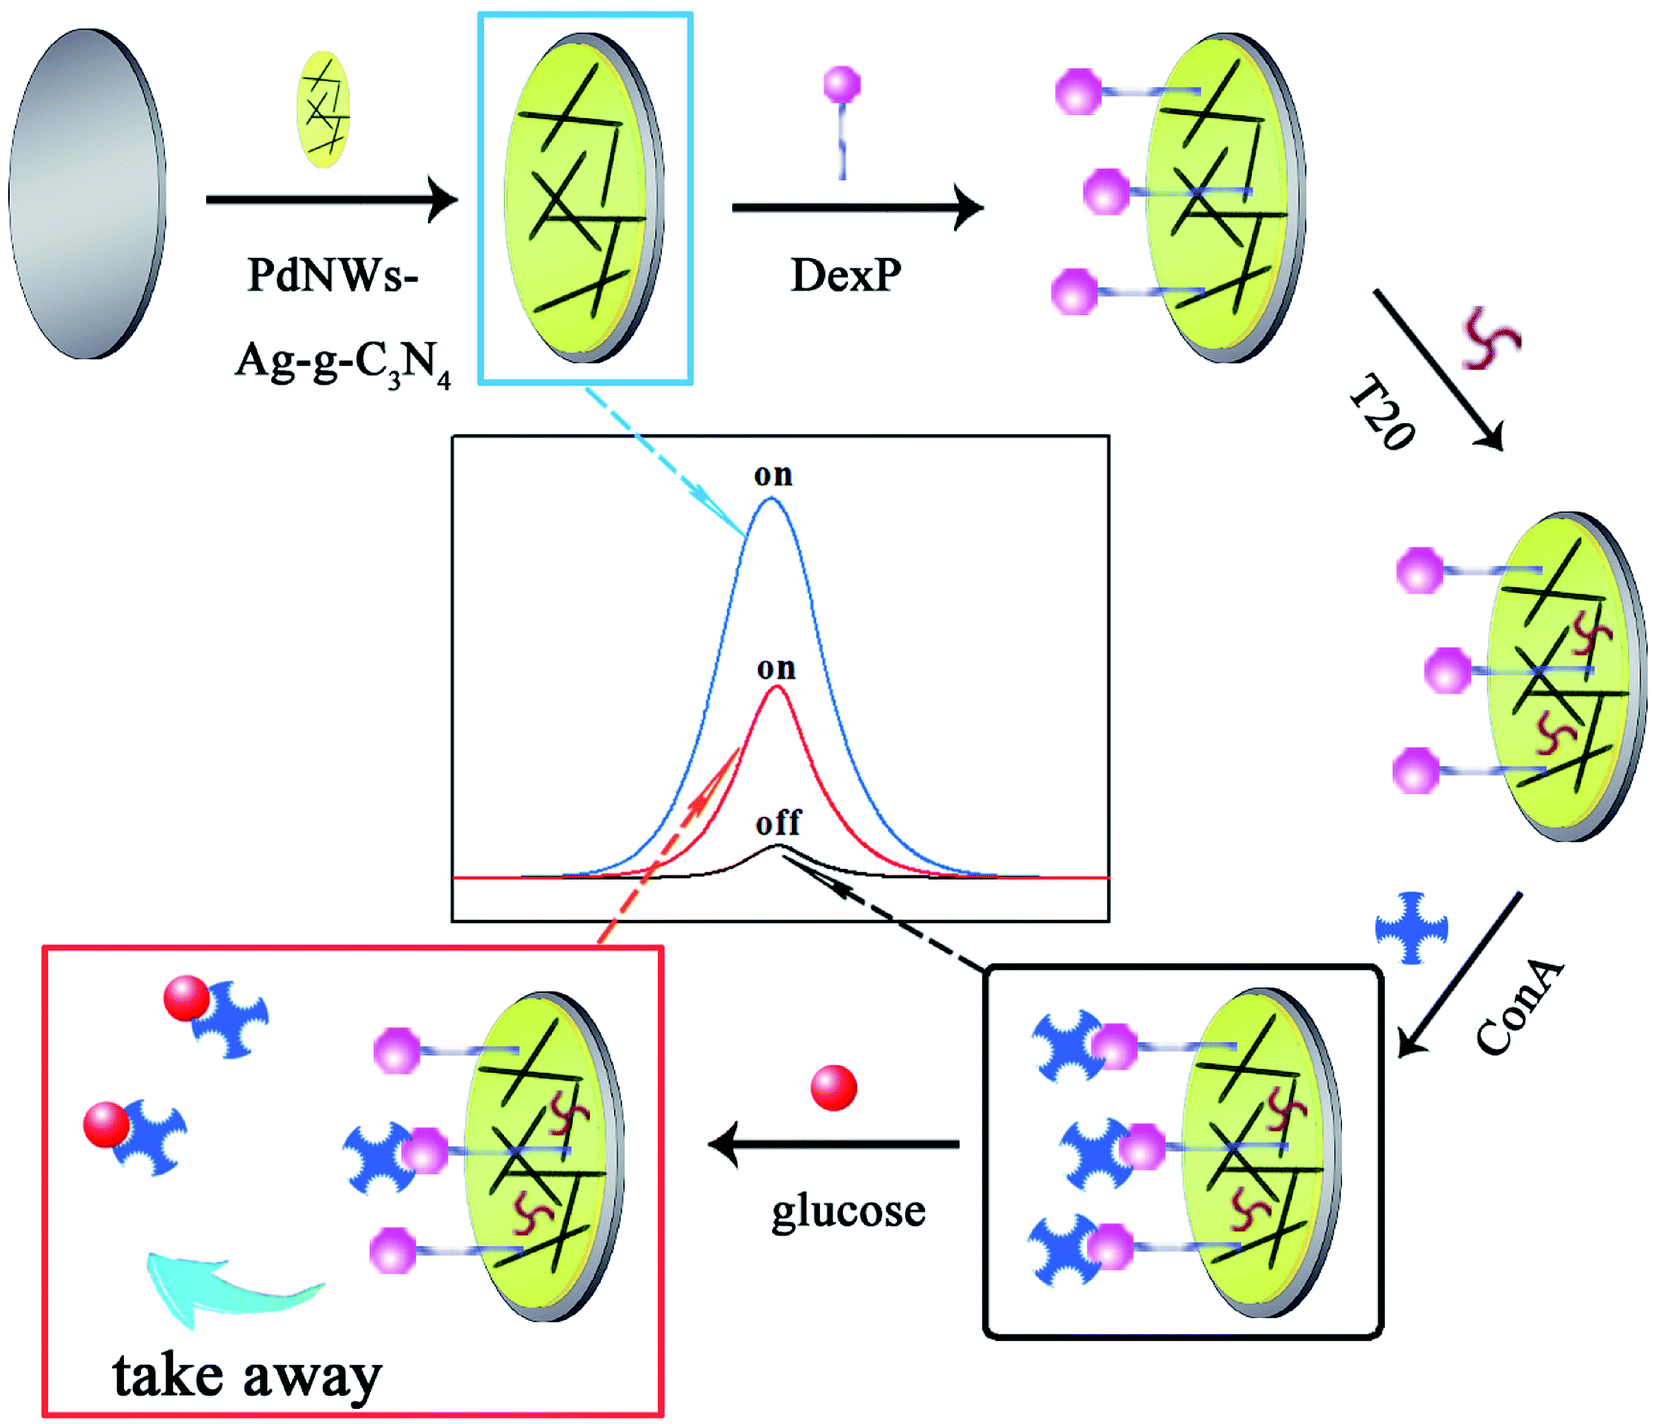
In this study, we have taken advantage of PdNW-functionalized Ag-g-C3N4 NSs and the “on–off–on” switch system to construct a highly sensitive non-enzymatic ECL sensor for the determination of glucose, which plays a crucial role in reducing health risks by monitoring its level in biological fluids. Firstly, PdNW-functionalized Ag-g-C3N4 NSs, which possess a large surface area, excellent electrocatalytic performance, and satisfactory biocompatibility, are modified onto a glass carbon electrode (GCE) for immobilizing phenoxy dextran (DexP) through π–π interaction to achieve a high initial intensity as the first “signal-on” state. Next, the “signal-off” state was obtained by incubating ConA onto the electrode via the special binding between ConA and DexP which was due to the fact that ConA protein on the electrode could hinder electron transfer. Finally, the modified electrode was immersed into the glucose solution, the glucose would compete with DexP for ConA binding sites due to the higher binding affinity of glucose for ConA than DexP, and thus ConA would be taken away from the electrode. Therefore, the hindering effect from ConA incubated on the electrode would be weakened, resulting in an increase in ECL intensity and achieving the “signal-on” state (Scheme 1). The proposed biosensor with a wide linear response range, low detection limit and good stability, was successfully applied to the determination of glucose in samples of bovine serum albumin.
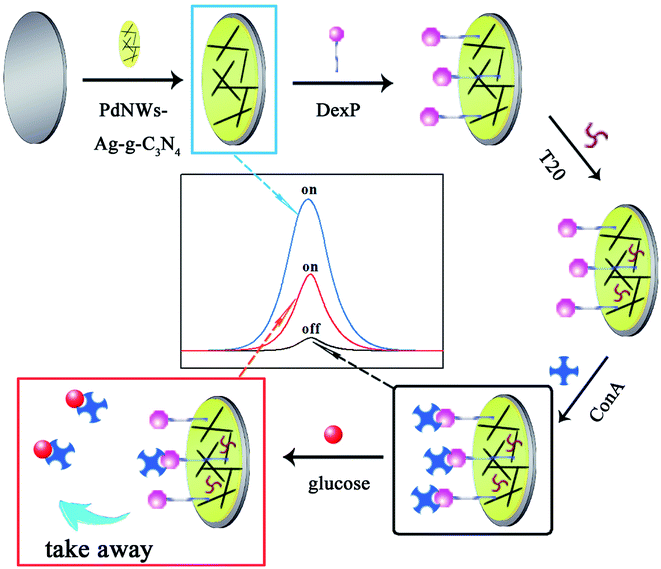 |
| | Scheme 1 Illustration of the fabrication process and the detection principle of the glucose sensor. | |
2. Materials and methods
2.1. Chemicals
Melamine (2,4,6-triamino-1,3,5-triazine, 99%), 1,2-epoxy-3-phenoxypropane (Epoxy), Concanavalin A (ConA) from Canavalia ensiformis (jack bean), Tween20, potassium palladium(II) tetrachloride (K2PdCl4, 99.998%), and poly(vinyl pyrrolidone) (PVP, MW = 29000) were received from Sigma-Aldrich (St. Louis, MO, USA). Dextran was purchased from Sinopharm Chemical Reagent Co. (Shanghai, China). Phenoxy dextran (DexP) was prepared according to the literature.32 Phosphate buffered saline (PBS) solutions with pH 7.4 were prepared using 0.10 M KCl, 0.10 M K2HPO4 and 0.10 M KH2PO4. Concanavalin A with various concentrations were prepared in 0.10 M PBS (pH 7.4) with 0.50 mM CaCl2 and 0.50 mM MnCl2 to activate the ConA conformation. All the other chemical reagents were of analytical grade and used in the convenient way. Ultrapure water (≥18 MΩ) was employed throughout the experiments.
2.2. Apparatus
The ECL and cyclic voltammetry (CV) measurements were respectively performed with an MPI-A electrochemiluminescence analyzer (Xi'an Remax, China) and a CHI 600D electrochemical work station (Shanghai CH Instruments, China). The voltage of the photomultiplier tube (PMT) of the ECL analyzer was set at 600 V in the process of detection. X-ray photoelectron spectroscopy (XPS) was performed on a Thermo Scientific Escalab 250Xi. Scanning electron microscopy (SEM) was carried out on an SU8010 (Hitachi Instruments Co., Japan). Transmission electron microscopy (TEM) was carried out on a Tecnai G2 F20 S-TWIN (Thermo Fisher Scientific, America).
2.3. Synthesis of Ag-g-C3N4 nanosheets
The Ag-doped g-C3N4 NSs were synthesized from melamine powder and AgNO3 according to Hu's method.31 Firstly, 151 mg AgNO3 was dissolved in 5 mL ultrapure water with stirring. Then, 5.0 g melamine powder was added to the above solution with stirring to make a slurry. The slurry was put into an alumina crucible with a cover and then heated at 550 °C for 4 h, and then cooled to room temperature to generate a yellow powder. The obtained yellow powder was Ag-doped g-C3N4 NSs.
2.4. Synthesis of Pd nanowires
PdNWs were prepared by a simple one-step hydrothermal method with a modification.10 Initially, 32.6 mg K2PdCl4 powder, 12 mL ultrapure water and 0.8 g PVP (29000) were mixed and stirred for 15 min. Then, KI (1.8 mL, 166 g L−1) was dropped into the above mixture with stirring. Next, the solution was transferred into a Teflon-lined stainless steel autoclave and then heated at 200 °C for 3 h. After cooling to room temperature, the PdNWs were precipitated by adding 15 mL isopropanol, then separated via centrifugation at 5000 rpm for 15 min, and purified three times with an isopropanol–ethanol mixed solution (1:1) and ultrapure water. Finally, the product was dried at 60 °C under vacuum.
2.5. Preparation of PdNWs–Ag-g-C3N4
Firstly, 3 mg Ag-g-C3N4 and 100 μL 1% chitosan solution were added into 10 mL ultrapure water with vigorous stirring for 8 h to get a homogeneous dispersion. Thus, the Ag-g-C3N4 had a better dispersion and membrane-forming properties with introducing chitosan solution. And also chitosan could provide –NH2 for binding PdNWs. After that, 2 mg PdNWs were added into the above solution with stirring overnight. Finally, the prepared PdNWs–Ag-g-C3N4 composite was centrifuged and washed several times in ethanol and ultrapure water, and then redispersed in ultrapure water for future use.
2.6. Construction of the sensor
First, a bare glassy carbon electrode (GCE, Φ = 4.0 mm) was polished to obtain a mirror-like surface according to previous literature.15 Then, it was coated with 10 μL of PdNWs–Ag-g-C3N4 suspension. After drying, 10 μL as-prepared phenoxy dextran (DexP) solution was incubated on the PdNWs–Ag-g-C3N4/GCE for 1 h via π–π interaction. After the nonspecific adsorption sites were blocked with 0.1% Tween20 (T20), 10 μL 3.5 mg mL−1 ConA was incubated on the electrode for 1 h. Subsequently, the sensor was incubated in glucose solution for 5 min and then washed carefully with ultrapure water, and the ECL response of the modified electrodes was measured in 3.0 mL 0.10 M PBS (pH 7.4). During the ECL measurement, the following parameters were set: the voltage of 600 V for the photomultiplier tube, and the scan rate of 0.3 V s−1.
3. Results and discussion
3.1. Characterization of the synthesized nanomaterials
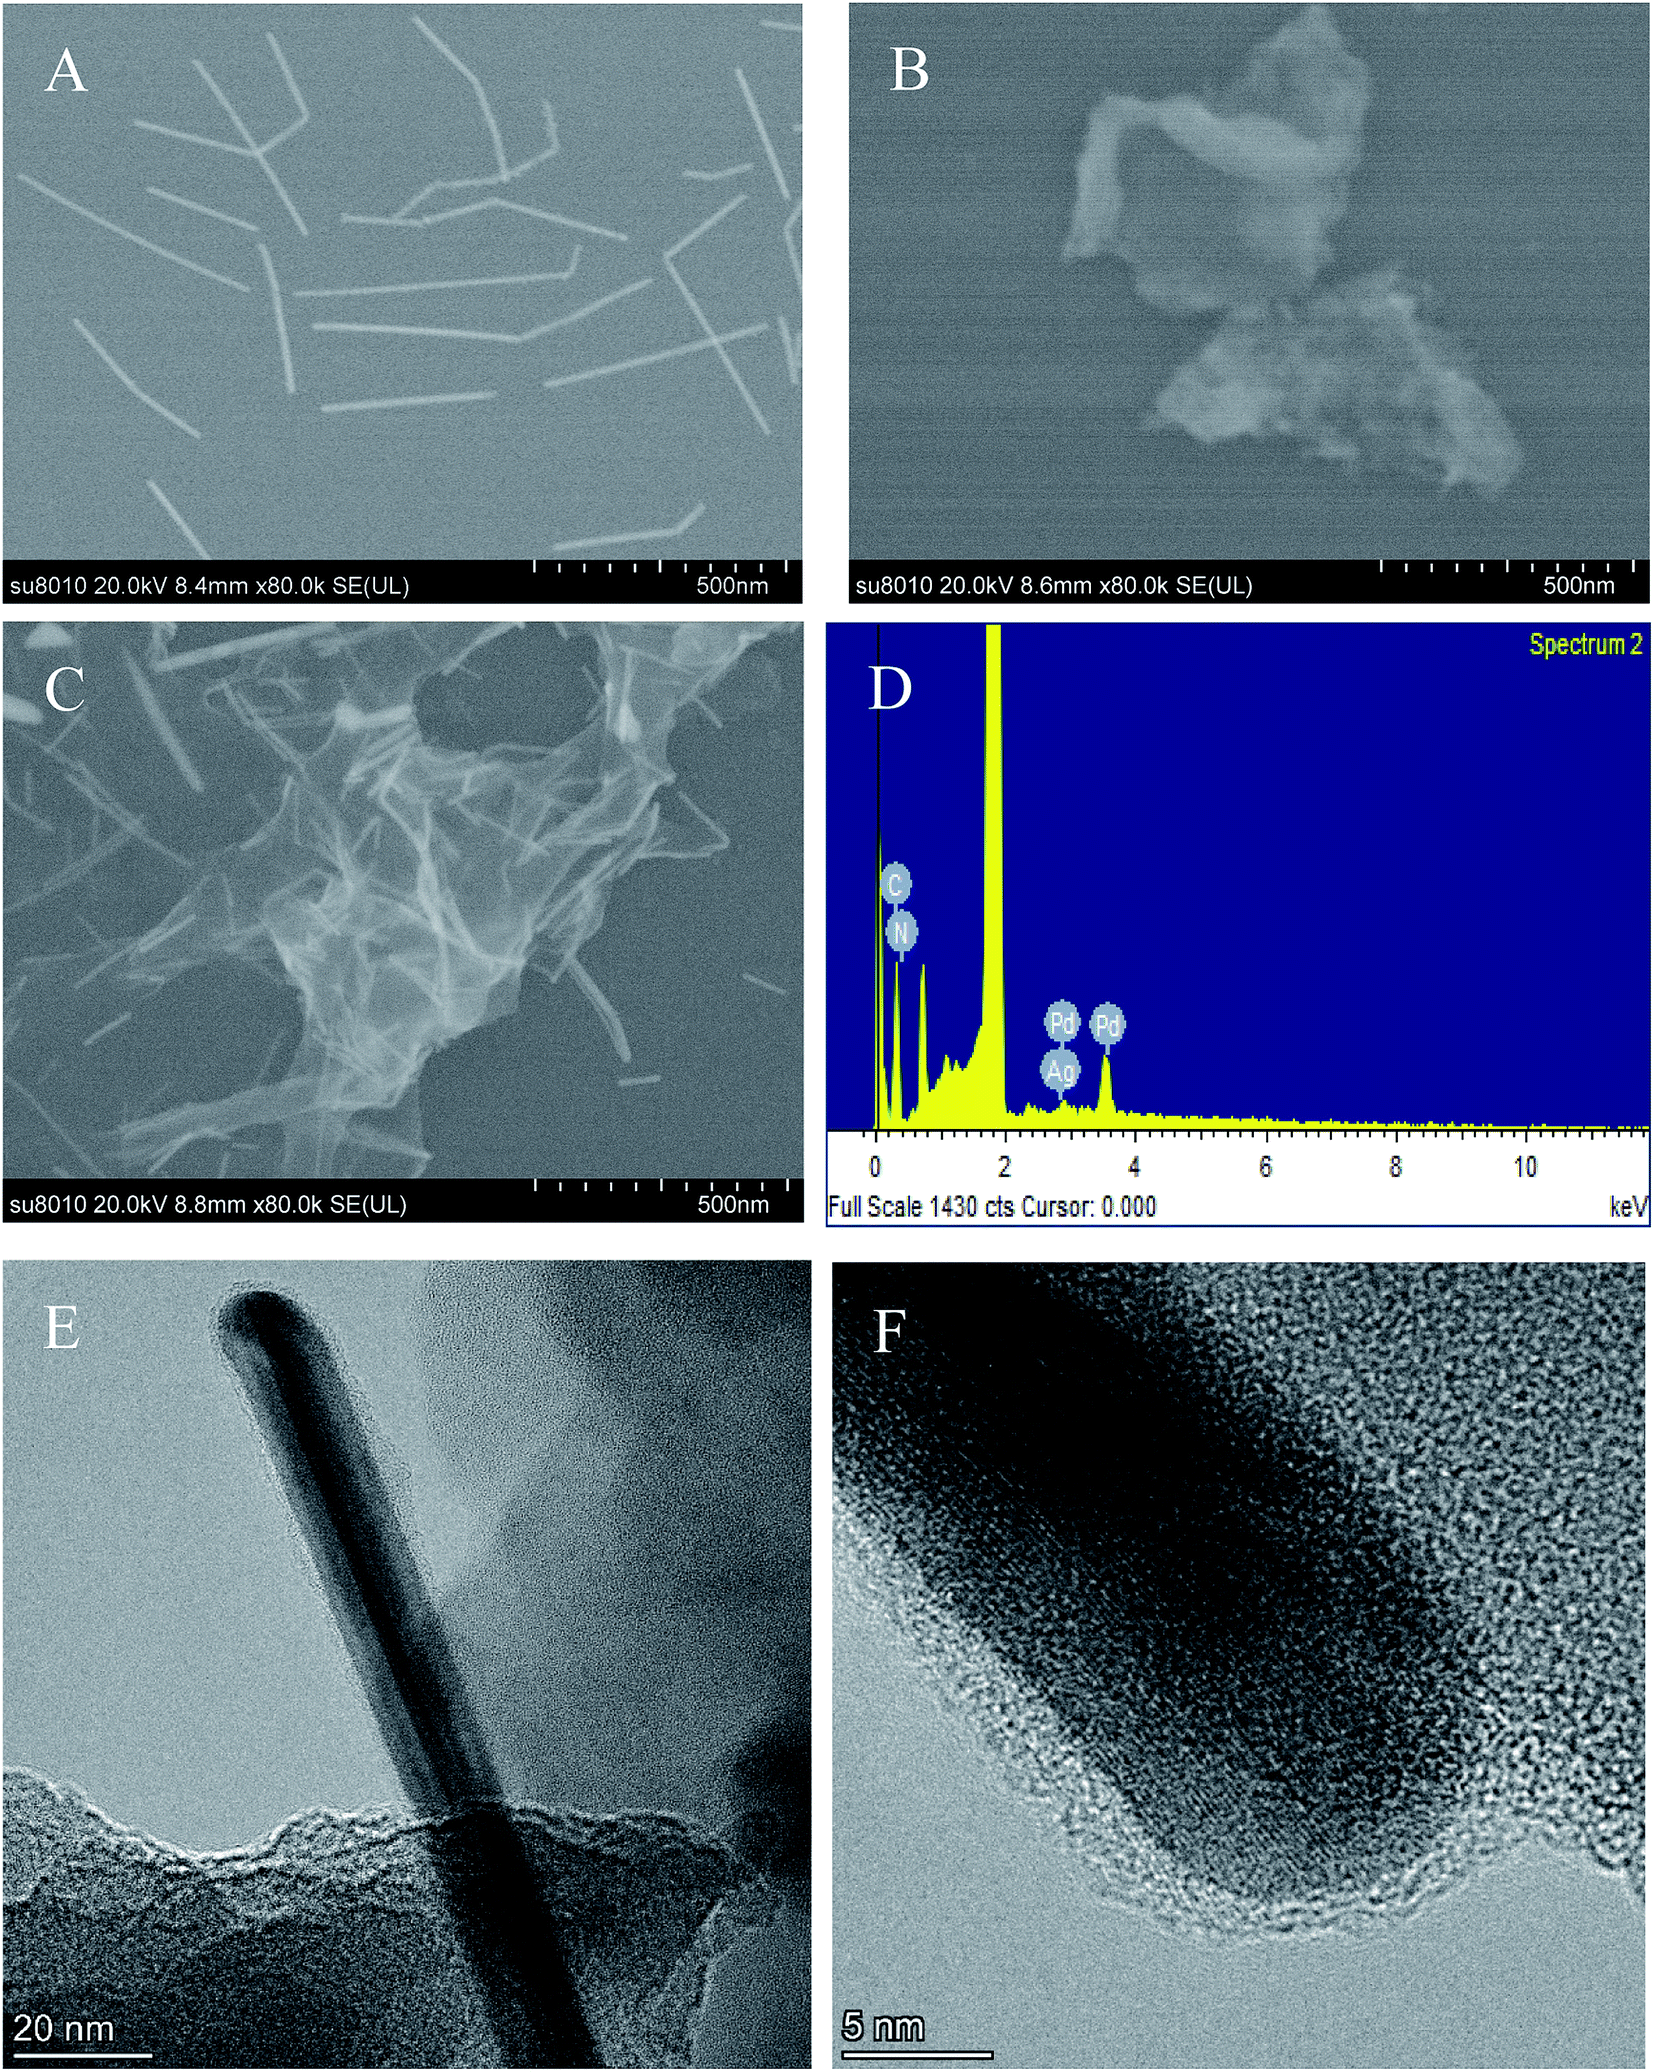
The morphologies of PdNWs, Ag-g-C3N4 NSs and PdNWs–Ag-g-C3N4 were characterized by SEM. The SEM images shown in Fig. 1A and B indicate that PdNWs have a nanowire-like structure and Ag-g-C3N4 NSs have a platelet-like structure. As expected, for PdNWs–Ag-g-C3N4 (Fig. 1C), both the layered structure and nanowire structure were clearly observed. And the PdNWs blended with Ag-g-C3N4 perfectly, indicating the successful preparation of PdNWs–Ag-g-C3N4 through the interaction between the amino groups from chitosan and PdNWs. The EDS spectrum of PdNWs–Ag-C3N4 is shown in Fig. 1D. The EDS spectrum of the PdNWs–Ag-C3N4 clearly showed the existence of Ag, C, N and Pd elements, also revealing the successful synthesis of PdNWs–Ag-C3N4. TEM and high resolution TEM were performed on the synthesized PdNWs–Ag-C3N4 nanocomposite to obtain information on the size and lattice structure of PdNWs. As seen from Fig. 1E and F, a typical Ag-C3N4 morphology of small thin nanosheets with wrinkles and an irregular shape and a typical PdNW morphology of nanowires were both observed, which was in accordance with previous literature.31
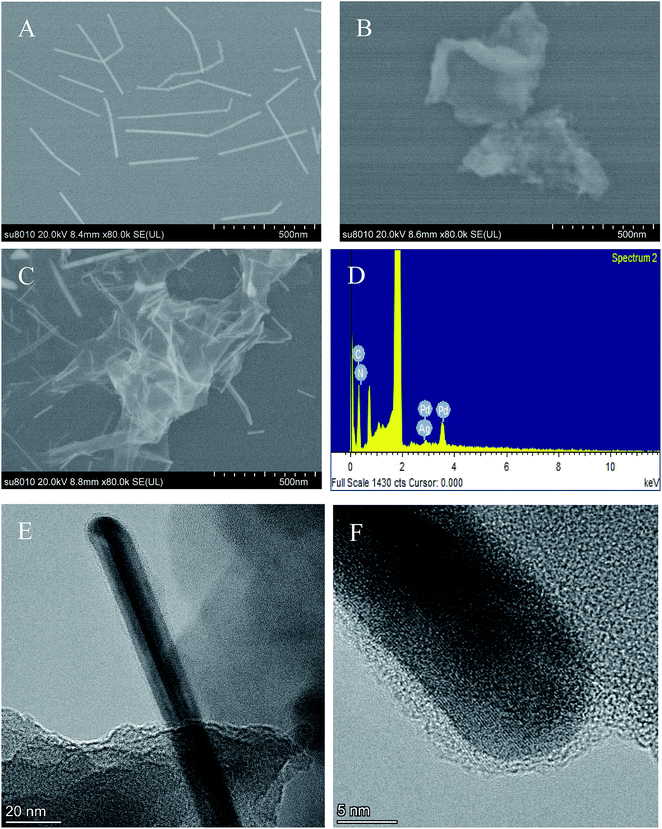 |
| | Fig. 1 SEM images of (A) PdNWs, (B) Ag-g-C3N4, (C) PdNWs–Ag-g-C3N4, and the EDS spectrum of (D) PdNWs–Ag-g-C3N4. Typical TEM image (E) and the HRTEM image (F) of PdNWs–Ag-g-C3N4. | |
In order to further prove the successful synthesis of PdNWs–Ag-g-C3N4, XPS was used for elemental analysis. As expected, characteristic peaks for Pd 3d, Ag 3d, C 1s and N 1s core-level regions are clearly observed in the survey spectrum of PdNWs–Ag-g-C3N4 (Fig. 2A). Fig. 2B presents the XPS signature of the Ag 3d5/2 and Ag 3d3/2 peaks, separately located at 367.48 and 373.48 eV. And the Pd 3d3/2 and Pd 3d5/2 peaks are respectively located at 339.98 eV and 334.58 eV, as seen in Fig. 2C. The peaks at 287.88 eV and 284.78 eV assigned to C 1s, and 398.48 eV assigned to N 1s are respectively observed in Fig. 3D–E. XPS results confirm the successful preparation of PdNWs–Ag-g-C3N4.
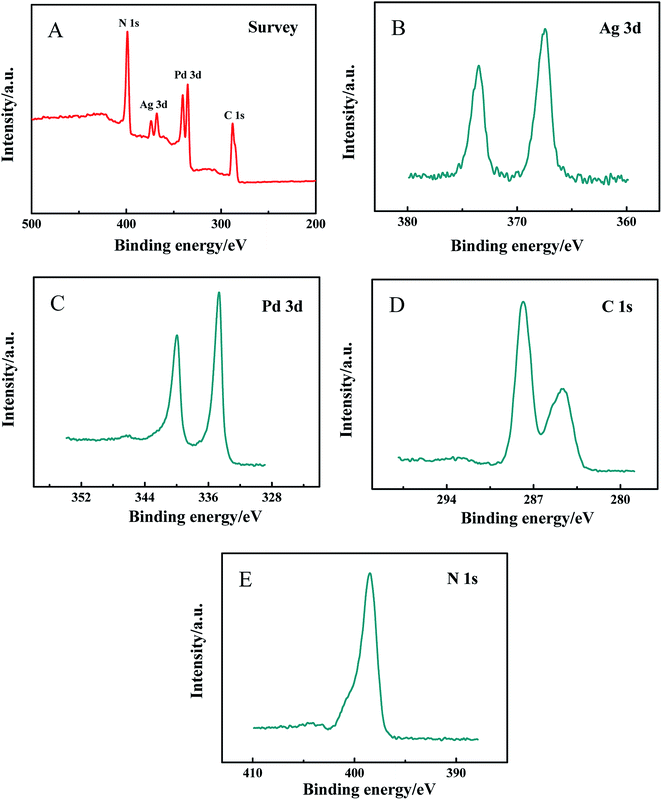 |
| | Fig. 2 XPS spectra of the (A) full region for PdNWs–Ag-g-C3N4, (B) Ag 3d region, (C) Pd 3d region, (D) C 1s region and (E) N 1s region. | |
 |
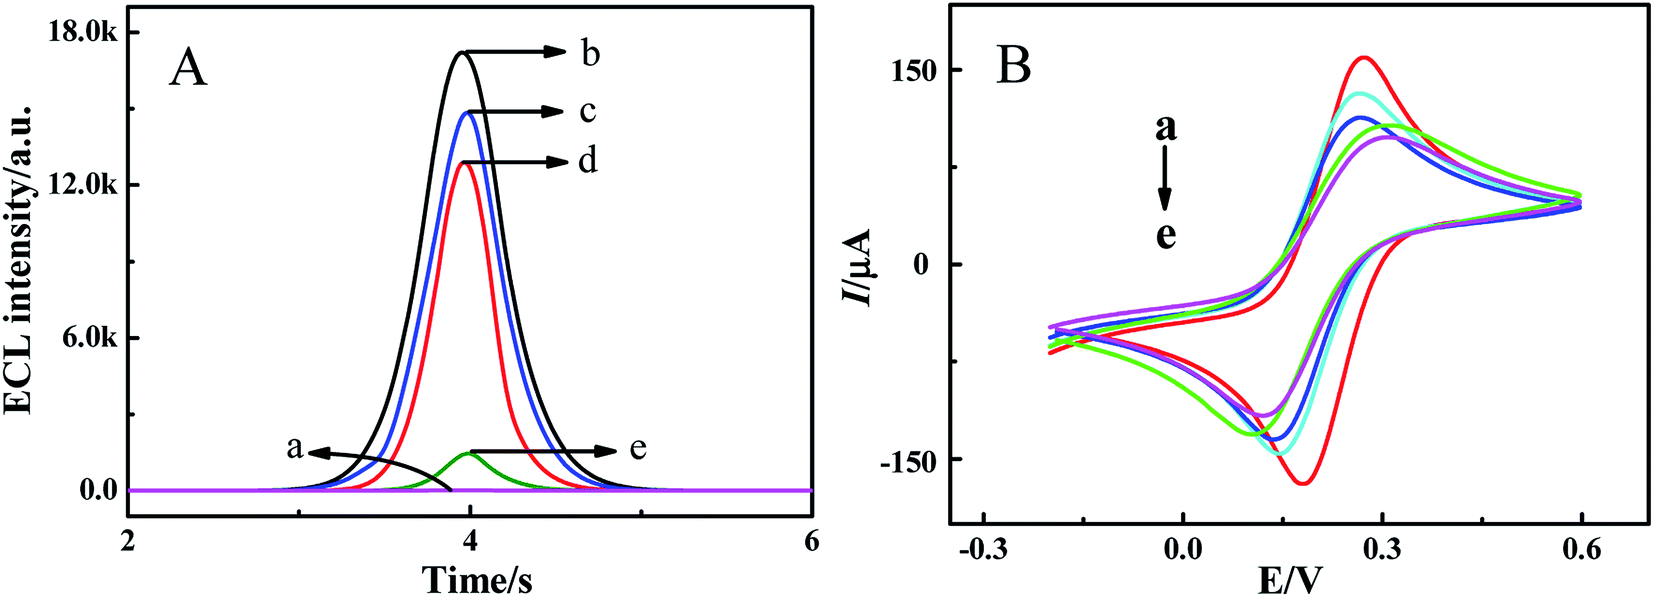
| | Fig. 3 (A) ECL responses in PBS (pH 7.4) containing 0.10 M K2S2O8 and (B) CVs in 5.0 mM K3[Fe(CN)6]/K4[Fe(CN)6] at the bare GCE (a), PdNWs–Ag-g-C3N4/GCE (b), DexP/PdNWs–Ag-g-C3N4/GCE (c), Tween20/DexP/PdNWs–Ag-g-C3N4/GCE (d), and ConA/Tween20/DexP/PdNWs–Ag-g-C3N4/GCE (e). Scan rate of 300 mV s−1 for ECL and 100 mV s−1 for CV measurements. | |
3.2. ECL and CV characterization of the sensor
As shown in Fig. 3A, the bare GCE in 0.1 M K2S2O8 solution produced a low ECL intensity (curve a). When the PdNWs–Ag-g-C3N4 was modified onto the surface of the GCE, a high ECL signal was obtained (curve b), indicating the successful immobilization of PdNWs–Ag-g-C3N4 on the electrode. The plots of ECL intensity versus the potential of PdNWs–Ag-C3N4 are provided in Fig. S2 of ESI.† From curves c to e, it is observed that the ECL intensity dropped sequentially with the successive modification of DexP, T20 and ConA onto the electrode, which was attributed to their non-electroactive properties hindering electron transfer.
The cyclic voltammograms (CVs) of different modified electrodes were recorded in 5.0 mM K3[Fe(CN)6]/K4[Fe(CN)6], and the results are displayed in Fig. 3B. A couple of quasi-reversible redox peaks of [Fe(CN)6]4−/3− were observed on the bare GCE (curve a). When the PdNWs–Ag-g-C3N4, DexP, T20 and ConA were successively modified onto the bare GCE (curves b–e), the redox peak currents continuously decreased due to the electron transmission insulation of PdNWs–Ag-g-C3N4, DexP, T20 and ConA.
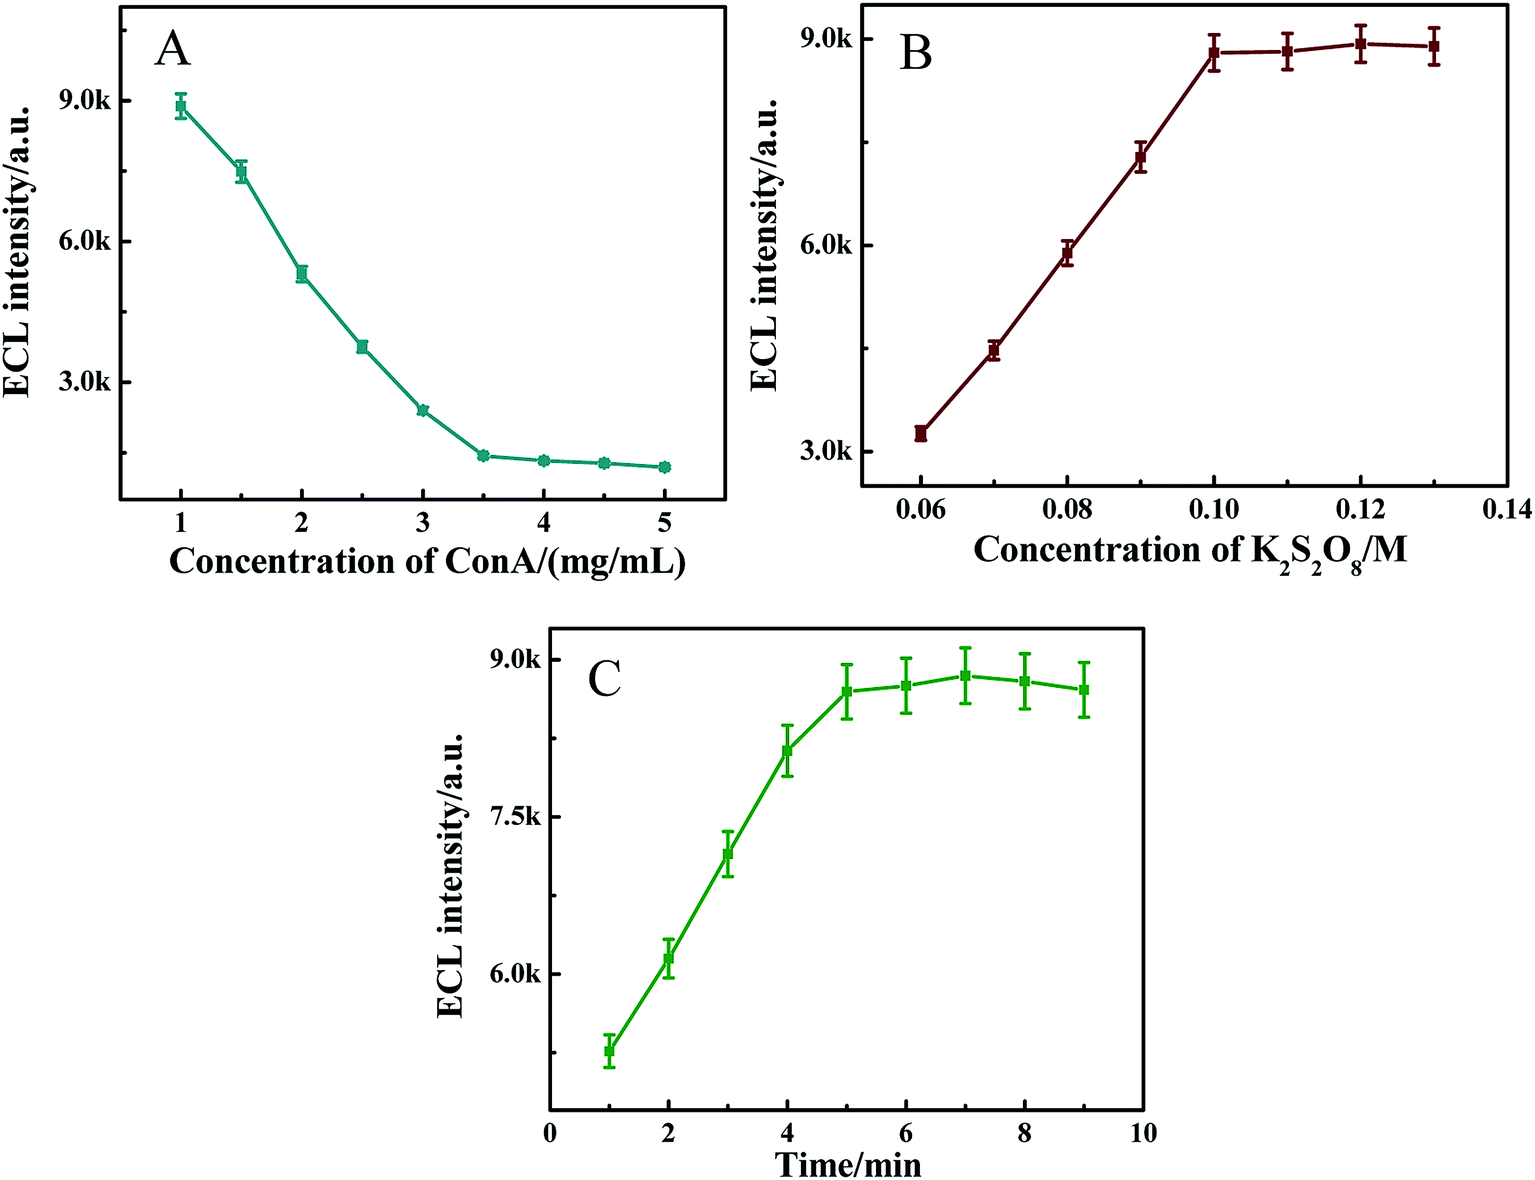
3.3. Optimization of measurement conditions
Among the factors influencing the performance of the biosensor, the concentration of ConA and K2S2O8, and the incubation time of glucose were important in this experiment. The effect of the concentration of ConA on the ECL emission of the modified electrode was investigated. As shown in Fig. 4A, with the concentration of ConA increasing from 1 to 3.5 mg mL−1, the ECL intensity decreased. When the concentration of ConA exceeded 3.5 mg mL−1, the intensity changed slowly, and thus the concentration of ConA was chosen as 3.5 mg mL−1.
 |
| | Fig. 4 (A) Effect of ConA concentration on the ECL responses in the presence of 0.10 M K2S2O8. (B) Effect of K2S2O8 concentration on the ECL responses. (C) Effect of incubation time on the ECL responses in PBS (pH 7.4) containing 0.10 M K2S2O8. Scan rate: 300 mV s−1. Scan voltage: −1.30–0.0 V. | |
Fig. 4B and C depict the influence of K2S2O8 concentration (0.06–0.13 M) and the influence of incubation time of glucose (1–9 min) on the ECL response of the sensor incubated with 2.0 × 10⁻⁸ M glucose respectively. As shown in Fig. 4B and C, the maximum ECL signal was obtained at 0.10 M K2S2O8 and 5 min of incubation time of glucose respectively. Taking into account the possible application of the sensor, 0.10 M K2S2O8 and 5 min of incubation time of glucose were selected in further experiments.
3.4. The ECL mechanism of the “on–off–on” switch system
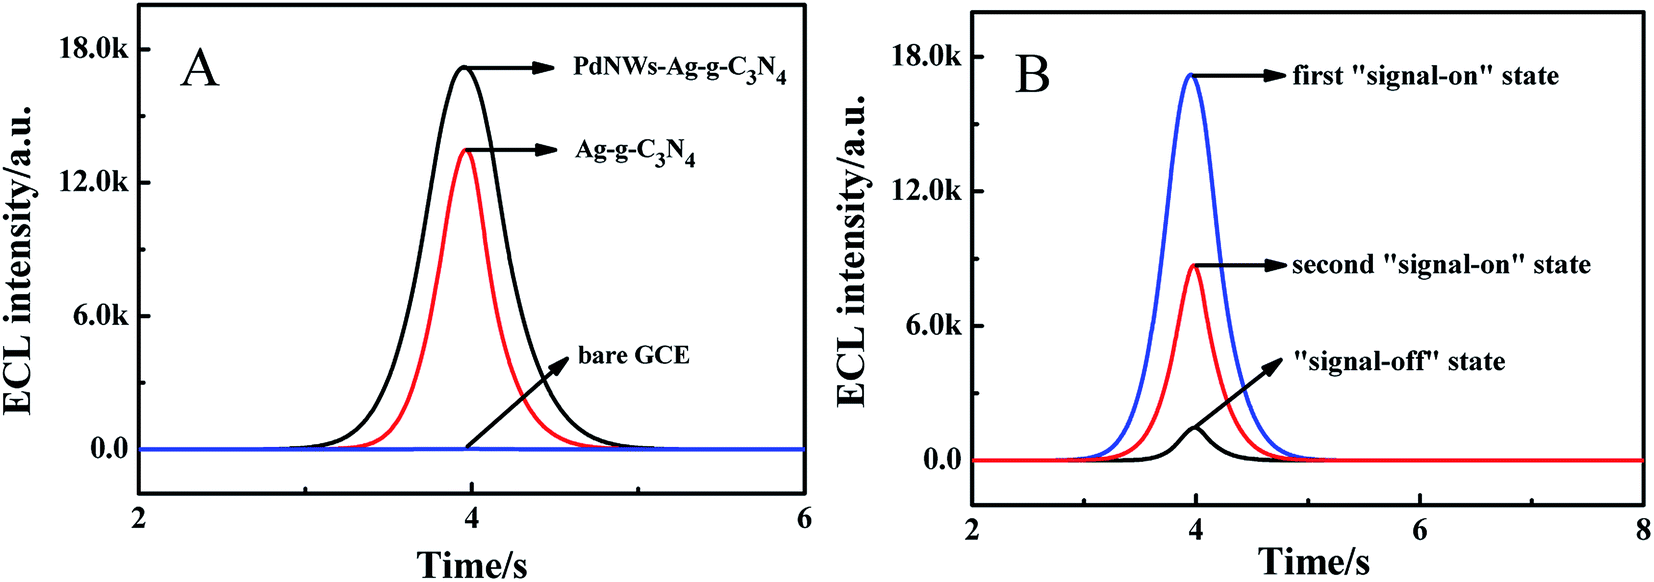
To confirm the function of PdNWs and Ag-g-C3N4 in this construction strategy, the effect of PdNWs and Ag-g-C3N4 on the ECL signal in 0.10 M K2S2O8 solution was investigated and the results are shown in Fig. 5A. As seen from Fig. 5A, compared with the bare electrode (blue curve), an obvious increase in ECL intensity by about 14365 a.u. was observed at the Ag-g-C3N4/GCE (red curve), indicating that Ag-g-C3N4 was a nice luminophore. The possible electrochemical reaction of Ag-g-C3N4 and co-reactant S2O82− on the electrode is as follows:33| | | Ag-g-C3N4 + e− → Ag-g-C3N4˙− | (1) |
| | | O2 + 2H2O + 2e− → 2H2O2 | (2) |
| | | OH˙ + Ag-g-C3N4˙− → Ag-g-C3N4* + OH− | (4) |
| | | S2O82− + e− → SO42− + SO4˙− | (5) |
| | | Ag-g-C3N4˙− + SO4˙− → Ag-g-C3N4* + SO42− | (6) |
and/or| | | Ag-g-C3N4 + SO4˙─ → Ag-g-C3N4+ + SO42− | (7) |
| | | Ag-g-C3N4+ + Ag-g-C3N4˙─ → Ag-g-C3N4* + Ag-g-C3N4 | (8) |
finally,| | | Ag-g-C3N4* → Ag-g-C3N4 + hν | (9) |
 |
| | Fig. 5 (A) The comparison of ECL responses at the biosensor with different nanomaterials: bare GCE (blue curve), Ag-g-C3N4/GCE (red curve), and (c) PdNWs–Ag-g-C3N4/GCE (black curve). (B) ECL responses of the “on–off–on” mechanism. | |
For the sensor incubated with the PdNWs–Ag-g-C3N4, the ECL emission reached 17292 a.u. (black curve), which was greater than that in the case of Ag-g-C3N4 (red curve), indicating a signal amplification role of PdNWs in this sensor. Such an increase might be due to the fact that PdNWs had good electroconductivity, which accelerated the electron transfer between S2O82− and the electron surface (Fig. S1†). Additionally, the large specific surface area of PdNWs–Ag-g-C3N4 served as the support to achieve a high loading of recognition element DexP on the PdNWs–Ag-g-C3N4 for binding ConA.
The PdNWs–Ag-g-C3N4 was employed to effectively improve the ECL intensity, achieving the first “signal-on” state in this work (Fig. 5B blue curve). When the resultant electrode was reacted with DexP and T20, the ECL response decreased. The “signal-off” state (black curve) was obtained by incubating ConA onto the electrode via the special binding between ConA and DexP, and the ECL signal reduced due to the non-electroactive properties hindering electron transfer. Finally, the modified electrode was immersed into the glucose solution, the glucose would compete with DexP for ConA binding sites due to the higher binding affinity of glucose for ConA than DexP, and thus ConA would be taken away from the electrode. Therefore, the hindering effect from ConA incubated on the electrode would be weakened, resulting in an increase in ECL intensity and achieving the second “signal-on” state (red curve).
3.5. Performance of the sensor
3.5.1. Calibration curve.
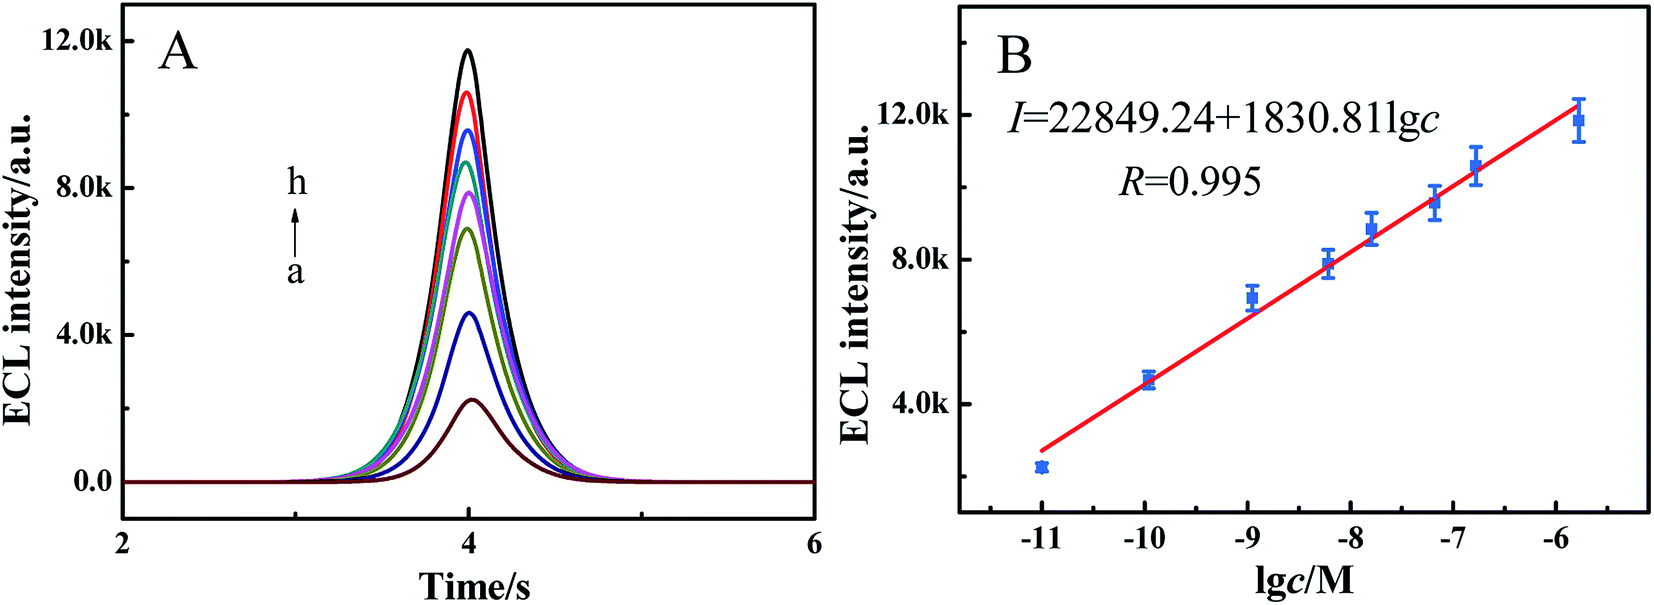
The quantitative measurements of glucose were performed by using the proposed sensor under optimal conditions in the “on–off–on” mode. As illustrated in Fig. 6, the ECL signal increased with the increase of glucose concentrations from 1.0 × 10⁻¹¹ M to 1.67 × 10⁻⁶ M (Fig. 6A, curves a–h), and the IECL exhibited a brilliant correlation with the logarithmic value of glucose concentration (lgc) (Fig. 6B). The regression equation was I = 22849.24 + 1830.81 lg c with an R value of 0.995. Additionally, the limit of detection (LOD) was calculated to be 3.0 × 10⁻¹² M (S/N = 3). Compared to other reported sensors listed in Table 1, the developed ECL sensor exhibited high sensitivity for glucose determination with a relatively low LOD. In this work, our prepared sensor indeed exhibited a high sensitivity and wide linearity, which may be ascribed to the combination of the high ECL efficiency of PdNWs–Ag-g-C3N4 and the competitive binding reaction of the glucose–ConA–dextran system. The reasonable explanation is as follows. First, the ECL technique itself exhibited a high sensitivity. Second, Ag-g-C3N4 itself exhibited an excellent ECL behavior and can generate a strong ECL intensity at cathodic potentials. With introducing PdNWs into the Ag-g-C3N4, a higher initial intensity was achieved. Third, the competitive binding reaction of the glucose–ConA–dextran system may provide the proposed sensor with excellent performance.34
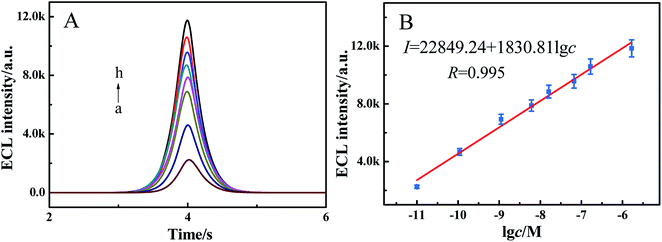 |
| | Fig. 6 (A) ECL responses of the sensor to 1.0 × 10⁻¹¹ (a), 1.1 × 10⁻¹⁰ (b), 1.11 × 10⁻⁹ (c), 6.11 × 10⁻⁹ (d), 1.61 × 10⁻⁸ (e), 6.61 × 10⁻⁸ (f), 1.66 × 10⁻⁷ (g) and 1.67 × 10⁻⁶ (h) glucose in PBS (pH 7.4) containing 0.10 M K2S2O8. Scan rate: 300 mV s−1. Scan voltage: −1.30–0.0 V. (B) The linear calibration curve. | |
Table 1 Comparison of different glucose sensors
| Electrode |
Methods |
Linear range/M |
Detection limit/M |
Ref. |
|
SWNTs: single-walled carbon nanotubes.
GE: gold electrode.
GO: graphene oxide.
Att: attapulgite.
GOx: glucose oxidase.
CdS: cadmium sulfide.
|
| ConA/DexP/SWNTsa/GEb |
Chemiresist |
1.0 × 10⁻¹²—1.0 × 10⁻⁹ |
— |
34
|
| ConA/DexP/GOc/GCE |
EIS |
5.0 × 10⁻⁶—9.0 × 10⁻³ |
3.4 × 10⁻⁷ |
35
|
| Attd-TiO2/GCE |
ECL |
1.0 × 10⁻⁹—1.0 × 10⁻³ |
1.0 × 10⁻¹¹ |
36
|
| GOxe/CdSf/GCE |
ECL |
4.0 × 10⁻¹³—4.0 × 10⁻¹⁰ |
2.0 × 10⁻¹³ |
37
|
| ConA/DexP/PdNWs- Ag-g-C3N4/GCE |
ECL |
1.0 × 10⁻¹¹—1.67 × 10⁻⁶ |
3.0 × 10⁻¹² |
This work |
3.5.2. Stability and selectivity of the sensor.
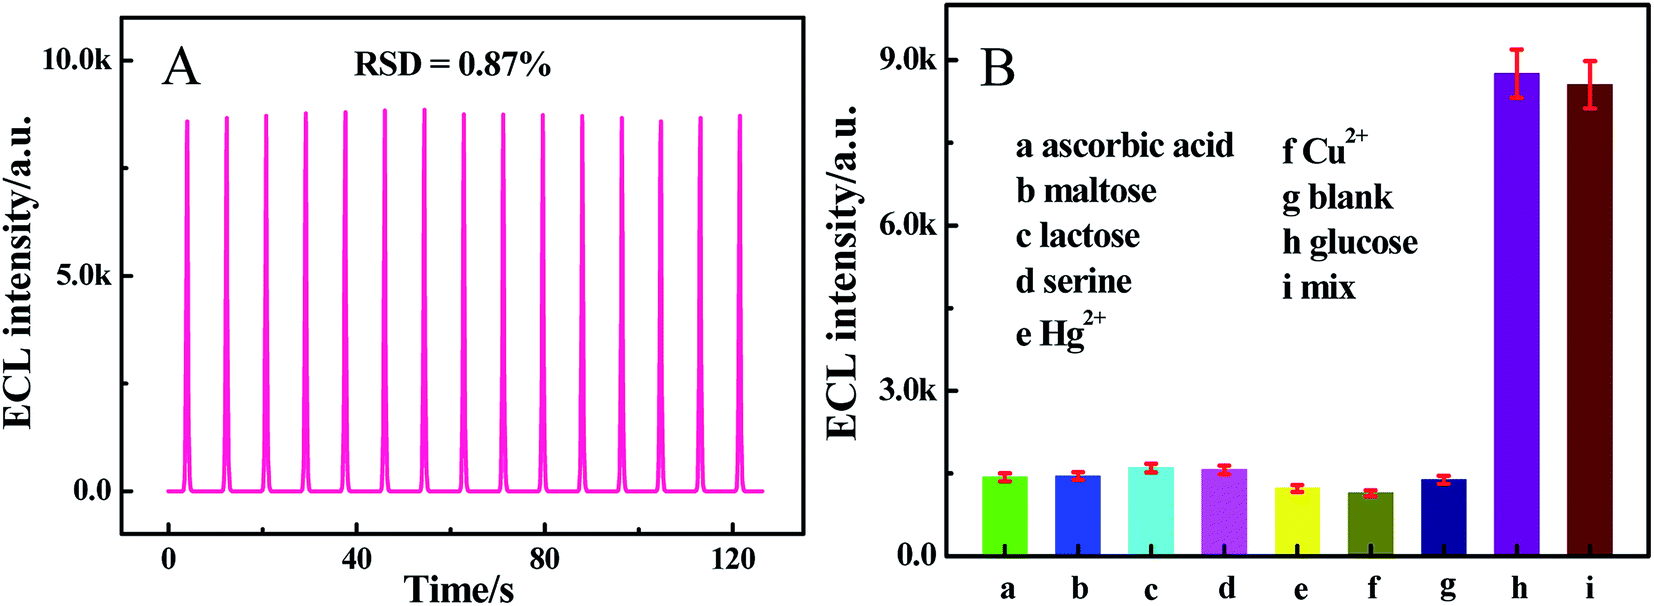
The stability of the sensor under consecutive cyclic potential scans was evaluated in the presence of 2.0 × 10⁻⁸ M glucose. As seen from Fig. 7A, after consecutive cyclic scans for 15 cycles, the ECL signal revealed inconspicuous undulation with a relative standard deviation (RSD) of 0.87%, showing a nice stability of the sensor. Additionally, Fig. S3† shows the long-term storage stability of our proposed sensor. The ECL response of the sensor towards 2.0 × 10⁻⁸ M glucose was tested every day. After 12 days, the ECL intensity decreased 15.2%, demonstrating that the sensor possessed good stability.
 |
| | Fig. 7 (A) Operational stability of the sensor incubated with 2.0 × 10⁻⁸ M glucose in PBS (pH 7.4) containing 0.10 M K2S2O8. (B) The ECL response of the sensor to different samples: (a) ascorbic acid (0.10 mM), (b) maltose (0.10 μM), (c) lactose (0.10 μM), (d) serine (1.0 mg mL−1), (e) Hg2+ (0.10 μM), (f) Cu2+ (0.10 μM), (g) blank, (h) glucose (2.0 × 10⁻⁸ M) and (i) a mixture containing the above samples. | |
In addition, ascorbic acid (0.10 mM), maltose (0.10 μM), lactose (0.10 μM), serine (1.0 mg mL−1), Hg2+ (0.10 μM) and Cu2+ (0.10 μM) acting as interfering substances were used for evaluating the selectivity of the sensor in glucose determination. According to Fig. 7B, a low ECL signal was observed when incubated with ascorbic acid, dopamine, uric acid, maltose, lactose and serine, respectively, which showed little fluctuations compared with the blank experiment, while the target 2.0 × 10⁻⁸ M glucose and the mixture containing the above interfering substances and 2.0 × 10⁻⁸ M glucose showed significant ECL signals. The results above verified that ascorbic acid, dopamine, uric acid, maltose, lactose and serine cannot cause interference to the proposed sensor, indicating an outstanding specificity of the sensor.
3.5.3. Application of the sensor.
The application potential of the sensor was determined by standard addition methods in bovine serum albumin. The results are shown in Table 2 and the recoveries ranged from 91.3% to 108%, which verified the outstanding analysis accuracy and promising application potential of this ECL sensor.
Table 2 Recoveries of glucose by the biosensor in bovine serum albumin samples
| Samples |
Added (mol L−1) |
Founda (mol L−1) |
Recovery (%) |
|
Average of three determinations ± SD, n = 3.
|
| 1 |
1.00 × 10⁻⁹ |
9.13 × 10⁻¹⁰ ± 8.68 × 10⁻¹¹ |
91.3 |
| 2 |
1.00 × 10⁻⁸ |
9.43 × 10⁻⁹ ± 1.48 × 10⁻⁹ |
94.3 |
| 3 |
1.00 × 10⁻⁷ |
1.08 × 10⁻⁷ ± 1.70 × 10⁻⁸ |
108 |
4. Conclusions
In conclusion, we designed a novel ECL sensor for ultrasensitive detection of glucose. Compared with conventional glucose detection methods, the proposed ECL sensor exhibited its own advantages. First, it could be expediently constructed by a simple “on–off–of” strategy. Second, it combined the advantages of the PdNWs–Ag-g-C3N4 hybrid and the competition reaction between glucose and dextran for ConA binding sites. Third, it improved the detection sensitivity with a relatively low LOD. With these advantages, the proposed “on–off–on” strategy could be utilized as a versatile and effective method for detection of other targets.
Conflicts of interest
There are no conflicts to declare.
Acknowledgements
This work was financially supported by the NNSF of China (Grant no. 81603242) and the Discipline Talent Promotion Program of “Xinglin Scholars” of Chengdu University of TCM (Grant no. ZRQN2018012).
References
- J. Wang, P. N. Zhang, Y. J. Xiahou, D. Y. Wang, H. B. Xia and H. Möhwald, Simple synthesis of Au-Pd alloy nanowire networks as macroscopic, flexible electrocatalysts with excellent performance, ACS Appl. Mater. Interfaces, 2018, 10, 602–613 CrossRef CAS.
- C. Koenigsmann and S. S. Wong, Tailoring chemical composition to achieve enhanced methanol oxidation reaction and methanol-tolerant oxygen reduction reaction performance in palladium-based nanowire systems, ACS Catal., 2013, 3, 2031–2040 CrossRef CAS.
- J. H. Shim, J. Kim, C. Lee and Y. Lee, Porous Pd layer-coated Au nanoparticles supported on carbon: synthesis and electrocatalytic activity for oxygen reduction in acid media, Chem. Mater., 2011, 23, 4694–4700 CrossRef CAS.
- T. Yuan, H. Y. Chen, X. H. Ma, J. J. Feng, P. X. Yuan and A. J. Wang, Simple synthesis of self-supported hierarchical AuPd alloyed nanowire networks for boosting electrocatalytic activity toward formic acid oxidation, J. Colloid Interface Sci., 2018, 513, 324–330 CrossRef CAS.
- L. F. Zhang, S. L. Zhong and A. W. Xu, Highly branched concave Au/Pd bimetallic nanocrystals with superior electrocatalytic activity and highly efficient SERS enhancement, Angew. Chem., Int. Ed., 2013, 52, 645–649 CrossRef CAS.
- M. K. Debe, Electrocatalyst approaches and challenges for automotive fuel cells, Nature, 2012, 486, 43–51 CrossRef CAS.
- X. Q. Zeng, M. L. Latimer, Z. L. Xiao, S. Panuganti, U. Welp, W. K. Kwok and T. Xu, Hydrogen gas sensing with networks of ultrasmall palladium nanowires formed on filtration membranes, Nano Lett., 2011, 11, 262–268 CrossRef CAS.
- L. L. Wei, R. Gu and J. M. Lee, Highly efficient reduction of hexavalent chromium on amino-functionalized palladium nanowires, Appl. Catal., B, 2015, 176, 325–330 CrossRef.
- X. Y. Yang, J. Quan, S. Y. Liu and F. S. Liu, The release behavior of helium in palladium nanowire: A molecular dynamics study, Comput. Mater. Sci., 2016, 111, 190–196 CrossRef CAS.
- Y. F. He, J. T. Feng, Y. Y. Du and D. Q. Li, Controllable synthesis and acetylene hydrogenation performance of supported Pd nanowire and cuboctahedron catalysts, ACS Catal., 2012, 2, 1703–1710 CrossRef CAS.
- Y. J. Song, R. M. Garcia, R. M. Dorin, H. R. Wang, Y. Qiu, E. N. Coker, W. A. Steen, J. E. Miller and J. A. Shelnutt, Synthesis of platinum nanowire networks using a soft template, Nano Lett., 2007, 7, 3650–3655 CrossRef CAS.
- Y. S. Kim, H. J. Kim and W. B. Kim, Composited hybrid electrocatalysts of Pt-based nanoparticles and nanowires for low temperature polymer electrolyte fuel cells, Electrochem. Commun., 2009, 11, 1026–1029 CrossRef CAS.
- S. Sun, F. Jaouen and J. P. Dodelet, Controlled growth of Pt nanowires on carbon nanospheres and their enhanced performance as electrocatalysts in PEM fuel cells, Adv. Mater., 2008, 20, 3900–3904 CrossRef CAS.
- J. H. Luo, Q. Li, S. H. Chen and R. Yuan, Coreactant-free dual amplified electrochemiluminescent biosensor based on conjugated polymer dots for the ultrasensitive detection of microRNA, ACS Appl. Mater. Interfaces, 2019, 11, 27363–27370 CrossRef CAS.
- C. Zhang, Y. Fan, H. Zhang, S. H. Chen and R. Yuan, An ultrasensitive signal-on electrochemiluminescence biosensor based on Au nanoclusters for detecting acetylthiocholine, Anal. Bioanal. Chem., 2019, 411, 905–913 CrossRef CAS PubMed.
- H. J. Wang, Y. L. Yuan, Y. Q. Chai and R. Yuan, Self-enhanced electrochemiluminescence immunosensor based on nanowires obtained by a green approach, Biosens. Bioelectron., 2015, 68, 72–77 CrossRef CAS PubMed.
- P. Y. Ran, S. Zhu, J. Y. Song, J. L. Wu, F. J. Mo and Y. Z. Fu, A widened emission window of the peroxydisulfate-oxygen system for the detection of L-alanine, Colloids Surf., B, 2018, 169, 418–421 CrossRef CAS PubMed.
- C. Ye, M. Q. Wang, X. Zhong, S. H. Chen, Y. Q. Chai and R. Yuan, Highly sensitive electrochemiluminescence assay of acetylcholinesterase activity based on dual biomarkers using Pd-Au nanowires as immobilization platform, Biosens. Bioelectron., 2016, 79, 34–40 CrossRef CAS.
- Y. Zhuo, H. Wang, Y. Lei, P. Zhang, J. Liu, Y. Chai and R. Yuan, Electrochemiluminescence biosensing based on different modes of switching signal, Analyst, 2018, 3230–3248 RSC.
- X. J. Du, D. Jiang, N. Hao, Q. Liu, J. Qian, L. M. Dai, H. P. Maoa and K. Wang, An ON1–OFF–ON2 electrochemiluminescence response: combining the intermolecular specific binding with a radical scavenger, Chem. Commun., 2015, 51, 11236–11239 RSC.
- Y. Zhou, H. J. Wang, Y. Zhuo, Y. Q. Chai and R. Yuan, A highly-efficient electrochemiluminescent Ag nanoclusters/TiO2 nanomaterials as signal probe for ferrocene-driven light switch bioanalysis, Anal. Chem., 2017, 89, 3732–3738 CrossRef CAS.
- Y. M. Lei, M. Zhao, A. Wang, Y. Q. Yu, Y. Q. Chai, R. Yuan and Y. Zhuo, Electrochemiluminescence of supramolecular nanorods and their application in the “on-off-on” detection of copper ions, Chem.–Eur. J., 2016, 22, 8207–8214 CrossRef CAS.
- M. Zhao, Y. Zhuo, Y. Q. Chai and R. Yuan, Au nanoparticles decorated C60 nanoparticle-based label-free electrochemiluminesence aptasensor via a novel “on–off–on” switch system, Biomaterials, 2015, 52, 476–483 CrossRef CAS.
- H. F. Xu, S. J. Liang, X. Zhu, X. Q. Wu, Y. Q. Dong, H. S. Wu, W. X. Zhang and Y. W. Chi, Enhanced electrogenerated chemiluminescence behavior of C3N4 QDs@C3N4 nanosheet and its signal-on aptasensing for platelet derived growth factor, Biosens. Bioelectron., 2017, 92, 695–701 CrossRef CAS.
- H. F. Sha, Y. Zhang, Y. F. Wang, H. Ke, X. Xiong and N. Q. Jia, Electrochemiluminescence resonance energy transfer biosensor between the glucose functionalized MnO2 and g-C3N4 nanocomposites for ultrasensitive detection of concanavalin A, Biosens. Bioelectron., 2019, 124, 59–65 CrossRef PubMed.
- X. D. Zhang, X. Xie, H. Wang, J. J. Zhang, B. C. Pan and Y. Xie, Enhanced Photoresponsive Ultrathin Graphitic-Phase C3N4 Nanosheets for Bioimaging, J. Am. Chem. Soc., 2013, 135, 18–21 CrossRef CAS PubMed.
- X. L. Fu, F. Hou, F. R. Liu, S. W. Ren, J. T. Cao and Y. M. Liu, Electrochemiluminescence energy resonance transfer in 2D/2D heterostructured g-C3N4/MnO2 for glutathione detection, Biosens. Bioelectron., 2019, 129, 72–78 CrossRef CAS PubMed.
- Y. F. Wang, W. W. Guo and N. Q. Jia, High-sensitivity electrochemiluminescence biosensor based on silver-carbon nitride for the detection of dopamine utilizing enhancement effects, ChemElectroChem, 2018, 5, 1–8 CrossRef.
- R. P. Liang, L. D. Yu, Y. J. Tong, S. H. Wen, S. P. Cao and J. D. Qiu, An ultratrace assay of arsenite based on the synergistic quenching effect of Ru(bpy)32+ and arsenite on the electrochemiluminescence of Au-g-C3N4 nanosheets, Chem. Commun., 2018, 54, 14001–14004 RSC.
- R. F. Zhu, Y. H. Zhang, X. Fang, X. Q. Cui, J. Wang, C. C. Yue, W. H. Fang, H. Zhao and Z. X. Li, In situ sulfur-doped graphitic-like carbon nitride nanosheets with enhanced electrogenerated chemiluminescence and used for sensitive and selective sensing of L-cysteine, J. Mater. Chem. B, 2019, 7, 2320–2329 RSC.
- S. W. Hu, L. W. Yang, Y. Tian, X. L. Wei, J. W. Ding, J. X. Zhong and P. K. Chu, Simultaneous nanostructure and heterojunction engineering of graphitic carbon nitride via in situ Ag doping for enhanced photoelectrochemical activity, Appl. Catal., B, 2015, 163, 611–622 CrossRef CAS.
- P. W. Barone and M. S. Strano, Reversible control of carbon nanotube aggregation for a glucose affinity sensor, Angew. Chem., Int. Ed., 2006, 45, 8138–8141 CrossRef CAS PubMed.
- Y. Fan, X. R. Tan, X. Ou, Q. Y. Lu, S. H. Chen and S. P. Wei, A novel “on-off” electrochemiluminescence sensor for the detection of concanavalin A based on Ag-doped g-C3N4, Electrochim. Acta, 2016, 202, 90–99 CrossRef CAS.
- L. N. Cella, W. Chen, N. V. Myung and A. Mulchandani, Single-walled carbon nanotube-based chemiresistive affinity biosensors for small molecules: ultrasensitive glucose detection, J. Am. Chem. Soc., 2010, 132, 5024–5026 CrossRef CAS PubMed.
- J. Huang, L. Zhang, R. P. Liang and J. D. Qiu, “On-off” switchable electrochemical affinity nanobiosensor based on graphene oxide for ultrasensitive glucose sensing, Biosens. Bioelectron., 2013, 41, 430–435 CrossRef CAS PubMed.
- Y. Z. Wang, H. Zhong, X. R. Li, G. Q. Liu, K. Yang, M. Ma, L. L. Zhang, J. Z. Yin, Z. P. Cheng and J. K. Wang, Nonenzymatic electrochemiluminescence glucose sensor based on quenching effect on luminol using attapulgite-TiO2, Sens. Actuators, B, 2016, 230, 449–455 CrossRef CAS.
- B. Qiu, M. Miao, L. S. She, X. F. Jiang, Z. Y. Lin and G. N. Chen, An ultrasensitive biosensor for glucose based on solidstate electrochemiluminescence on GOx/CdS/GCE electrode, Anal. Methods, 2013, 5, 1941–1945 RSC.
Footnote |
| † Electronic supplementary information (ESI) available. See DOI: 10.1039/c9ay02357g |
|
| This journal is © The Royal Society of Chemistry 2020 |
Click here to see how this site uses Cookies. View our privacy policy here. 
 b,
Shaping
Wei
b,
Jinlin
Guo
b,
Shaping
Wei
b,
Jinlin
Guo