 Open Access Article
Creative Commons Attribution 3.0 Unported Licence
Analyzing glycans cleaved from a biotherapeutic protein using ultrahigh-resolution ion mobility spectrometry together with cryogenic ion spectroscopy†
Natalia
Yalovenko
a,
Vasyl
Yatsyna
 ab,
Priyanka
Bansal
a,
Ali H.
AbiKhodr
a and
Thomas R.
Rizzo
 *a
*a
aLaboratoire de Chimie Physique Moléculaire, École Polytechnique Fédérale de Lausanne, EPFL SB ISIC LCPM, Station 6, CH-1015 Lausanne, Switzerland. E-mail: thomas.rizzo@epfl.ch
bUniversity of Gothenburg, Department of Physics, 412 96 Gotheburg, Sweden
First published on 4th August 2020
Abstract
Glycans covalently attached to protein biotherapeutics have a significant impact on their biological activity, clearance, and safety. As a result, glycosylation is categorized as a critical quality attribute that needs an adequate analytical approach to guarantee product quality. However, the isomeric complexity and branched structure of glycans makes their analysis a significant challenge. In this work, we propose a multidimensional approach for monitoring released glycans that combines ultrahigh-resolution ion mobility spectrometry (IMS) and cryogenic vibrational spectroscopy, and we demonstrate this technique by characterizing four N-glycans cleaved from the therapeutic fusion protein etanercept that range in abundance from 1% to 22% of the total N-glycan content. The recorded vibrational spectra exhibit well-resolved transitions that can be used as a fingerprint to identify a particular glycan. This work represents an important advance in the analysis of N-linked glycans cleaved from biopharmaceutical proteins that could eventually be used as tool for monitoring biopharmaceutical glycoforms.
Introduction
Protein-based biotherapeutics have become an increasingly important class of drugs. The vast majority of therapeutic proteins on the market are glycoproteins, which have glycans attached as post-translational modifications.1 Glycosylation of a therapeutic protein is considered a critical quality attribute that affects its bioactivity, efficacy, solubility, stability, pharmacokinetics, pharmacodynamics, and immunogenicity.2 It is therefore essential to analyze glycoforms for monitoring the batch-to-batch consistency in production and for comparing biosimilars to their originator biologics.1,3N-Glycans are covalently attached to the nitrogen atom of specific asparagine residues on the protein by an N-glycosidic bond.4 They share a conserved pentasaccharide core formed by three mannose (Man) and two N-acetylglucosamine (GlcNAc) sugars. Additional monosaccharides such as fucose (Fuc), galactose (Gal), and mannose are typically linked to the core structure, generating an enormous variety of N-glycans and resulting in a heterogenous population of protein glycoforms. The intrinsic isomeric complexity of glycans poses a daunting challenge for analytical techniques.1,5 Over the years, numerous approaches have been established to characterize N-glycans cleaved from glycoproteins. Mass spectrometry (MS)-based strategies are widely used in glycan analysis because of their speed and sensitivity,6–9 and various kinds of chromatographic, electrophoretic, and ion mobility (IM) separations are often employed in combination with MS to more fully resolve different isomeric forms.6,10–17
Recently, spectroscopy-based methods have been combined with MS to tackle the issue of glycan identification.18–28 For relatively large and complex molecules such as N-linked glycans, cryogenic spectroscopy is best suited to distinguishing the subtle structural differences between isomers.21–29 Because vibrational spectra reflect intrinsic molecular properties of a molecule, they are insensitive to the range of experimental conditions that might be encountered in different laboratories.26
In this work, we combine ultrahigh-resolution ion mobility spectrometry and cryogenic, vibrational spectroscopy to analyze four of the N-glycans released from the therapeutic protein etanercept, which is a key pharmaceutical component of the drug Enbrel™. Etanercept is a dimeric fusion protein containing the extracellular domain of the human tumor necrosis factor receptor (TNFR) attached to the fragment crystallizable (Fc) portion of human immunoglobulin heavy chain G1 (IgG1)30 by disulfide bonds (and hence its abbreviation TNFR-Fc). It functions as a tumor necrosis factor (TNF) inhibitor by binding to TNF and blocking the inflammatory cellular responses.31,32 It is used to treat autoimmune diseases including rheumatoid arthritis, juvenile idiopathic arthritis, psoriatic arthritis, and plaque psoriasis.33,34
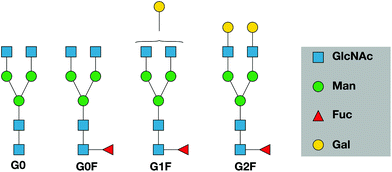
The glycans released from etanercept studied in this publication are shown in Fig. 1. They span the range of relative abundance from 22% for G0F to 1% for G0.10,35 The purpose of this study is to demonstrate that combining ultrahigh-resolution IMS with cryogenic vibrational spectroscopy can provide characteristic fingerprints for N-linked glycans that could be used as a rapid and sensitive means to monitor them. We discuss how this approach might be used more generally as a tool for glycan analysis of biotherapeutics.
Experimental approach
Ion-mobility-selective IR spectroscopy
Analysis of N-linked glycan standards as well as those enzymatically cleaved from etanercept was performed on a home-built instrument that combines ultrahigh-resolution ion mobility spectrometry and cryogenic vibrational spectroscopy, as described in a series of recent publications.23,25,26,36 Briefly, doubly protonated glycan ions are generated by a nanoelectrospray ionization (nESI) source and introduced into the first vacuum stage through a heated stainless steel capillary. After exiting the capillary, the ions enter a dual ion funnel trap (IFT), where they are focused and accumulated into packets. These packets are ejected from the IFT and transported into a travelling wave ion-mobility device based on structures for lossless ion manipulation (SLIM), originally developed by Smith and coworkers.37–39The SLIM design used in our experiments has two sections.36 A separation region allows us to achieve high resolution in the arrival-time distribution (ATD) by propelling ions through a 1.5 m serpentine path, and this resolution can be further increased by cycling ions through this path multiple times. Another SLIM section is configured as a trap, which is used for selection and storage of the mobility-separated ions. To increase sensitivity, we accumulate several ion packets from the IFT in this on-board trap before ejecting them from the SLIM board. For the measurement of ATDs, the ions are then passed through a quadrupole mass filter and detected using a channeltron. The detailed operating parameters of the SLIM device are given in the ESI.†
To measure vibrational spectra, the channeltron is moved out of the beam path and mobility- and mass-selected ions are injected into a planar, cryogenic trap,40 where they are confined and cooled to ∼39 K by collisions with a cold buffer gas composed of a He/N2 (90![[thin space (1/6-em)]](https://www.rsc.org/images/entities/char_2009.gif) :
:![[thin space (1/6-em)]](https://www.rsc.org/images/entities/char_2009.gif) 10) mixture. At low temperatures, one or more nitrogen molecules attach to the glycan ions, serving as a “messenger tag” for detecting photon absorption.
10) mixture. At low temperatures, one or more nitrogen molecules attach to the glycan ions, serving as a “messenger tag” for detecting photon absorption.
The ions in the cryogenic trap are then subjected to 0.2 W of infrared radiation from a continuous wave mid-IR laser (IPG Photonics) for 50 ms and subsequently ejected into a time-of-flight mass spectrometer. Resonant absorption of IR photons by tagged ions followed by intramolecular vibrational energy redistribution leads to the evaporation of the tag(s), which is measured as a depletion of ion signal at the mass of the tagged glycan species. A plot of the number of tagged ions as a function of the laser wavenumber provides a vibrational fingerprint by which we can identify a given glycan.
The data are acquired using a WaveSurfer MXs-B Oscilloscope (Teledyne LeCroy SA, Switzerland) and processed using in-house control software written in LabVIEW.
Sample preparation
N-Glycans were cleaved from etanercept using PNGase F. Two 300 μg portions of the protein were diluted with 20 mM sodium phosphate buffer (pH 7.2) to a final concentration of 1 μg μl−1, followed by overnight incubation at 37 °C. As explained in detail in the ESI,† the cleaved N-glycans were separated from salts, detergents, and the deglycosylated protein using a combination of C18 and porous graphitic carbon cartridges (ThermoFisher, Germany). The eluates were combined and dried under vacuum. The dried residues were then reconstituted in 50 μl distilled water/acetonitrile (70![[thin space (1/6-em)]](https://www.rsc.org/images/entities/char_2009.gif) :
:![[thin space (1/6-em)]](https://www.rsc.org/images/entities/char_2009.gif) 30) prior to analysis. We monitor the efficiency of the enzymatic digestion with a UPLC (ACQUITY™ H-Class Plus, Waters, UK) coupled to Micromass Q-TOF Premier (Waters, UK). Cleaved glycans were additionally purified using an XBridge Glycan BEH Amide Column (Waters) with a mobile phase consisting of an ammonium formate buffer (100 mM, pH ∼4.5) and acetonitrile to elute the glycans. Each eluted glycan was collected using a Waters Fraction Collector III, evaporated down, and reconstituted to a total volume of 1 ml. Assuming no loss during the sample preparation, we estimate a final maximum concentration of 0.33 μM for the least abundant glycan (G0) and 7 μM for the most abundant (G0F) (see ESI†). Sample solutions were stored at −20 °C.
30) prior to analysis. We monitor the efficiency of the enzymatic digestion with a UPLC (ACQUITY™ H-Class Plus, Waters, UK) coupled to Micromass Q-TOF Premier (Waters, UK). Cleaved glycans were additionally purified using an XBridge Glycan BEH Amide Column (Waters) with a mobile phase consisting of an ammonium formate buffer (100 mM, pH ∼4.5) and acetonitrile to elute the glycans. Each eluted glycan was collected using a Waters Fraction Collector III, evaporated down, and reconstituted to a total volume of 1 ml. Assuming no loss during the sample preparation, we estimate a final maximum concentration of 0.33 μM for the least abundant glycan (G0) and 7 μM for the most abundant (G0F) (see ESI†). Sample solutions were stored at −20 °C.
Etanercept was expressed in CHO cell lines in the EPFL Protein Production Facility. PNGase F (recombinant) was purchased from Roche (Basel, Switzerland). All solvents used were HPLC grade. Ultrapure water was obtained from a Milli-Q Integral system. Synthetically derived N-glycans standards (estimated to be >85% pure) were purchased from Dextra Laboratories (UK) and analyzed without any additional purification. All standards were reconstituted in water/acetonitrile (70![[thin space (1/6-em)]](https://www.rsc.org/images/entities/char_2009.gif) :
:![[thin space (1/6-em)]](https://www.rsc.org/images/entities/char_2009.gif) 30) to a concentration of 80 μM prior to analysis. The stock solutions were further diluted using water/acetonitrile (70
30) to a concentration of 80 μM prior to analysis. The stock solutions were further diluted using water/acetonitrile (70![[thin space (1/6-em)]](https://www.rsc.org/images/entities/char_2009.gif) :
:![[thin space (1/6-em)]](https://www.rsc.org/images/entities/char_2009.gif) 30) to obtain 5–20 μM analyte solutions. We added 3–5 μL of 0.1% formic acid to enhance generation of the protonated N-glycan species.
30) to obtain 5–20 μM analyte solutions. We added 3–5 μL of 0.1% formic acid to enhance generation of the protonated N-glycan species.
Results and discussion
In this study, we compared four different N-glycans cleaved from TNFR-Fc, G0, G0F, G1F, G2F, to a targeted database that we created using standards. The database contains mass, ion mobility ATDs, as well as reference IR spectra. Fig. 2 shows a mass spectrum obtained for the G0F standard compared with that for G0F cleaved from TNFR-Fc. The spectrum of the standard shows multiple ion adduct species, including [M + H + NH4]2+, [M + H + Na]2+, [M + H + K]2+, [M + 2Na]2+, and [M + K + Na]2+, whereas the sample cleaved from TNFR-Fc shows primarily the doubly protonated form. The predominance of the latter is related to the clean-up procedure of the cleaved N-glycans performed in acidic (pH 4.5) media. For this reason, we compare the cleaved glycans with their corresponding standards in their doubly protonated form.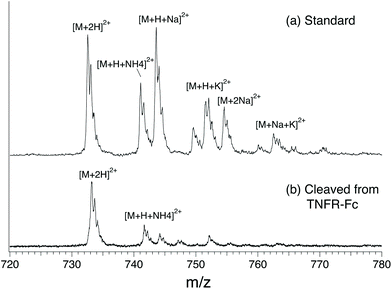 | ||
| Fig. 2 Comparison of ion adducts of G0F formed in positive ESI mode. (a) standard, (b) cleaved of TNFR-Fc. | ||
Fig. 3 shows ATDs of the G0F standard. The three sharp peaks observed after one cycle on the SLIM board (Fig. 3a) separate into multiple peaks after three SLIM cycles (Fig. 3b). We clearly observe additional small peaks that correspond to ions having slightly different three-dimensional structure from the major species. Multiple peaks in the ATD could correspond to different isomers (e.g., α and β anomers at the reducing end OH15,17,25) or to multiple conformers of those isomers. There can also be different protonation sites or different sites to which fucose might migrate.41 We have used significantly high electric field gradients and RF amplitudes in the first stages of our instrument prior to IMS separation to anneal the conformational distribution. While this does not necessarily imply that we are observing the lowest energy conformers, since some may be kinetically trapped, it ensures that the observed ATDs are reproducible between different experimental runs and independent of the nESI conditions.
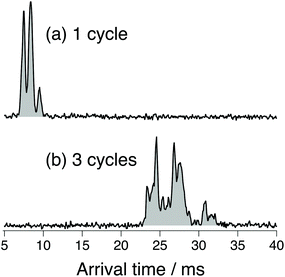 | ||
| Fig. 3 Arrival time distribution of the doubly protonated G0F after (a) one cycle on the SLIM board (drift length of 1.48 m) and (b) three separation cycles (drift length of 4.88 m). | ||
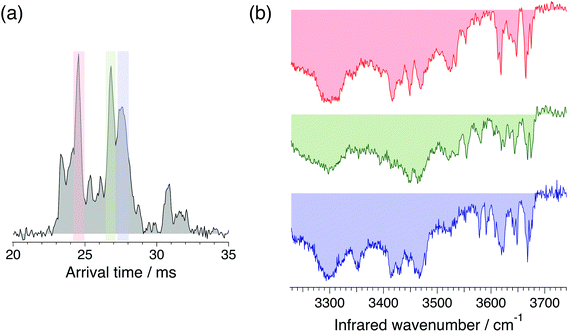
For our N-glycan database of standards, we recorded cryogenic IR spectra of the most intense peaks in the ATD, shown in Fig. 4 for G0F. The infrared spectra have sharp, distinct features in the free OH stretch region (3580–3700 cm−1) and broad transitions in the weakly hydrogen-bonded OH stretch region (3450–3550 cm−1), all of which provide a fingerprint that can be used to identify the molecule. While these mobility-selected infrared spectra likely represent subtly different molecular conformations, the reproducibility of the ATD's ensures that they provide a reliable identifying fingerprint.
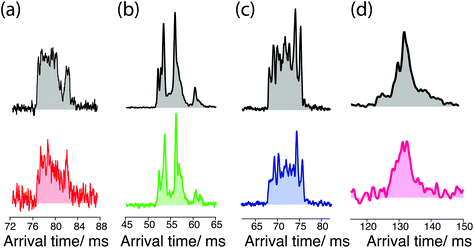
The data of Fig. 5 below demonstrate the utility of ultrahigh-resolution ion mobility for comparing the cleaved sugars with their standards. The ATD for the G0 standard (Fig. 5a, top) exhibits multiple peaks that are not fully resolved, while that for the cleaved G0 (Fig. 5a, bottom) shows a similar shape, but with a slightly different intensity distribution. In the case of the G0F standard (Fig. 5b, top), the ATD has multiple peaks that match well both in position and intensity with those of cleaved G0F (Fig. 5b, bottom). The ATD for the G1F standard (Fig. 5c, top) shows numerous prominent peaks, and while that of the cleaved G1F has the same number of peaks, they differ slightly in their intensities (Fig. 5c, bottom). Part of the complexity of this ATD almost certainly arises from the overlap of peaks from the two positional isomers, G1F and G1F′, which differ by the location of the galactose on the non-reducing end (see Fig. 1). In the present work we have made no attempt to separate these isomers, since our purchased standard was a mixture of the two and we have not yet measured either the ATD or the vibrational spectrum separately. The G2F standard displays two major peaks in the ATD that are not fully resolved (Fig. 5d, top), and the cleaved G2F has a similar profile with slightly different intensities of these two peaks (Fig. 5d, bottom). While some small differences were observed in the ATDs of the cleaved sugars compared to their respective standards, as demonstrated below, their respective cryogenic IR spectra confirm unambiguously our ability to identify them.
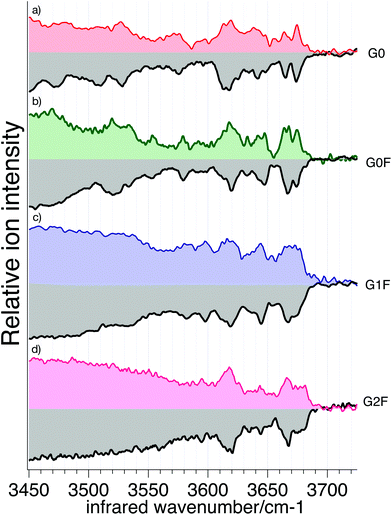
We recorded cryogenic IR spectra of the four cleaved N-glycans and their respective standards without ion mobility selection, shown in Fig. 6. The spectrum of each N-glycan has unique well-resolved transitions in the free OH stretch region (3580–3700 cm−1) that can be used for identification. In addition, G0 and G0F have broad bands in the weakly hydrogen-bonded OH stretch region (3450–3550 cm−1) that are also distinctive.
The IR spectra of reference and cleaved G0 (Fig. 6a) generally match in both the position and intensity of the vibrational bands, with only slight differences for broader bands (3471 cm−1 and 3511 cm−1). Spectra of the reference and cleaved G0F (Fig. 6b), G1F (Fig. 6c), and G2F (Fig. 6d) show nearly a perfect match in both the band positions and intensities. To quantify the similarity between IR spectra of standard and cleaved glycans, we calculated the correlation coefficient between each corresponding pair (see ESI† for details). The resulting high degree of correlation (95.9% for G0, 97.7% for G0F, 98.8% for G1F, and 98.3% for G2F) confirms their visual similarity and demonstrates the viability of using a spectroscopic database to identify them. The strong correlation is largely due to the sharpness of the features in the high frequency region of the spectrum, which is the result of the low temperature of the trapped ions, rendering this approach sensitive to the subtlest structural differences. The slight differences between the reference spectra and those of the cleaved glycans likely arises from small differences in the conformer distributions.
In this work, we did not record IR spectra for individual ion mobility peaks of each cleaved N-glycan, since the overall spectra of the sugars were nearly identical to their standards, both in the position and intensities of the vibrational bands. As demonstrated in Fig. 4, mobility-selected IR spectra are somewhat sharper and more distinctive, and thus they provide a more stringent spectroscopic fingerprint. However, this comes at the cost of sensitivity, since we are only sampling a subset of the ions, and hence we do this only if necessary to resolve ambiguous assignments. In principle, this should also allow us to distinguish the positional isomers G1F and G1F′.
To further assess the viability of this approach as a general tool for glycan analysis of biotherapeutics, we also need to demonstrate that the amount of sample required is reasonable. We estimate the maximum concentration of the least abundant of the cleaved glycans, G0, to be ∼0.33 μM, and that of the most abundant, G0F, to be ∼7 μM (see the ESI† for details). Given that the measurement of one IR spectrum takes approximately 3 min for the range from 3400 cm−1 to 3750 cm−1 and assuming a nESI flow rate (100 nl min−1), we can estimate that the maximum amount of sample on which we made our measurements is 100 fmol for G0 and 2 pmol for G0F. Any losses in sample during the clean-up procedure, which we neglected, would mean that our measurements were made on smaller amounts than this. While higher sensitivity is always better, our detection limit is in the range that would make this approach feasible for monitoring N-glycosylation in the large-scale production of biotherapeutics.42
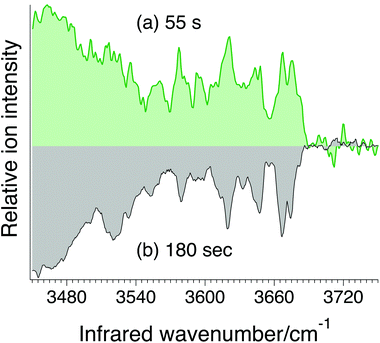
In addition to needing sufficient sensitivity, a viable analytical approach must be able to make measurements rapidly. Fig. 7a shows an example of an IR spectrum of the G0F standard measured in 55 seconds compared to one measured over a period of 180 s. While the signal-to-noise ratio is not as good in the faster scan, it still clearly exhibits resolved IR transitions in the OH spectral region that can be used as an identifying fingerprint. Such a short analysis time scale underlines the promise of this approach for rapid N-glycosylation profiling.
Our ultimate goal is to create a database of mass, mobility, and IR fingerprint spectra for known N-glycans in a manner similar to those measured in this work. For glycans for which we do not have standards, we can use collision induced dissociation techniques on the SLIM-IMS platform,36 as well as enzymatic degradation strategies,27 to determine parent glycan structures and include them in the database.
Conclusions
We have demonstrated that the combination of ultrahigh-resolution IMS based on structures for lossless ion manipulation (SLIM) technology with cryogenic vibrational spectroscopy can identify N-linked glycans cleaved from a therapeutic protein using a database approach. This work serves as a proof of principle that the sensitivity, speed, and resolution should be sufficient for large-scale N-glycan characterization and identification. Multiplexing these kinds of measurements will make them even more suitable for incorporation into analytical workflows. This approach should facilitate basic research and process development for novel therapeutics and biosimilar products.Conflicts of interest
There are no conflicts of interest to declare.Acknowledgements
The authors thank the Swiss National Science Foundation through grant 200020_184838, the European Research Council (Grant 788697-GLYCANAL), the Swedish Research Council (international postdoc grant 2019-00512) and the EPFL for the financial support of this work. We also thank Dr Jonathan Paz Montoya from the EPFL Protein Production Facility for providing the Fc-fusion protein.References
- M. L. A. De Leoz, D. L. Duewer, A. Fung, L. Liu, H. K. Yau, O. Potter, G. O. Staples, K. Furuki, R. Frenkel, Y. Hu, Z. Sosic, P. Zhang, F. Altmann, C. Grünwald-Grube, C. Shao, J. Zaia, W. Evers, S. Pengelley, D. Suckau, A. Wiechmann, A. Resemann, W. Jabs, A. Beck, J. W. Froehlich, C. Huang, Y. Li, Y. Liu, S. Sun, Y. Wang, Y. Seo, H. J. An, N.-C. Reichardt, J. E. Ruiz, S. Archer-Hartmann, P. Azadi, L. Bell, Z. Lakos, Y. An, J. F. Cipollo, M. Pucic-Bakovic, J. Štambuk, G. Lauc, X. Li, P. G. Wang, A. Bock, R. Hennig, E. Rapp, M. Creskey, T. D. Cyr, M. Nakano, T. Sugiyama, P.-K. A. Leung, P. Link-Lenczowski, J. Jaworek, S. Yang, H. Zhang, T. Kelly, S. Klapoetke, R. Cao, J. Y. Kim, H. K. Lee, J. Y. Lee, J. S. Yoo, S.-R. Kim, S.-K. Suh, N. de Haan, D. Falck, G. S. M. Lageveen-Kammeijer, M. Wuhrer, R. J. Emery, R. P. Kozak, L. P. Liew, L. Royle, P. A. Urbanowicz, N. H. Packer, X. Song, A. Everest-Dass, E. Lattová, S. Cajic, K. Alagesan, D. Kolarich, T. Kasali, V. Lindo, Y. Chen, K. Goswami, B. Gau, R. Amunugama, R. Jones, C. J. M. Stroop, K. Kato, H. Yagi, S. Kondo, C. T. Yuen, A. Harazono, X. Shi, P. E. Magnelli, B. T. Kasper, L. Mahal, D. J. Harvey, R. O'Flaherty, P. M. Rudd, R. Saldova, E. S. Hecht, D. C. Muddiman, J. Kang, P. Bhoskar, D. Menard, A. Saati, C. Merle, S. Mast, S. Tep, J. Truong, T. Nishikaze, S. Sekiya, A. Shafer, S. Funaoka, M. Toyoda, P. de Vreugd, C. Caron, P. Pradhan, N. C. Tan, Y. Mechref, S. Patil, J. S. Rohrer, R. Chakrabarti, D. Dadke, M. Lahori, C. Zou, C. Cairo, B. Reiz, R. M. Whittal, C. B. Lebrilla, L. Wu, A. Guttman, M. Szigeti, B. G. Kremkow, K. H. Lee, C. Sihlbom, B. Adamczyk, C. Jin, N. G. Karlsson, J. Örnros, G. Larson, J. Nilsson, B. Meyer, A. Wiegandt, E. Komatsu, H. Perreault, E. D. Bodnar, N. Said, Y.-N. Francois, E. Leize-Wagner, S. Maier, A. Zeck, A. J. R. Heck, Y. Yang, R. Haselberg, Y. Q. Yu, W. Alley, J. W. Leone, H. Yuan and S. E. Stein, Mol. Cell. Proteomics, 2020, 19, 11–30 CrossRef CAS PubMed.
- L. Zhang, S. Luo and B. Zhang, mAbs, 2015, 8, 205–215 CrossRef PubMed.
- S. A. Berkowitz, J. R. Engen, J. R. Mazzeo and G. B. Jones, Nat. Rev. Drug Discovery, 2012, 11, 527–540 CrossRef CAS PubMed.
- P. Stanley, N. Taniguchi and M. Aebi, in Essentials of Glycobiology, ed. A. Varki, R. D. Cummings, J. D. Esko, P. Stanley, G. W. Hart, M. Aebi, A. G. Darvill, T. Kinoshita, N. H. Packer, J. H. Prestegard, R. L. Schnaar and P. H. Seeberger, Cold Spring Harbor Laboratory Press, Cold Spring Harbor (NY), 2017, ch. 9, DOI: DOI:10.1101/glycobiology.3e.009.
- K. Mariño, J. Bones, J. J. Kattla and P. M. Rudd, Nat. Chem. Biol., 2010, 6, 713–723 CrossRef PubMed.
- M. J. Kailemia, L. R. Ruhaak, C. B. Lebrilla and I. J. Amster, Anal. Chem., 2014, 86, 196–212 CrossRef CAS PubMed.
- L. R. Ruhaak, G. Xu, Q. Li, E. Goonatilleke and C. B. Lebrilla, Chem. Rev., 2018, 118, 7886–7930 CrossRef CAS PubMed.
- D. M. Sheeley and V. N. Reinhold, Anal. Chem., 1998, 70, 3053–3059 CrossRef CAS PubMed.
- X. Yu, Y. Jiang, Y. Chen, Y. Huang, C. E. Costello and C. Lin, Anal. Chem., 2013, 85, 10017–10021 CrossRef CAS PubMed.
- E. Largy, F. Cantais, G. Van Vyncht, A. Beck and A. Delobel, J. Chromatogr. A, 2017, 1498, 128–146 CrossRef CAS PubMed.
- E. F. J. Cosgrave, W. B. Struwe, J. M. Hayes, D. J. Harvey, M. R. Wormald and P. M. Rudd, J. Proteome Res., 2013, 12, 3721–3737 CrossRef CAS PubMed.
- J. Hofmann, H. S. Hahm, P. H. Seeberger and K. Pagel, Nature, 2015, 526, 241–244 CrossRef CAS PubMed.
- J. Hofmann, W. B. Struwe, C. A. Scarff, J. H. Scrivens, D. J. Harvey and K. Pagel, Anal. Chem., 2014, 86, 10789–10795 CrossRef CAS PubMed.
- G. Lu, C. L. Crihfield, S. Gattu, L. M. Veltri and L. A. Holland, Chem. Rev., 2018, 118, 7867–7885 CrossRef CAS PubMed.
- G. Nagy, I. K. Attah, S. V. B. Garimella, K. Tang, Y. M. Ibrahim, E. S. Baker and R. D. Smith, Chem. Commun., 2018, 54, 11701–11704 RSC.
- K. Pagel and D. J. Harvey, Anal. Chem., 2013, 85, 5138–5145 CrossRef CAS PubMed.
- L. Veillon, Y. Huang, W. Peng, X. Dong, B. G. Cho and Y. Mechref, Electrophoresis, 2017, 38, 2100–2114 CrossRef CAS PubMed.
- N. C. Polfer, J. J. Valle, D. T. Moore, J. Oomens, J. R. Eyler and B. Bendiak, Anal. Chem., 2006, 78, 670–679 CrossRef CAS PubMed.
- O. Hernandez, S. Isenberg, V. Steinmetz, G. L. Glish and P. Maitre, J. Phys. Chem. A, 2015, 119, 6057–6064 CrossRef CAS PubMed.
- B. Schindler, L. Barnes, G. Renois, C. Gray, S. Chambert, S. Fort, S. Flitsch, C. Loison, A.-R. Allouche and I. Compagnon, Nat. Commun., 2017, 8, 973 CrossRef PubMed.
- E. Mucha, A. I. González Flórez, M. Marianski, D. A. Thomas, W. Hoffmann, W. B. Struwe, H. S. Hahm, S. Gewinner, W. Schöllkopf, P. H. Seeberger, G. von Helden and K. Pagel, Angew. Chem., Int. Ed., 2017, 56, 11248–11251 CrossRef CAS PubMed.
- C. Masellis, N. Khanal, M. Z. Kamrath, D. E. Clemmer and T. R. Rizzo, J. Am. Soc. Mass Spectrom., 2017, 28, 2217–2222 CrossRef CAS PubMed.
- A. Ben Faleh, S. Warnke and T. R. Rizzo, Anal. Chem., 2019, 91, 4876–4882 CrossRef CAS PubMed.
- N. Khanal, C. Masellis, M. Z. Kamrath, D. E. Clemmer and T. R. Rizzo, Analyst, 2018, 143, 1846–1852 RSC.
- S. Warnke, A. Ben Faleh, V. Scutelnic and T. R. Rizzo, J. Am. Soc. Mass Spectrom., 2019, 30, 2204–2211 CrossRef CAS PubMed.
- S. Warnke, A. B. Faleh, R. P. Pellegrinelli, N. Yalovenko and T. R. Rizzo, Faraday Discuss., 2019, 217, 114–125 RSC.
- I. Dyukova, E. Carrascosa, R. P. Pellegrinelli and T. R. Rizzo, Anal. Chem., 2020, 92, 1658–1662 CrossRef PubMed.
- R. P. Pellegrinelli, L. Yue, E. Carrascosa, S. Warnke, A. Ben Faleh and T. R. Rizzo, J. Am. Chem. Soc., 2020, 142, 5948–5951 CrossRef CAS PubMed.
- M. Lettow, M. Grabarics, E. Mucha, D. A. Thomas, Ł. Polewski, J. Freyse, J. Rademann, G. Meijer, G. von Helden and K. Pagel, Anal. Bioanal. Chem., 2020, 412, 533–537 CrossRef CAS PubMed.
- D. Tracey, L. Klareskog, E. H. Sasso, J. G. Salfeld and P. P. Tak, Pharmacol. Ther., 2008, 117, 244–279 CrossRef CAS PubMed.
- M. Feldmann and R. N. Maini, Nat. Med., 2003, 9, 1245–1250 CrossRef CAS PubMed.
- L. Garrison and N. McDonnell, Ann. Rheum. Dis., 1999, 58, I65–I69 CrossRef CAS PubMed.
- A. Kuek, B. L. Hazleman and A. J. K. Östör, Postgrad. Med. J., 2007, 83, 251 CrossRef CAS PubMed.
- S. P. Reddy, V. V. Shah, E. J. Lin and J. J. Wu, in Therapy for Severe Psoriasis, ed. J. J. Wu, S. R. Feldman and M. G. Lebwohl, Elsevier, Philadelphia, PA, 2016, ch. 8, pp. 83–96 Search PubMed.
- S. Houel, M. Hilliard, Y. Q. Yu, N. McLoughlin, S. M. Martin, P. M. Rudd, J. P. Williams and W. Chen, Anal. Chem., 2014, 86, 576–584 CrossRef CAS PubMed.
- P. Bansal, V. Yatsyna, A. H. AbiKhodr, S. Warnke, A. Ben Faleh, N. Yalovenko, V. H. Wysocki and T. R. Rizzo, Anal. Chem., 2020, 92, 9079–9085 CrossRef CAS PubMed.
- L. Deng, Y. M. Ibrahim, A. M. Hamid, S. V. B. Garimella, I. K. Webb, X. Zheng, S. A. Prost, J. A. Sandoval, R. V. Norheim, G. A. Anderson, A. V. Tolmachev, E. S. Baker and R. D. Smith, Anal. Chem., 2016, 88, 8957–8964 CrossRef CAS PubMed.
- A. M. Hamid, S. V. B. Garimella, Y. M. Ibrahim, L. Deng, X. Zheng, I. K. Webb, G. A. Anderson, S. A. Prost, R. V. Norheim, A. V. Tolmachev, E. S. Baker and R. D. Smith, Anal. Chem., 2016, 88, 8949–8956 CrossRef CAS PubMed.
- A. M. Hamid, Y. M. Ibrahim, S. V. B. Garimella, I. K. Webb, L. Deng, T.-C. Chen, G. A. Anderson, S. A. Prost, R. V. Norheim, A. V. Tolmachev and R. D. Smith, Anal. Chem., 2015, 87, 11301–11308 CrossRef CAS PubMed.
- A. Masson, E. R. Williams and T. R. Rizzo, J. Chem. Phys., 2015, 143, 104313 CrossRef PubMed.
- M. Lettow, E. Mucha, C. Manz, D. A. Thomas, M. Marianski, G. Meijer, G. von Helden and K. Pagel, Anal. Bioanal. Chem., 2019, 411, 4637–4645 CrossRef CAS PubMed.
- M. A. Lauber, Y.-Q. Yu, D. W. Brousmiche, Z. Hua, S. M. Koza, P. Magnelli, E. Guthrie, C. H. Taron and K. J. Fountain, Anal. Chem., 2015, 87, 5401–5409 CrossRef CAS PubMed.
Footnote |
| † Electronic supplementary information (ESI) available. See DOI: 10.1039/d0an01206h |
| This journal is © The Royal Society of Chemistry 2020 |

