 Open Access Article
Single-molecule brightness analysis for the determination of anticancer drug interactions with DNA†
Ying
Zhou‡
 ,
Krzysztof
Bielec‡
 ,
Pakorn
Pasitsuparoad
 and
Robert
Hołyst
 *
*
Institute of Physical Chemistry, Polish Academy of Sciences, Kasprzaka 44/52, 01-224 Warsaw, Poland. E-mail: rholyst@ichf.edu.pl
First published on 20th July 2020
Abstract
Anthracyclines are one of the most studied anticancer drugs approved for medical treatment. The equilibrium constant (K) of the reaction between these drugs with DNA in both in vitro and in vivo experiments lacks consensus. The K values vary from 104 up to 108 M−1, which suggest a 1000-fold error in determining the effective concentration needed to form the drug–DNA complex. Until 2014, only one study by García [J. Phys. Chem. B, 2014, 118, 1288–1295] showed that the binding of anthracycline representative doxorubicin occurs in two reactions. We support this result by brightness analysis at a single molecular level for the four most common anthracyclines: doxorubicin, daunorubicin, epirubicin, and idarubicin.
1. Introduction
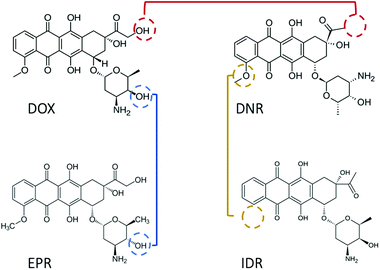
Since 1974, doxorubicin (DOX) has become one of the most commonly used anticancer drugs.1 The cytotoxic property of DOX is mainly associated with the formation of a complex between the drug and DNA, which prevents the replication of cancer cells. Numerous association/disassociation kinetic studies have been conducted to evaluate DOX affinity toward DNA. However, there is a general dispute regarding the results reported in those studies. The first debate relates to the value of the equilibrium constant (K), which varies by orders of magnitude (see Table 1), even after ionic strength normalization.2 The second issue is the detection limit. DOX possesses fluorescence properties with low quantum yield (QY). Thus, in spectroscopic methods, the lowest measurable concentration is usually set at the micromolar scale.2–4 This generates the possibility to observe signals from aggregated drug molecules (for instance, dimers, H-, and J-aggregates).5 The aggregated DOX has different physicochemical properties, which contribute differently in determining the equilibrium constant of DOX–DNA interaction. With fluorescence correlation spectroscopy (FCS), we can lower the working concentration to a nanomolar scale, although the accuracy of the method is limited to known reaction mechanisms.6,7 The last debate concerns the interaction mechanism. It has been widely accepted that DOX intercalates into the base pairs (bp) of DNA in a one-step reaction.8 However, additional binding of the DOX to the DOX–DNA complex has been recently reviled.2–4,9 As both the reactions occur at the same time, the second reaction is mostly observed when the amount of DOX is in large excess to the DNA binding sites. The excess of the DOX molecules attach to the formed DOX–DNA complexes with a weaker binding strength than DOX molecules attached in the first reaction.Due to the cardio-toxicity and dose resistance of DOX, people prefer to use the less harmful DOX derivatives–daunorubicin (DNR), epirubicin (EPR), and idarubicin (IDR) in cancer treatment.11 However, compared with DOX, there are fewer kinetic studies about these anthracycline–DNA interactions. In addition, the reported K values suggest a similar methodological inaccuracy as that in the case of DOX (see Table 2). Considering the structures of these drugs, they are all tetracenequinone-based chromophore groups and possess the positive nitrogen on the sugar moiety. It was inferred that the small structural differences of the hydroxyl groups (Fig. 1) should not significantly affect the K values of these drugs in their reaction with DNA. However, there is still a lack of systematic kinetic studies to compare the kinetics of these four drugs. Will they share the same reaction mechanism with the corresponding K values?
In our previous work, we developed a sensitive and accurate method to determine the equilibrium constant based on the molecular brightness (MB) of a single fluorophore. We have used this approach previously to determine the strength of the interaction between a pair of complementary oligonucleotides labeled with only one dye, even at 100 pM concentration of DNA strands.19 We define MB as the number of photons emitted by a number of molecules (e.g. anticancer drug) inside the confocal volume. After the formation of a drug–DNA complex, its MB could be enhanced or quenched, and thus the number of emitted photons changes.20K was determined using the ratio of the MB of drug molecules at free and bound states at a given concentration of the second substrate. With this approach, even a slight change in the number of emitted photons can be distinguished.
Here, we report a revised mechanism of DOX–, DNR–, EPR–, and IDR–DNA interactions consisting of two reactions, following with the corresponding K in each one. We observed the MB change of each drug at a single molecular level in the formation of the drug–DNA complexes. We proposed the structural model of interaction in the second reaction by analyzing drug fluorescence anisotropy properties. The determined average K in experiments with DOX binding to the different structures (linear or circular) and lengths of DNA (from 20 bp to 48 kbp) are equal to (6.9 ± 1.4) × 107 M−1 in the first reaction and (1.5 ± 0.6) × 106 M−1 in the second one. By monitoring the MB change of each drug, we proposed the structural binding insights and determined the transition point between each reaction (around 0.4 drug molecules per bp). The determined K values in the first (K1) and the second reaction (K2) show around a 40-time difference among all four anthracyclines.
2. Experimental section
2.1. Materials
![[thin space (1/6-em)]](https://www.rsc.org/images/entities/char_2009.gif) 502 bp) were purchased from Thermo Fisher Scientific, USA; and purified calf thymus DNA (ct DNA, 13
502 bp) were purchased from Thermo Fisher Scientific, USA; and purified calf thymus DNA (ct DNA, 13![[thin space (1/6-em)]](https://www.rsc.org/images/entities/char_2009.gif) 200 bp) was purchased from Merck KGaA, Darmstadt, Germany. All types of DNA were stored in standard Tris-EDTA buffer at −20 °C. In a typical experiment for K determination, the selected DNA was diluted into a series of working concentrations from 800 nM to 80 nM of bp (in terms of bp); there were 16 concentrations in total. No chemicals were further purified unless specifically stated.
200 bp) was purchased from Merck KGaA, Darmstadt, Germany. All types of DNA were stored in standard Tris-EDTA buffer at −20 °C. In a typical experiment for K determination, the selected DNA was diluted into a series of working concentrations from 800 nM to 80 nM of bp (in terms of bp); there were 16 concentrations in total. No chemicals were further purified unless specifically stated.
The anthracycline working solution was mixed in equal volumes with the DNA. The mixture was incubated over 12 hours at 25 °C before measurement. The final concentration of anthracycline in the experiment was set at 40 nM unless explicitly stated otherwise.
2.2. Microscope setup
Experiments were carried out on an inverted confocal microscope (Nikon C1). The system was upgraded with a PicoQuant LSM module, including the PicoHarp 300 Time-Correlated Single-Photon Counting setup (TCSPC). The sub-femtolitre detection volume was obtained using a 60× (NA = 1.2) water immersion objective (Nikon Plan Apo). A pulsed blue (485 nm) diode laser (PicoQuant GmbH, Germany) with a frequency of 40 MHz was used as the light source. To prevent photobleaching of DOX, we measured the laser power by the power meter (PM 100, Thorlabs) and set it at 50 ± 5 μW. The samples were loaded in a glass-bottom container (Thermo Scientific™ Lab-Tek™ chamber slide), the temperature was controlled at 25 ± 0.5 °C within a climate chamber (OkoLab, Italy). The focal volume was set at a distance of 10 μm from the edge of the cover glass. The fluorescence signal was filtered by the 488 long-pass filter and collected by two Single Photon Avalanche Diodes (MPD and PerkinElmer). Each experiment was preceded by a calibration using rhodamine 110 (Sigma-Aldrich). Typically, a single measurement lasted 90 seconds. The control of the system and prepossessed data analysis was dealt with by the Symphotime 64 software. Further data analysis was performed by self-written Python scripts.2.3. Brightness method
We explored drug–DNA complex formation by analyzing the MB of a single fluorophore. Anthracyclines are known to possess poor fluorescence properties. We define MB as the number of photons emitted per second per fluorophore. To describe the brightness method, we use the equations in which the substrates are administered in molar concentration. Hence, in equations, NA is the Avogadro constant. In the example of a pure drug solution (where “drug” can be DOX, DNR, etc.), in the given volume (V0), the average number of photons emitted per second (count rate, I0) is proportional to drug concentration (cdrug) and its intrinsic MB (α). There is:| V0·NA·cdrug·α = Ndrug·α = I0 | (1) |
When DNA is added into the drug solution, the drug molecules intercalate into the bp of DNA.
The fluorescent components in the system are the drug molecules and drug–DNA complexes. Now, the measured number of photons is I1. The drug–DNA complexes have an intrinsic MB γ1, which is different from that of drug MB (α). Therefore, eqn (1) changes to:
| V0·NA·(α·ceqdrug + γ1·ceqdrug–DNA) = I1 | (2) |
The equilibrium constant in this reaction (K1) is given by:
After transformation, I1 can be re-written as:
 | (3) |
Recent works show that besides a simple intercalation of DOX to DNA, there is a second interaction mechanism.3,4,9 The second reaction mechanism is the formation of the external complexes between the DOX molecules and the formed DOX–DNA complexes. The impact of this reaction becomes apparent when all the available binding sites on the DNA chain are occupied by DOX molecules, although they occur at the same time.3 The second reaction can be illustrated as:
The drug–(drug–DNA) complexes formed in the second reaction have an intrinsic MB γ2, which is different from α and γ1. In this case, after the addition of the DNA, three fluorescent components can be present in the reaction system (there is no formation of transition state), but the count rate I1 is still the same. Thus, eqn (2) can be written as:
 | (4) |
The equilibrium constant in the second reaction (K2) is given by:
Finally, I1 can be transformed into:
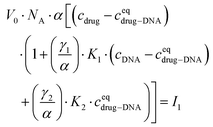 | (5) |
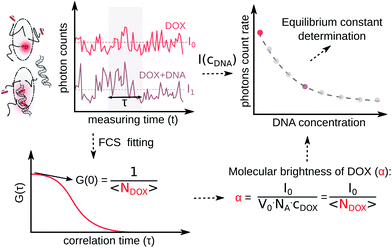
In the ESI,† we have described all of the steps to obtain eqn (3) and (5) in detail. To determine K1 and K2 in eqn (5), we measured the MB of each component (α, γ1, and γ2). More specifically, (1) α is determined in one FCS experiment (see Fig. 2, the details can be seen in our previous work6); (2) γ1 is evaluated in a titration experiment when cDNA ≫ cdrug; (3) γ2 is evaluated by a titration experiment when cDNA ≪ cdrug.
3. Results and discussion
3.1. Proof of two equilibrium states in DOX–DNA interaction
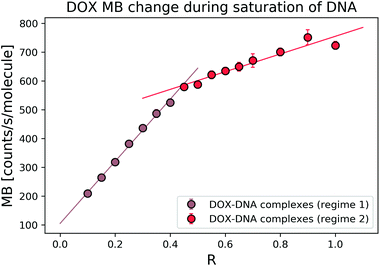
To explore the interaction mechanism between the drug and DNA, we started with the most widely studied anthracycline–DOX interaction. We monitored the DOX MB change in the reaction with a 69 bp double-stranded DNA. In the titration experiment, we kept the DOX concentration constant and varied the DNA concentration (in terms of bp concentration). In Fig. 3, we present MB as a function of DOX to DNA ratio (R). By fitting the MB change with a linear curve, we determined the cross-over point (R = 0.39 ± 0.05) of the two regimes.The average bp number per binding site is 3.1.21 We expected to reach the saturation of the available binding sites when R was 0.32. Thus, we focused on the regime where 0 < R ≤ 1 to determine the MB of the formed complexes. To determine the MB of each complex, we set the intercept of the linear fitting as DOX MB in each regime. In the first regime (R < 0.4), DOX lost 8.36 ± 1.92 fold of its initial MB, while in the second regime (R > 0.4), we observed a 2.28 ± 0.01-fold decrease. Our determined cross-over point (R = 0.39 ± 0.05) of the two regimes was in good relation with the previously reported number of 0.35.3
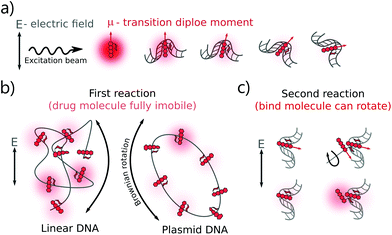
The DOX MB loss in the first regime (R < 0.4) can be explained as follows: when there are enough binding sites on the DNA chain, the aromatic group of DOX molecules will intercalate into the DNA bp through π-stacking interactions.22 Due to the stacking, the motion of the DOX aromatic groups is fully limited, leading to a dramatic fluorescence quenching.20 Meanwhile, two possible mechanisms can explain the smaller DOX MB loss in the second regime (R > 0.4). The first hypothesis is chemical interaction. In the formation of a second complex, the DOX molecules bind to the occupied binding sites with a similar conformation as that in the first reaction,4 although the influence on MB of DNA is lower as the first molecule compensates most of the initial interactions. In the second hypothesis, we infer that the chromophore group of the DOX molecules did not participate in the interaction as actively as that in the first reaction. Previous reports suggest an interaction between the positive N3′ nitrogen on the amino sugar of the DOX molecule and the backbone of the negatively charged DNA.2–4,9 Based on the rotation hypothesis, we assume that in the second mechanism, the aminoglycoside ring of the DOX molecules will interact electrostatically with DNA. In such a model (Fig. 4c), the rotational motion of the chromophore group in the DOX molecules is only partially limited; thus, the DOX molecules can emit more photons (the MB loss is less).9,23
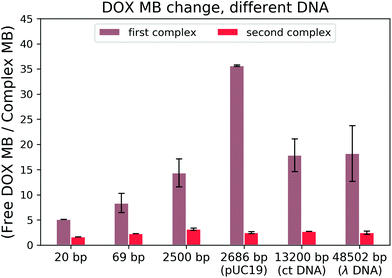
To find out which hypothesis in the second interaction mechanism is more accurate, we performed the brightness analysis with different types of DNA: from the very short 20 bp DNA to the very long 48k bp DNA and from the linear 2500 bp DNA to 2686 bp circular plasmid DNA (see Fig. 5). We calculated the relative DOX MB loss as the ratio of free DOX MB to the formed complex MB in each interaction. The larger the value, the more the MB loss. On average, the DOX molecules lost 16.56 ± 10.70 fold of the initial MB during the formation of the first complex and 2.45 ± 0.50 fold in the second one.
There is a correlation between the length of DNA and MB (the longer the DNA, the more significant the MB loss) in the first reaction, except for circular DNA. The MB loss of the second complex was similar irrespective of the DNA length or structure. The structure of the DOX molecules does not allow to transform it into other quenched conformations such as the case of Cy3 dye (trans- to cis-isomerization). The phenomenon in the first reaction can be explained as follows: when the DOX–DNA complexes are formed, the DOX molecules are trapped in the DNA backbone. With the increase in the number of the negatively charged bps in the DNA backbone, the electron polarization increases, which reduces the number of photons emitted from the chromophore group.24 The exception is the circular plasmid DNA, in which the DOX molecules lost more than 37-fold of the initial MB. The excitation of the DOX molecules depends on the proper orientation of the transition dipole moment (see Fig. 4(a)). The random orientation of the twisted linear DNA backbone makes the DOX MB change independent of fluorescence anisotropy. The DOX molecules that bind with circular DNA have a higher orientation order. As a result, they are more dependent on the dipole vector position of the DNA (see Fig. 4(b)). While in the second reaction, the similar MB loss shows that the rotation of the DOX molecules is not limited by the DNA chain. We infer that during the formation of DOX–(DOX–DNA) complexes, the interaction occurs between the aminoglycoside ring of the DOX molecules and the formed DOX–DNA complexes. Since the tetracenequinone chromophore group of the excess DOX can freely rotate, more photons can be emitted, leading to less and similar DOX MB in all DNA (see Fig. 4(c)).
3.2. Equilibrium constants of DOX–DNA complex formation
We have investigated that the DOX–DNA complex formation occurs in two reactions. Next, we determined the ratio of and
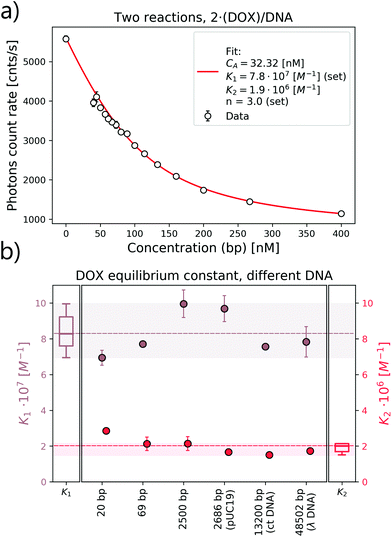
and  as a ratio of the initial DOX MB loss in the first and second complex formations, respectively. Along with either eqn (3) or (5), we determined the value of K1 and K2. We kept a constant DOX concentration (40 nM) and varied the DNA concentration. In each titration point, we measured the count rate and plotted it as a function of initial DNA concentration cbp (see Fig. 6(a)). Instead of fitting the function to the obtained data points with all released variables, we divided the series into previously specified regimes (R1 < 0.4 < R2). We determined K1 by fitting eqn (3) only to the points corresponding to the regime R1 < 0.4. After getting K1, we obtained K2 by fitting all data points with eqn (5). We performed the titration experiments on all DNA strands along with the corresponding MB and the results are shown in Fig. 6b. The average equilibrium constant is (8.3 ± 1.2) × 107 M−1 in the first reaction and (2.0 ± 0.5) × 106 M−1 in the second one. The difference in the equilibrium constant values between those reactions is around 40 times, whereas in Gracia's report, this difference is 200 times.3 This discrepancy could be caused by the ionic strengths we used in our measuring conditions. In the previous reports of DOX–DNA interaction, when the sodium concentration increases from 2.5 mM to 63 mM, the K value decreases from 108 M−1 to 107 M−1.2,3 The weaker the ionic strength, the larger the K value. Since the ionic strength in our measurement was four times stronger than that in Garcia's report,3 it is reasonable for us to have a five times smaller K than them.
The length or the structure of DNA does not affect the K values, except for the K2 obtained with 20 bp DNA (see statistical analysis in Fig. 6(b)). Our method is based on collecting the direct signal from the reaction pool, so that even a single photon change can be monitored. In comparison, the determination of K by the FCS method is not based on observing the MB change in each reaction (even for long DNA). The FCS experiment is based on an analysis of the fluctuation of the fluorescence signal. Thus, the signal from the components with different MB would be averaged by the correlation function.
To ensure that the brightness analysis is observed only by the reaction between the DOX molecules and DNA, we tested the self-aggregation of DOX at our working concentration (40 nM). We checked the possibility of DOX aggregation with UV-vis spectroscopy. From the results of the absorption and emission spectra, we did not observe dimers or higher aggregates of DOX molecules at our working concentration (the details are shown in ESI†).
3.3. Determination of complex formation between DNA and DOX analogs
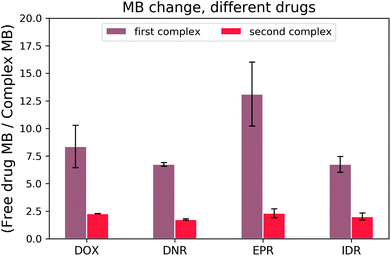
Once the DOX–DNA interaction has been thoroughly investigated, we analysed daunorubicin (DNR), epirubicin (EPR), and idarubicin (IDR). Due to the similarity in structure, we expect that these three anthracyclines also attach to DNA with the same two reaction mechanisms as DOX. As there are limited references that state the bp number (n) per binding site for those anthracyclines, we fit our curve with n equal to 4.25 ± 0.35, 2.85 ± 0.50, and 3.50 ± 0.71 for DNR, EPR, and IDR, respectively.14,21,25,26 These values are in good agreement with the reported n number 2–4. To exclude the influence from structural differences, we monitored the MB change of each anthracycline in the interaction with 69 bp DNA and the results are shown in Fig. 7.All three anthracyclines show a similar trend in MB change as DOX. Firstly, a strong MB loss (on average, 8.74 ± 3.10 fold) in the first reaction and then a slight MB loss (averagely, 2.08 ± 0.32 fold) in the second reaction. We determined the cross-over points of the DNR–, EPR– and IDR–DNA interactions with values equal to 0.33 ± 0.04, 0.43 ± 0.04, and 0.30 ± 0.00, respectively. The results prove that the two reaction mechanisms are also present for DOX analogs.
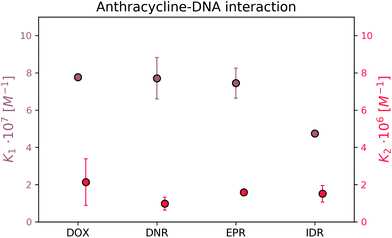
Next, we determined K1 and K2 for those DOX analogs in the reaction with 69 bp DNA. Each measurement was repeated twice to exclude the random error. No self-aggregation of the drugs was observed under UV-vis spectroscopy measurements within the working range (the details can be seen in the ESI†). The obtained K values for all four drugs are presented in Fig. 8.
The formation of the first complex of DOX, DNR, EPR, and IDR with DNA have K1 equal to (7.8 ± 0.2) × 107 M−1, (7.7 ± 1.1) × 107 M−1, (7.5 ± 0.9) × 107 M−1, and (4.8 ± 0.2) × 107 M−1, respectively. In the second reaction, DOX, DNR, EPR, and IDR have K2 equal to (2.1 ± 0.4) × 106 M−1, (9.8 ± 1.0) × 105 M−1, (1.6 ± 0.0) × 106 M−1, and (1.5 ± 0.1) × 106 M−1, respectively.
Determination of the reaction mechanism using the brightness analysis method was possible due to the significant difference in the strength of the interaction and brightness between the formed complexes of the individual reactions. The observation of the inflection point during the determination of the complex MB was a crucial part of the research. We expect no significant differences in the association/disassociation kinetics among those drugs in the binding with DNA based on the collected data during the analysis of the four most popular anthracyclines.
4. Conclusions
We applied the molecular brightness method to determine the equilibrium constant of the anthracycline–DNA interaction at the nanomolar concentration scale. We tested four of the most used drugs in anticancer therapy: DOX, DNR, EPR, and IDR. Regardless of the low quantum yield of these anthracyclines, the method was sensitive enough to confirm the presence of two reaction mechanisms with DNA. The first reaction (i.e., drug–DNA) dominates when there are plenty of binding sites for the drug molecules to intercalate into. The second complex (i.e., drug to drug–DNA) is formed as soon as the first drug intercalates into DNA. The difference in K of these two reactions is around forty times. We proposed the binding mechanism of the drugs in the second complex formation: the drug molecule anchors with aminoglycoside ring to the first formed complex. The provided data about the mechanism of the association/disassociation kinetics of DOX and its analogs can be used as a reference in the future use of those drugs. We hope that the simple principle of this method can be applied as an initial method in biochemical measurements. We also aim to develop potential methods for the selection of the most stable novel synthesized drug precursor complexes, the design of nano-drug delivery system, and the kinetic studies of in vivo biochemical reactions.Conflicts of interest
There are no conflicts to declare.Acknowledgements
This work was supported by the National Science Centre, Poland, within the grant Maestro UMO-2016/22/A/ST4/00017. Y. Z. acknowledges the support from the European Union's Horizon 2020 research and innovation program under the Marie Skłodowska-Curie grant agreement no. 711859 (CO-FUND Names project) and the financial resources from the Ministry of Science of Poland for science in the years 2017–2021 awarded for the implementation of an international co-financed project.References
- WHO, Mental and Holistic Health: Some International Perspectives, 2019, 119–134 Search PubMed.
- S. S. Tartakoff, J. M. Finan, E. J. Curtis, H. M. Anchukaitis, D. J. Couture and S. Glazier, Org. Biomol. Chem., 2019, 17, 1992–1998 RSC.
- C. Pérez-Arnaiz, N. Busto, J. M. Leal and B. García, J. Phys. Chem. B, 2014, 118, 1288–1295 CrossRef PubMed.
- M. Airoldi, G. Barone, G. Gennaro, A. M. Giuliani and M. Giustini, Biochemistry, 2014, 53, 2197–2207 CrossRef CAS PubMed.
- P. Changenet-Barret, T. Gustavsson, D. Markovitsi, I. Manet and S. Monti, Phys. Chem. Chem. Phys., 2013, 15, 2937–2944 RSC.
- X. Zhang, A. Poniewierski, K. Sozański, Y. Zhou, A. Brzozowska-Elliott and R. Holyst, Phys. Chem. Chem. Phys., 2019, 21, 1572–1577 RSC.
- P. Schwille and E. Haustein, Spectroscopy, 2001, 94(22), 1–33 Search PubMed.
- D. A. Gewirtz, Biochem. Pharmacol., 1999, 57, 727–741 CrossRef CAS PubMed.
- B. Jawad, L. Poudel, R. Podgornik, N. F. Steinmetz and W. Y. Ching, Phys. Chem. Chem. Phys., 2019, 21, 3877–3893 RSC.
- A. R. Rubio, N. Busto, J. M. Leal and B. García, RSC Adv., 2016, 6, 101142–101152 RSC.
- J. V. McGowan, R. Chung, A. Maulik, I. Piotrowska, J. M. Walker and D. M. Yellon, Cardiovasc. Drugs Ther., 2017, 31, 63–75 CrossRef CAS PubMed.
- Z. Chen, G. Liu, M. Chen, X. Chen, M. Wu and X. Chen, Comb. Chem. High Throughput Screening, 2010, 13, 383–392 CrossRef CAS.
- B. Doughty, Y. Rao, S. W. Kazer, S. J. Kwok, N. J. Turro and K. B. Eisenthal, J. Phys. Chem. B, 2013, 117, 15285–15289 CrossRef CAS PubMed.
- P. F. Fouzia, A. Nasima, R. Qureshi, J. Nowsherwan, A. Sultan, B. Nosheen and H. Rafique, PLoS One, 2018, 13, 1–19 Search PubMed.
- S. Charak, D. K. Jangir, G. Tyagi and R. Mehrotra, J. Mol. Struct., 2011, 1000, 150–154 CrossRef CAS.
- R. Hajian, E. Ekhlasi and R. Daneshvar, E-J. Chem., 2012, 9, 1587–1598 CrossRef CAS.
- C. Ozluer and H. E. S. Kara, J. Photochem. Photobiol., B, 2014, 138, 36–42 CrossRef CAS PubMed.
- S. Charak and R. Mehrotra, Int. J. Biol. Macromol., 2013, 60, 213–218 CrossRef CAS PubMed.
- K. Bielec, G. Bubak, T. Kalwarczyk and R. Holyst, J. Phys. Chem. B, 2020, 124, 1941–1948 CrossRef CAS PubMed.
- H. Sierra, M. Cordova, C. S. J. Chen and M. Rajadhyaksha, J. Invest. Dermatol., 2015, 135, 612–615 CrossRef CAS PubMed.
- F. Barcelo, J. Martorell, F. Gavilanes and J. M. Gonzalez-Ros, Biochem. Pharmacol., 1988, 37, 2133–2138 CrossRef CAS PubMed.
- Y. Wang and Z. Xu, RSC Adv., 2015, 6, 314–322 RSC.
- D. Agudelo, P. Bourassa, G. Bérubé and H. A. Tajmir-Riahi, Int. J. Biol. Macromol., 2014, 66, 144–150 CrossRef CAS PubMed.
- B. Göhler, V. Hamelbeck, T. Z. Markus, M. Kettner, G. F. Hanne, Z. Vager, R. Naaman and H. Zacharias, Science, 2011, 331, 894–897 CrossRef PubMed.
- S. R. Byrn and G. D. Dolch, J. Pharm. Sci., 1978, 67, 688–693 CrossRef CAS PubMed.
- G. Goluński, A. Borowik, A. Lipińska, M. Romanik, N. Derewońko, A. Woziwodzka and J. Piosik, Bioorg. Chem., 2016, 65, 118–125 CrossRef PubMed.
Footnotes |
| † Electronic supplementary information (ESI) available. See DOI: 10.1039/D0AN01108H |
| ‡ These authors contributed equally to this work. |
| This journal is © The Royal Society of Chemistry 2020 |

