 Open Access Article
Creative Commons Attribution 3.0 Unported Licence
Rapid quantification of the malaria biomarker hemozoin by improved biocatalytically initiated precipitation atom transfer radical polymerizations†
Samuel
Raccio
 a,
Jonas
Pollard
a,
Ashley
Djuhadi
a,
Jonas
Pollard
a,
Ashley
Djuhadi
 a,
Sandor
Balog
 a,
Michela M.
Pellizzoni
 a,
Kyle J.
Rodriguez
 a,
Omar
Rifaie-Graham‡
 a and
Nico
Bruns
 *ab
*ab
aAdolphe Merkle Institute, University of Fribourg, Chemin des Verdiers 4, 1700 Fribourg, Switzerland
bDepartment of Pure and Applied Chemistry, University of Strathclyde, Thomas Graham Building, 295 Cathedral Street, Glasgow G1 1XL, UK. E-mail: nico.bruns@strath.ac.uk
First published on 17th September 2020
Abstract
The fight against tropical diseases such as malaria requires the development of innovative biosensing techniques. Diagnostics must be rapid and robust to ensure prompt case management and to avoid further transmission. The malaria biomarker hemozoin can catalyze atom transfer radical polymerizations (ATRP), which we exploit in a polymerization-amplified biosensing assay for hemozoin based on the precipitation polymerization of N-isopropyl acrylamide (NIPAAm). The reaction conditions are systematically investigated using synthetic hemozoin to gain fundamental understanding of the involved reactions and to greatly reduce the amplification time, while maintaining the sensitivity of the assay. The use of excess ascorbate allows oxygen to be consumed in situ but leads to the formation of reactive oxygen species and to the decomposition of the initiator 2-hydroxyethyl 2-bromoisobutyrate (HEBIB). Addition of sodium dodecyl sulfate (SDS) and pyruvate results in better differentiation between the blank and hemozoin-containing samples. Optimized reaction conditions (including reagents, pH, and temperature) reduce the amplification time from 37 ± 5 min to 3 ± 0.5 min while maintaining a low limit of detection of 1.06 ng mL−1. The short amplification time brings the precipitation polymerization assay a step closer to a point-of-care diagnostic device for malaria. Future efforts will be dedicated to the isolation of hemozoin from clinical samples.
Introduction
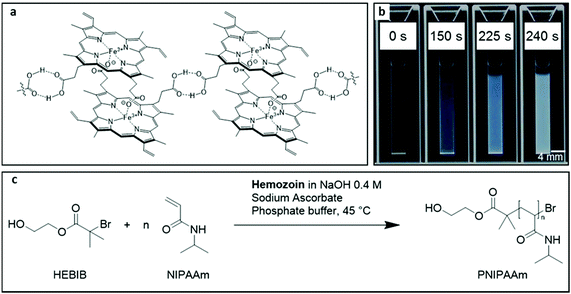
In 2003, the World Health Organization Special Program for Research and Training in Tropical Diseases (WHO/TDR) published a list of criteria that an ideal test for infectious tropical diseases must fulfill.1,2 This criteria list is known as the acronym ASSURED (affordability, sensitivity, specificity, user friendliness, rapid and robust, equipment free, and deliverable to end-user). Since then, many authors have emphasized the need for rapid tests to meet the needs of the developing world.2–7 To ensure that the patient receives treatment before leaving the medical facility, it is important that the results are established during the visit. Rapid tests allow for an immediate case-management and prevent the patient from having to return to the clinic several times. This is a very important factor in rural areas where remote contact is impossible and where the patient is unable to visit the test site several times due to lack of transportation or financial means. At the population level, immediate case management helps to decrease transmission.8,9 In some cases, assay time can even outweigh sensitivity as described for Chlamydia trachomatis10 and for syphilis.11The specific detection of DNA sequences, proteins or other biomolecules in very small quantities is of primary diagnostic interest.12 Early and rapid detection even before symptoms appear maximizes the chances of recovery while reducing health costs.13 To achieve this objective, analyte amplification techniques are generally used. The most famous of these is the polymerase chain reaction (PCR) that has revolutionized biomedical sciences. Radical polymerizations have also been used for diagnostics because the successive addition of many monomers to a growing polymer chain in the radical chain reaction is an effective way to concentrate molecules at a site of biodetection, thus amplifying a sensing signal.14 Polymerization-based amplification techniques (PBA) refer to the use of a radical chain reaction to molecularly amplify the recognition of a target analyte.15,16 In the field of malaria, Sikes et al. have proposed the combination of PBA in association with a paper based immunoassay.17 Free radical polymerization was initiated by an antibody-bound photoinitiator in the presence of a dye at the site where Plasmodium falciparum histidine-rich protein 2 (Pf HRP2) was identified by immunorecognition. After washing steps, trapped dye in the polymer revealed the presence of Pf HRP2 at the recognition site. PBA systems show great sensitivity, although their specificity is achieved, in most cases, by immunorecognition.16 This allows to detect a wide variation of analytes, but manufacturing of sensor surfaces and reagents is complex, and the need for several washing steps is laborious. Label-free detection can overcome these disadvantages, e.g., by using the intrinsic catalytic activity of the target analyte. For example, heme-containing enzymes and hemin are known for their ability to initiate polymerizations,18–20 and for their use as catalysts for reversible-deactivation radical polymerizations (also termed controlled radical polymerizations) such as atom transfer radical polymerizations (ATRP).21–27 Recently, our group showed that a biomarker of malaria, hemozoin (Fig. 1a), can be used to catalyze radical polymerizations.28 We exploited this phenomena to design a polymerization-amplified assay for the detection of hemozoin and, therefore, of malaria parasites. Hemoglobin can also be detected by the assay in a sensitive way.29 Hemozoin is a product of hemoglobin digestion by Plasmodium sp. parasites.30 The digestion of hemoglobin releases a significant amount of free heme that is toxic to the parasite. In order to disable the free heme, the parasite crystallizes it into centrosymmetric μ-propionate dimers of heme (hemozoin).31,32 During the life of the parasite, more and more hemozoin crystals are formed in the parasite's food vacuole. Hemozoin can be qualified as a pan-malaria biomarker since all Plasmodium sp. generate it during their intraerythrocytic life stages. However, its concentration varies greatly depending on the species as well as the life stage.33,34 Nevertheless, hemozoin has been investigated as a malaria biomarker for diagnostic purposes via several physical detection techniques such as laser desorption mass spectrometry,35 multiple-angle polarization scatter separation,36 magnetically induced dichroism,37–39 laser-induced nanobubble formation,40 and Raman spectroscopy.41 Our polymerization-amplified hemozoin detection technique is a very sensitive method for detecting hemozoin concentrations down to 0.85 ng mL−1 at a confidence level of 95%.28 To evaluate the performance of the technique, hemozoin was extracted from blood samples spiked with different amounts of cultured parasites. A limit of detection (LOD) of 10 infected red blood cells per μL was achieved, demonstrating the possible application of this technique as a sensitive diagnostic test for malaria. However, the amplification time required for the assay was 37 ± 5 min excluding sample collection and processing, which is too long for practical application. One paramount feature of point of care diagnostics is that the analysis must be done rapidly, ideally within the time of the medical consultation of approximately 20 min.1,7,10,11
The motivation of the work described herein is to gain a greater understanding of the chemistry behind the hemozoin-catalyzed precipitation polymerization assay, and to optimize the reaction conditions to perform rapid and sensitive detection of hemozoin. Thus, we probed how the reagents used in the assay influence the outcome of the reaction. These reagents include the crosslinker N,N′-methylenebis(acrylamide) (BA), ethanol as cosolvent, exogenous oxygen, the reducing agent ascorbate, the ATRP initiator 2-hydroxyethyl 2-bromoisobutyrate (HEBIB), the monomer N-isopropyl acrylamide (NIPAAm), the surfactant sodium dodecyl sulfate (SDS), and the reactive oxygen scavenger sodium pyruvate. Moreover, the effects of temperature and pH on the reactions were investigated in order to reduce the amplification time. Using optimized reaction parameters, the hemozoin assay was able to be performed in less than 4 minutes with a sensitivity of 1.06 ng mL−1 for synthetic hemozoin.
Experimental section
2-Hydroxyethyl 2-bromoisobutyrate (≥95%, HEBIB), N,N′-methylenebisacrylamide (BA), mineral oil (BioUltra grade), sodium phosphate monobasic (≥99.0%), sodium phosphate dibasic (≥99.0%), (+)-sodium L-ascorbate (≥99.0%, Asc), sodium pyruvate (≥99.0%, Pyr), ethanol (≥99.8%, EtOH), sodium hydroxide (≥98.0%), and sodium dodecyl sulfate (≥99.0%, SDS) were purchased from Sigma Aldrich and used as received. N-Isopropyl acrylamide (97%, NIPAAm) was purchased from Sigma Aldrich and was recrystallized twice from hexane. Synthetic hemozoin (sHz) was purchased from InvivoGen (San Diego, CA) and was used as received. Ultrapure water was made with Purelab Flex II (ELGA-Veolia Water System) at 18.2 mΩ using the purification pack LC208. UV-vis measurements were performed on an Analytik Jena Specord 50 Plus spectrophotometer equipped with a 6-cell changer that was thermostatted with a Julabo heating circulator TD-6. Semi-micro UV-vis cuvettes (path length 10 mm, optical glass) were obtained from Hellma Analytics.In a typical experiment, NIPAAm (639 mg, 5.65 mmol) and HEBIB (22.42 μL, 32.6 mg, 296 μmol) were added to a volumetric flask. Sodium phosphate buffer (pH 7.0, 0.1 mM, 10% v/v EtOH) was used to dissolve the reagents to a final volume of 6 mL. 850 μL of this solution was introduced into a cuvette. 50 μL of 0.4 M sodium hydroxide solution in ultrapure water containing various hemozoin concentrations was added. The solution was then sealed from ambient air by overlaying it with mineral oil (400 μL) and incubated in the cell changer for 3 min. During this time, sodium ascorbate (158 mg, 0.80 mmol) was dissolved in a volumetric flask (1 mL) with sodium phosphate buffer (pH 7.0, 0.1 M, 10% EtOH). Reactions were started by the addition of 100 μL sodium ascorbate solution to the reaction mixture, using a pipette tip to inject the solution through the oil layer. Final reagent concentrations were 36.3 mM HEBIB, 800 mM NIPAAm, and 80 mM Asc. The pH indicated in this paper refers to the pH of the buffer used for the preparation of solutions. For sodium phosphate buffer pH 7.0 (0.1 M, 10% EtOH), the pH after mixing of all reagents was 7.07.
For experiments with various ethanol concentrations, solutions containing water and EtOH in different ratios (3 mL) were added to sodium phosphate buffer (7 mL, pH 6.0, 0.1 M). Buffers with EtOH concentrations 0, 1, 5, 10, 20 and 30% v/v were made. NIPAAm (639 mg, 5.75 mmol) and HEBIB (60 μL, 87.2 mg, 719 μmol) were dissolved in phosphate buffer containing EtOH (6 mL). 850 μL of this solution was introduced into a cuvette. The rest of the procedure was performed as described above.
Degassed solutions were obtained by bubbling argon (ALPHAGAZ 1 AR, 99.999%) for 20 min through the solutions under stirring. Solutions were then introduced with a syringe to the cuvette below the oil layer.
For experiments using pyruvate, sodium pyruvate (604 mg, 5.49 mmol) was dissolved in sodium phosphate buffer (8 mL, pH 7.0, 0.1 M, 10% EtOH). The resulting solution was further used to prepare the solutions of NIPAAm, HEBIB and sodium ascorbate.
UV-vis extinction measurements were recorded at 410 nm every 22.2 s with an integration time of 0.1 s. (Please see ESI Fig. 1† that provides details for the choice of wavelength). Extinction is the sum of the contributions of absorbance and light scattering on the transmission of light through a cuvette, i.e., −log[T], where T is the transmission at a defined wavelength. The rates of turbidity formation  were determined using a MATLAB script (see ESI: MATLAB Script†). The script calculates a linear regression, fitted at every two points over the entire reaction time. Since turbidity formation is sigmoidal over time, the inflection point corresponds to the location where the slope is the highest. The highest linear regression slope was, therefore, used as a measure of the rate of turbidity formation
  . The decision limit and the detection limit were calculated according to Hubaux and Vos.42 This method connects a linear calibration curve with the confidence limit. The decision limit corresponds, a priori, to the lowest signal differentiable from the non-catalyzed reaction. The detection limit is, a priori, the lowest signal that cannot be confused with the blank. The maximum amplification time was defined as the time needed for the blank reaction to reach maximum
  .
.
UV-vis spectra were measured from 350 nm to 800 nm with a Δλ of 1 nm at a scan speed of 10 nm s−1, unless otherwise noted. Kinetic UV-vis spectra were followed by spectral scans between 320 to 700 nm, at a speed of 50 nm s−1 and with Δλ = 5 nm.
Results and discussion
General description of the hemozoin assay
The assay discussed herein is based on the thermoresponsive properties of poly(N-isopropylacrylamide) (PNIPAAm). When heated higher than 34 °C, PNIPAAm precipitates in aqueous solution while the monomer remains soluble (Fig. 1b).43–45 The radical polymerization of NIPAAm at elevated temperatures, therefore, results in the precipitation of the formed chains. This changes the macroscopic appearance of the solution from transparent to milky due to the scattering of light by the suspension of PNIPAAm particles. The addition of a crosslinker to the reagent mix would create crosslinked PNIPAAm particles, but we found that the crosslinker bisacrylamide lowered the performance of the assay (ESI Fig. 1†). Therefore, crosslinkers are not used in the precipitation polymerization.The reaction conditions of the assay are similar to those of activators regenerated by electron transfer (ARGET) ATRP (Fig. 1c). HEBIB is used as an initiator. An excess of sodium ascorbate is employed to regenerate the catalyst and to allow the system to tolerate the presence of oxygen. Hemozoin, which is insoluble in physiological conditions, is dissolved in aqueous sodium hydroxide. Once dissolved, hemozoin is activated by sodium ascorbate which reduces the iron of hemozoin from the Fe(III) oxidation state to Fe(II). The reduced hemozoin can homolytically cleave the bromine–carbon bond of the ATRP initiator HEBIB. The transfer of bromine from the initiator to the catalyst forms a tertiary carbon radical which initiates radical polymerization. The catalyst can transfer bromine back to the growing polymer chain. However, the reaction does not proceed as typical reversible-deactivation radical polymerization due to the heterogeneous nature of the reaction mixture.28 Even though oxygen interferes with radical polymerizations, the solution is not deoxygenated to allow for point-of-care handling of the assay.
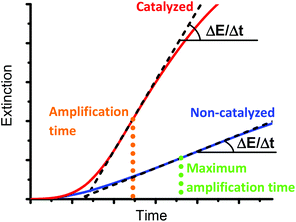
The precipitation of PNIPAAm can be monitored by measuring the extinction of the reaction mixture with a UV-vis spectrophotometer at a specific wavelength (Fig. 2). As detailed in the ESI,† we chose to use 410 nm as the measuring wavelength (ESI Fig. 2†). During the initial lag-phase, no turbidity formation is observed because oxygen inhibits the polymerization. The generated radicals as well as the excess of reducing agent overcome the inhibition of the polymerization by oxygen. Indeed, ascorbate oxidizes in the presence of oxygen and thus, leads to a rapid decrease of the dissolved oxygen concentration.46–49 After the lag phase, the polymerization begins and the extinction of the solution increases. The turbidity formation rate follows an almost linear increase, which allows the turbidity formation rate (ΔE/Δt) to be determined by a linear regression calculated at the steepest part of the extinction curve (Fig. 2, black dashed line). We have previously shown that the rate of turbidity formation depends on the hemozoin concentration, making the test quantitative.28 The higher the concentration of dissolved hemozoin is, the faster the rate of turbidity formation is. However, turbidity forms even in the absence of a catalyst (Fig. 2, blue curve), albeit at a very slow rate and after a longer lag-phase than for hemozoin-catalyzed reactions (Fig. 2, red curve). Therefore, the presence of the catalyst and its concentration is assessed by the difference between the rate of turbidity formation of an analytical sample and a non-catalyzed background reaction.
Another key parameter of our method is the amplification time, i.e. the time that the assay takes until it gives a quantifiable result. This is the time needed for a polymerization to reach maximum ΔE/Δt. Because a precipitation assay with an analytical sample of unknown hemozoin concentration would have to be run until the non-catalyzed reaction reached maximum ΔE/Δt, we define the maximum amplification time of the assay to be the time taken by the non-catalyzed reaction to achieve maximum ΔE/Δt (Fig. 2, green dotted line). This is the measure with which we compare the performance of the assay under various reaction conditions. It should be noted that catalyzed reactions react faster than non-catalyzed reactions, so that they reach the highest ΔE/Δt faster (Fig. 2, orange dotted line vs. green dotted line).
At the end of the hemozoin-catalyzed reactions, the rate of turbidity formation decreases in the catalyzed reactions because the catalyst copolymerizes into the polymer.28 Heme has two vinyl groups that make it susceptible to radical polymerization. Precipitation of the catalyst with the polymer leads to the loss of catalytic activity and, therefore, the rate of turbidity formation decreases.
Cosolvent
Dimethylformamide was used as a co-solvent in our previous publication to solubilize HEBIB in the assay.28 However, DMF is harmful by skin contact, causes severe eye irritation and may harm the fetus. In order to overcome this toxicity problem and to make the assay safer, the experiments presented here were performed using ethanol, which poses a smaller risk and is more accepted in the medical community. The optimum ethanol concentration for the assay was found to be 10 vol% because it resulted in the highest resolution between catalyzed and non-catalyzed reactions (ESI Fig. 3†).Presence of air
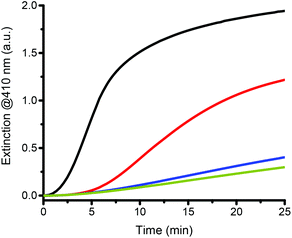
Oxygen quenches radical polymerizations. If a polymerization is carried out in the presence of air, enough radicals have to be created to consume the present oxygen before the polymerization can start. Oxygen can therefore inhibit the polymerization and result in a lag phase at the beginning of the reaction and, thereby, increase the time needed for the hemozoin assay to give a meaningful result. One way to shorten the amplification time is to conduct the polymerization in the absence of oxygen, which is usually achieved by physically degassing the reaction solution, e.g. by purging the solution with an inert gas. However, such procedures are not feasible for an assay that is intended for use outside of laboratories. To reduce the effect of oxygen on the hemozoin-catalyzed polymerization, an excess of sodium ascorbate, a reducing agent for the hemozoin catalyst, was used to consume the oxygen that is present in the system. Moreover, an oil layer was added on top of the reaction mixture to prevent the diffusion of oxygen from the headspace into the solution. This technique has the advantage of being easy to use because no inert gas handling is required. The oxygen present at the start of the reaction leads to an inhibition of the polymerization causing the consumption of initiator, monomer and ascorbate. In addition, ascorbate oxidizes in the presence of oxygen. To assess the impact of oxygen consumption on reaction parameters, reagents and reaction mixtures were degassed by argon bubbling. Then, degassed reactions were compared to non-degassed reactions (Fig. 3).As reported in our first communication, degassing of the solutions resulted in stark improvements when compared to the non-degassed catalyzed reactions.28 The lag phase is eliminated, i.e. reactions started immediately after the injection of the reducing agent. Moreover, the rate of turbidity formation is faster. The absence of the lag phase indicates that oxygen must be first consumed before the polymerization can start. Moreover, excess ascorbate and initiator initially used to consume oxygen are now available for the catalyzed reaction resulting in faster polymerization kinetics. The impact of dissolved oxygen on the non-catalyzed blank reaction was not studied previously. Oxygen has a less pronounced effect on the non-catalyzed reaction than on the catalyzed reaction (Fig. 3), indicating that the formation of turbidity in the absence of catalyst is not directly dependent of oxygen. As a conclusion, the presence of oxygen diminishes the performance of the assay by slowing down the catalyzed reaction while having little effect on the blank reaction. Although degassing would be advantageous to improve the performance of the assay, it is not feasible for point-of-care applications.
Deciphering the role of individual reagents
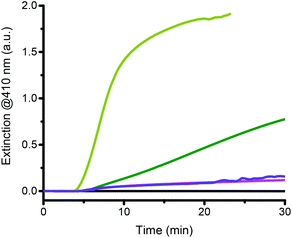
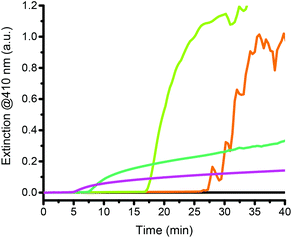
The individual role of each reagent must be understood to identify the key parameters that can influence the turbidity formation rate, the amplification time and the differentiation between catalyzed and non-catalyzed reactions. Theoretically, in the absence of catalyst, no turbidity formation should occur because only the catalyst should be able to cleave the C–Br bond of the initiator and, thus, initiate a radical chain reaction. However, experimentally, even in the absence of a catalyst, turbidity is observed after some time indicating that some reagents are not stable under the reaction conditions and that compounds capable of initiating free radical polymerization are generated in situ. It is therefore crucial to understand how the reagents and the parameters interact to affect the catalyzed and the non-catalyzed reactions. The initiator (HEBIB), the catalyst (sHz), and ascorbate were independently removed from the reaction mixture to assess their contributions to the overall reaction (Fig. 4).The removal of HEBIB from the catalyzed reaction reduced the rate of turbidity formation by an order of magnitude (Fig. 4 pale green vs. purple lines). Without an initiator, the presence or absence of hemozoin in the reactions cannot be differentiated (Fig. 4 purple vs. pink lines). In the latter case, only monomer and ascorbate were left in the reagent mix. However, slight precipitation was still observed. On the other hand, turbidity formation was completely suppressed when the reaction mixture consisted of initiator and monomer but no reducing agent, indicating that the monomer did not self-polymerize and that the initiator was stable over the reaction time (Fig. 4 black line). It would therefore appear that sodium ascorbate initiated the polymerization and generated turbidity in solution. If monomer, initiator, and reducing agent were present in the reaction mixture (i.e. in a non-catalyzed blank reaction), the turbidity formation was twice faster than in the absence of the initiator (Fig. 4 dark green vs. pink lines). Therefore, the turbidity observed for these non-catalyzed reactions resulted from an interaction between the initiator and the reducing agent that led to polymerization, as well as a background polymerization caused by the ascorbate itself.
In order to understand the role of the reducing agent better, the ascorbate concentration was varied and precipitation kinetics were recorded in the presence of monomer (Fig. 5). Catalyst and initiator were omitted from the reaction mixtures. For all the studied concentrations, ranging from 4 mM to 80 mM of ascorbate, polymerization was initiated. Increasing the ascorbate concentration from 4 mM to 80 mM reduced the lag phase from 26 min to 2 min. This indicates that a higher concentration of ascorbate makes it possible to overcome the presence of oxygen inhibition more quickly. Moreover, the lowest concentrations of ascorbate resulted in the fastest rates of turbidity formation in these uncatalyzed reactions. Because longer amplification times and fast blank reactions are unfavorable to the purpose of the assay, low ascorbate concentrations should be avoided. Ascorbate concentrations of more than 80 mM lead to the saturation of the solution, making it difficult to solubilize the reagents. In order to maximize the speed of the reaction, an ascorbate concentration of 80 mM was chosen for further experiments.
To summarize, the non-catalyzed reaction is caused by the initiator interacting with the reducing agent and by the reducing agent itself. The reducing agent concentration influences the lag phase and the rate of turbidity formation of the blank reaction. However, sodium ascorbate is needed in the assay to reduce hemozoin (which is an Fe(III) complex) and thereby create the activating catalyst species in the ATRP reaction. For practical reasons in this study, high doses of sodium ascorbate and initiator were used to help to overcome the oxygen inhibition, which in return resulted in turbidity formation even in the absence of catalyst. Despite the complexity of the non-catalyzed reaction, it remains reproducible and, therefore, allows hemozoin to be detected and quantified.
Addition of surfactant
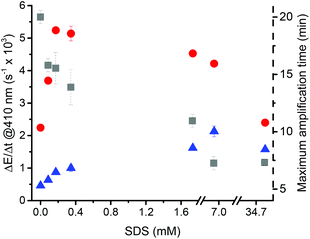
Surfactants are widely used to stabilize colloidal dispersions.50 The use of surfactants, such as SDS, shifts the LCST of PNIPAAm to a higher temperature.51 Moreover, when NIPAAm is polymerized at temperatures higher than its LCST in the presence of SDS, more particles of a more uniform size can be obtained due to the stabilization of the microgel nuclei over the nucleation and growing phases.44 In order to observe the effect of the surfactant on the precipitation polymerization under the conditions of our system, SDS was added to non-catalyzed and catalyzed reactions up to a concentration of 34.7 mM (Fig. 6) The critical micellar concentration of SDS is approx. 8 mM at 25 °C in water and falls to approx. 2 mM in the presence of salts.52 Thus, it can be expected that SDS concentrations of 0.9 mM and lower, as used for most experiments herein, did not result in the formation of micelles.Concerning the catalyzed reaction, addition of SDS increased the rate of turbidity formation strongly until it reached a maximum of 5.23 ms−1 at 0.170 mM SDS, most likely by increasing the number of formed PNIPAAm particles.44,51 At higher concentrations, the assay read-out decreased again. This decrease can be attributed to a partial solubilization of precipitating PNIPAAm51 and a decrease in apparent activity of the catalyst either by preventing the initiator to react with the catalyst, by heme degradation,53,54 or by transition of heme dimers to heme monomers.55 In order to gain insight into the interaction of SDS with hemozoin, UV-vis spectra of the catalyst were recorded in the presence and absence of SDS (ESI Fig. 4†). SDS causes changes in the spectrum of solubilized hemozoin, indicating a direct interaction of the catalyst with SDS, which is in agreement with literature.53,54,56 Even though the unambiguous speciation of the hematin species that are present under certain conditions is beyond the context of this report, the UV-vis spectra indicate that without SDS and at 0.170 mM SDS, dimers (most likely π–π dimers) of ferriprotoporphyrin IX might dominate while at high SDS concentrations monomers might be present.55
For the non-catalyzed reactions, increasing the SDS concentration up to 34.7 mM raised the rate of turbidity formation from 0.45 to 1.57 ms−1. Moreover, the addition of SDS shortened the maximum amplification time from 20 ± 0.5 min (no SDS) to 7.0 ± 0.5 min (at 34.7 mM SDS).
In conclusion, addition of SDS up to a concentration of 0.170 mM increased the differentiation between the catalyzed and non-catalyzed reaction by a factor of 2.5 and reduced the maximum amplification time to 15 min. Higher SDS concentrations would decrease the amplification time further, but at the cost of a loss in sensitivity.
Use of pyruvate as a ROS scavenger
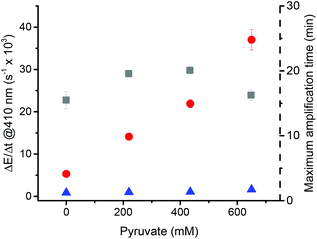
The presence of oxygen in the assay seems to play many roles. Apart from quenching radicals, it might also form reactive oxygen species (ROS) with sodium ascorbate, which in turn can contribute to the blank reaction (ESI Fig. 5†). Hydrogen peroxide can form by oxidation of sodium ascorbate.57–59 In the presence of metal traces, hydrogen peroxide degrades into reactive hydroxyl radicals through the Fenton reaction and can initiate polymerizations. It is also important to note that hydrogen peroxide is known for its capacity to degrade heme.53,60 In the case of hemoglobin, Nagababu et al. showed that superoxide forms when ferrylhemoglobin (Fe(II)) is in contact with hydrogen peroxide, which leads to the degradation of the heme moiety. Pyruvate has been used to scavenge ROS because it reacts with hydrogen peroxide to form inert CO2, water, and acetate.61 In order to assess whether pyruvate can be used to improve the performance of the assay, the effect of pyruvate was investigated on catalyzed and non-catalyzed reactions at pyruvate concentrations varying from 0 mM to the solubility limit of 650 mM (Fig. 7).Addition of pyruvate considerably increased the rate of turbidity formation linearly from 5.32 ms−1 to 37.0 ms−1 for the sHz-catalyzed reactions. Concerning the non-catalyzed reactions, the rate of turbidity formation increased slightly with the addition of pyruvate from 0.86 ms−1 to 1.63 ms−1 while maintaining similar amplification times. Thus, pyruvate makes the test more efficient by increasing the differentiation between the catalyzed and non-catalyzed reactions. UV-vis spectra of the dissolved hemozoin show significant differences in the visible Q-band region when pyruvate is added to the assay (ESI Fig. 6†). Possibly, pyruvate coordinates to solubilized hemozoin and increases its catalytic activity. For the non-catalyzed reaction, the observed effect is not expected because the use of a ROS scavenger should have reduced the rate of turbidity formation by preventing the in situ formation of radicals generated by ascorbate oxidation. To further investigate the role of pyruvate under the assay conditions, we measured the influence of pyruvate on the non-catalyzed reaction caused by ascorbate in the absence of initiator (ESI Fig. 7†). The addition of pyruvate (650 mM) reduced ΔE/Δt from 0.23 ms−1 to 0.01 ms−1 while maintaining the same lag phase. The use of pyruvate therefore considerably reduced the turbidity resulting from the decomposition of ascorbate. When HEBIB was added to the system, ΔE/Δt increased. Although pyruvate significantly decreases the contribution of ascorbate to the non-catalyzed reaction, it does not decrease the contribution of ascorbate together with the initiator. Bruce et al. have shown that the type and concentration of ions can have significant effects on the lower critical solution temperature (LCST) of PNIPAAm.62 The addition of sodium pyruvate at a high concentration of 650 mM might have decreased the LCST of PNIPAAm allowing the polymer chains to precipitate faster. Most likely, the ROS scavenging properties of pyruvate were offset by the change of ionic strength and ionic environment in the solution upon addition of pyruvate.
In conclusion, in the presence of pyruvate, the non-catalyzed reaction is slightly faster but this effect is outweighed by the acceleration of the catalyzed reaction. As an outcome, pyruvate improved the performance of the assay by increasing the differentiation between the catalyzed and non-catalyzed reaction by 800%, while not affecting the maximum amplification time.
Temperature, pH, and wavelength
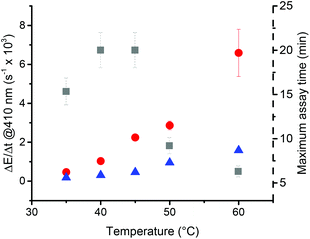
Temperature, pH and measuring wavelength were investigated as key reaction parameters and data collection parameter to reduce the amplification time while keeping high sensitivity. The temperature was varied between 35 °C and 60 °C (Fig. 8).As expected, raising the temperature of the reaction increased the rate of turbidity formation. For the non-catalyzed and catalyzed reactions, ΔE/Δt increased by a factor of 2.5 ± 0.6 for every 10 °C. Concerning the amplification time, increasing the temperature from 45 °C to 60 °C reduced the maximum amplification time from 20 ± 0.5 min to 6.3 ± 0.5 min. Measurements at 35 °C and 40 °C are close to the LCST of poly(NIPAAm), which is reported to be around 31–34 °C.44,45,63 To ensure an efficient precipitation, temperatures close to the LCST should be avoided. Using a temperature below 60 °C prevents possible hazards for the operator and reduces the energy consumption of the heating system. With these considerations, the operating temperature range should ideally be between 45 °C and 60 °C. Unless otherwise stated, we used 45 °C.
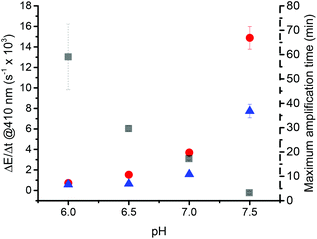
pH is an important factor affecting the decomposition of ascorbate.47,64,65 Higher pH increases its decomposition into dehydro-L-ascorbic acid. The disproportionation of the monodehydroascorbate radical anion (Asc˙−) is pH-dependent as well. Additionally, the oxidation of ascorbate by oxygen can be highly promoted by the presence of metal traces such as iron or copper at neutral and basic pH.66 Moreover, the pKa of hemozoin is around 7.55 Its exact value depends on the speciation of ferriprotoporphyrin IX which is influenced by the solvent composition. pH values lower than 6 were not investigated because below this pH the solubility of hemozoin decreases leading to its precipitation and therefore a loss of catalytic activity.32,67 In order to assess the pH-dependency of the precipitation polymerization assay, reactions were followed at pHs ranging from 6 to 8 at hemozoin concentrations of 0 and 100 ng mL−1 (Fig. 9). Reactions that were carried out at pH 8 were too fast to be followed with our experimental set-up, which requires a minute before measuring the extinction.
The increase in pH had a considerable effect on precipitation kinetics, with an exponential increase in the rate of turbidity formation as a function of pH for both the catalyzed and the non-catalyzed reaction. The maximum amplification time greatly diminished from 59 ± 13 min down to 3.1 ± 0.5 min by raising the pH from 6 to 7.5. Importantly, a higher pH benefitted the catalyzed reaction more than the non-catalyzed reaction. This could be due to the increasing deprotonation of ferriprotoporphyrin IX with increasing pH. At pH 6, no difference between the catalyzed and non-catalyzed reaction was observed. This could be explained by catalyst precipitation, as its solubility decreases when reducing the pH.32,67 The effect of pH on the non-catalyzed reaction might be explained by the influence of pH on the ascorbate species in solution. Fully protonated ascorbic acid (AscH2) is mainly found below pH 4.1, AscH− is found in majority up to pH 11.8, and at higher pH values Asc2− is dominant.47,68 Asc2− is supposed to be the only compound capable of oxidizing in the absence of metal traces such as copper or iron.47 At lower pH, the concentration of Asc2− is lower. The reactivity of Asc with dissolved oxygen, which leads to the blank reaction, is therefore much slower at lower pH values.
In conclusion, pH is an essential parameter that influences the catalyzed and the non-catalyzed precipitation polymerizations and the overall amplification time. Because of the reaction speed, pH 7.5 was used in further experiments. Having a maximum amplification time of 3.1 ± 0.5 min is a great advantage towards a rapid diagnostic test. Moreover, these experiments clearly demonstrate that the pH must be precisely controlled by appropriate buffers to ensure the robustness of the test. Otherwise, a small increase in pH will result in a significant change of ΔE/Δt.
Assessment of the assay performance
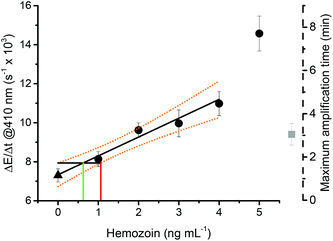
As elaborated above, the addition of 650 mM pyruvate and 170 μM SDS improved the difference in the rate of turbidity formation between catalyzed and non-catalyzed reactions significantly, which facilitates the assignment of a sample as a hemozoin-containing sample or as a control or negative. In addition, increasing the pH to 7.5 greatly reduced the maximum amplification time. In order to determine the collective effect of these improvements, the dose response curve of the assay was measured between 0 and 4 ng mL−1 sHz using 650 mM pyruvate, 170 μM SDS and 0.1 M sodium phosphate buffer (pH 7.5, 10% EtOH) (Fig. 10).The limit of detection (LOD) of the assay in the presence of SDS, pyruvate, and at pH 7.5 was 1.06 ng mL−1 with a confidence level of 95%. The limit of decision was 0.62 ng mL−1. The previous generation of the assay had a LOD of 0.85 ng mL−1 and a decision limit of 0.49 ng mL−1 natural hemozoin without the use of SDS and pyruvate.28 Thus, the sensitivity of the assay did not change substantially with the change in reaction parameters. The most important improvement of assay performance is, however, the amplification time. The assay was completed within 3 ± 0.5 min. This is significantly shorter than the time needed for the assay under the originally published assay conditions where the amplification time was 37 ± 5 min.28 A practically viable diagnostic assay should take 20 min or less.7 Thus, the amplification time is now within that range and leaves time that can be dedicated to the sample preparation, i.e. the extraction of hemozoin from an infected blood sample.
It is interesting to note that despite the improvement made to the speed of the test, the sensitivity did not increase. The major factor is that the change in reaction parameters did not only increase the rate of the catalyzed precipitation polymerization, but also the rate of the blank reaction. Nevertheless, the detection limit of the assay is very high and within a range that is relevant for the detection of low parasitemia patients.28 Classically, LOD is described in terms of infected red blood cells per μL (iRBCs μL−1), but the translation from a hemozoin concentration to a parasitemia in iRBCs μL−1 is not so straightforward. The hemozoin concentration varies according to the life cycle of the parasite and its species. From the literature, it is possible to obtain a raw estimation of parasitemia from hemozoin concentration.28,69,70 As discussed in our previous report, a concentration of 0.85 ng mL−1 would correspond to a parasitemia of 1.4 iRBCs μL−1.28 Thus, an LOD of 1.06 ng mL−1 would correspond to a parasitemia in the range of 1 to 10 iRBCs μL−1, which is around 20 times better than the current malaria rapid diagnostic tests (MRDTs) and more than 5 times more sensitive than microscopy.71
Conclusion
In conclusion, the chemistry of the hemozoin-catalyzed precipitation polymerization assay is complex. The reagents ascorbate and HEBIB, as well as dissolved oxygen cause secondary reactions that lead to NIPAAm polymerization and, therefore, turbidity formation even in the absence of the catalyst. However, each of the reagents is essential for the proper functioning of the assay, and oxygen cannot be excluded because of practical reasons. The catalyzed and the non-catalyzed reactions, although complex, are reproducible and allow for a robust and highly sensitive assay. The addition of pyruvate considerably increased the catalytic activity of dissolved hemozoin, and the use of the surfactant SDS significantly improved the differentiation between catalyzed and non-catalyzed reaction. pH strongly influences the assay, with more basic conditions accelerating the reactions. Thus, control of pH is essential for the proper functioning of the test, especially at neutral to basic pHs where a small change in pH can lead to a significant change in the rate of turbidity formation. The use of 170 μM SDS, 650 mM pyruvate, and pH set to 7.5 have made it possible to reduce the amplification time to 3 ± 0.5 min while maintaining a low detection limit for synthetic hemozoin of 1.06 ng mL−1. The short amplification time is very important for the practical implementation of the assay in malaria diagnostics. Ultra-sensitive malaria diagnostic methods, such as PCR, require hours.71 Fast diagnostics such as malaria rapid diagnostic immunotests are not sensitive enough to detect low levels of parasitemia in non-symptomatic humans.71 In contrast, the optimized precipitation polymerization assay for hemozoin is both rapid and highly sensitive. A malaria test based on hemozoin-catalyzed polymerizations will consist of several steps that include blood sample collection, the extraction of hemozoin from blood, and the precipitation polymerization assay for hemozoin. As demonstrated earlier, natural hemozoin can be extracted from parasite-containing blood samples.28 However, also this step needs to be simplified and accelerated. Ongoing research in our laboratories aims to develop a simple and rapid extraction method of hemozoin from blood samples that provides good isolation efficiency and specificity for hemozoin, e.g. by the use of paper-based microfluidics. Finally, the chemical assay and a suitable extraction method need to be implemented into a diagnostic device, which will then have to be validated in field studies to assess its sensitivity and specificity as a point-of-care test in low resource settings.Conflicts of interest
The authors declare that they have submitted a patent application that covers the technology. N. B., O. R.-G., and J. P. are the inventors on this patent. Moreover, the authors are in the process of establishing a spin-out company with the aim to commercialize malaria diagnostic assays based on these polymerizations.Acknowledgements
We thank Jan Eisenmann and Patrick Weber for their contribution to the optimization of reaction conditions. The Matlab script was written by Jerôme Brouchoud. This work was financially supported by the Swiss National Science Foundation through projects PP00P2_144697, PP00P2_172927 and PZ00P2_179865, the National Centre of Competence in Research (NCCR) Bio-Inspired Materials, and a BRIDGE Proof-of-Concept grant (20B1-1_173771). Further financial support of the project came from the Novartis Foundation for Biological-Medical Research (16A025) and the Gebert Rüf Foundation (GRS086/17).References
- D. Mabey, R. W. Peeling, A. Ustianowski and M. D. Perkins, Nat. Rev. Microbiol., 2004, 2, 231–240 CrossRef CAS.
- H. Kettler, K. White and S. J. Hawkes, Mapping the landscape of diagnostics for sexually transmitted infections: key findings and recommendations, World Health Organization, Geneva, 2004 Search PubMed.
- R. W. Peeling, K. K. Holmes, D. Mabey and A. Ronald, Sex. Transm. Infect., 2006, 82, v1–v6 CrossRef.
- P. Yager, G. J. Domingo and J. Gerdes, Annu. Rev. Biomed. Eng., 2008, 10, 107–144 CrossRef CAS.
- R. W. Peeling and D. Mabey, Clin. Microbiol. Infect., 2010, 16, 1062–1069 CrossRef CAS.
- T. R. Kozel and A. R. Burnham-Marusich, J. Clin. Microbiol., 2017, 55, 2313 CrossRef CAS.
- K. J. Land, D. I. Boeras, X.-S. Chen, A. R. Ramsay and R. W. Peeling, Nat. Microbiol., 2019, 4, 46–54 CrossRef CAS.
- S. O. Aral, K. K. Holmes, N. S. Padian and W. Cates, J. Infect. Dis., 1996, 174, S127–S133 CrossRef.
- N. E. Hofmann, C. A. Moniz, A. Holzschuh, K. Keitel, N. Boillat-Blanco, F. Kagoro, J. Samaka, Z. Mbarack, X. C. Ding, I. J. González, B. Genton, V. D’Acremont and I. Felger, J. Infect. Dis., 2018, 219, 1490–1498 CrossRef.
- T. L. Gift, M. S. Pate, E. W. I. Hook and W. J. Kassler, Sex. Transm. Dis., 1999, 26, 232–240 CrossRef CAS.
- P. W. Smit, D. Mabey, J. Changalucha, J. Mngara, B. Clark, A. Andreasen, J. Todd, M. Urassa, B. Zaba and R. W. Peeling, PLoS One, 2013, 8, e75327 CrossRef CAS.
- S. Goggins and C. G. Frost, Analyst, 2016, 141, 3157–3218 RSC.
- O. Golubnitschaja and V. Costigliola, EPMA J., 2012, 3, 14 CrossRef.
- X. Lou, M. S. Lewis, C. B. Gorman and L. He, Anal. Chem., 2005, 77, 4698–4705 CrossRef CAS.
- K. H. Malinowska and M. A. Nash, Curr. Opin. Biotechnol., 2016, 39, 68–75 CrossRef CAS.
- S. Kim and H. D. Sikes, Polym. Chem., 2020, 11, 1424–1444 RSC.
- S. Lathwal and H. D. Sikes, Lab Chip, 2016, 16, 1374–1382 RSC.
- A. Singh, S. Roy, L. Samuelson, F. Bruno, R. Nagarajan, J. Kumar, V. John and D. Kaplan, J. Macromol. Sci., Part A: Pure Appl.Chem., 2001, 38, 1219–1230 CrossRef.
- F. Hollmann and I. W. C. E. Arends, Polymers, 2012, 4, 759–793 CrossRef.
- S.-I. Shoda, H. Uyama, J.-I. Kadokawa, S. Kimura and S. Kobayashi, Chem. Rev., 2016, 116, 2307–2413 CrossRef CAS.
- S. J. Sigg, F. Seidi, K. Renggli, T. B. Silva, G. Kali and N. Bruns, Macromol. Rapid Commun., 2011, 32, 1710–1715 CrossRef CAS.
- Y.-H. Ng, F. di Lena and C. L. L. Chai, Polym. Chem., 2011, 2, 589–594 RSC.
- Y.-H. Ng, F. di Lena and C. L. L. Chai, Chem. Commun., 2011, 47, 6464–6466 RSC.
- T. B. Silva, M. Spulber, M. K. Kocik, F. Seidi, H. Charan, M. Rother, S. J. Sigg, K. Renggli, G. Kali and N. Bruns, Biomacromolecules, 2013, 14, 2703–2712 CrossRef CAS.
- A. Simakova, M. Mackenzie, S. E. Averick, S. Park and K. Matyjaszewski, Angew. Chem., Int. Ed., 2013, 52, 12148–12151 CrossRef CAS.
- C. Fodor, B. Gajewska, O. Rifaie-Graham, E. A. Apebende, J. Pollard and N. Bruns, Polym. Chem., 2016, 7, 6617–6625 RSC.
- K. J. Rodriguez, B. Gajewska, J. Pollard, M. M. Pellizzoni, C. Fodor and N. Bruns, ACS Macro Lett., 2018, 7, 1111–1119 CrossRef CAS.
- O. Rifaie-Graham, J. Pollard, S. Raccio, S. Balog, S. Rusch, M. A. Hernandez-Castaneda, P.-Y. Mantel, H.-P. Beck and N. Bruns, Nat. Commun., 2019, 10, 1–8 CAS.
- J. Pollard, O. Rifaie-Graham, S. Raccio, A. Davey, S. Balog and N. Bruns, Anal. Chem., 2020, 92, 1162–1170 CrossRef CAS.
- L. M. Coronado, C. T. Nadovich and C. Spadafora, BBA, Biochim. Biophys. Acta, Gen. Subj., 2014, 1840, 2032–2041 CrossRef CAS.
- S. Pagola, P. W. Stephens, D. S. Bohle, A. D. Kosar and S. K. Madsen, Nature, 2000, 404, 307–310 CrossRef CAS.
- T. J. Egan, J. Inorg. Biochem., 2008, 102, 1288–1299 CrossRef CAS.
- T. Bousema, L. Okell, I. Felger and C. Drakeley, Nat. Rev. Microbiol., 2014, 12, 833–840 CrossRef CAS.
- H. C. Slater, A. Ross, I. Felger, N. E. Hofmann, L. Robinson, J. Cook, B. P. Gonçalves, A. Björkman, A. L. Ouedraogo, U. Morris, M. Msellem, C. Koepfli, I. Mueller, F. Tadesse, E. Gadisa, S. Das, G. Domingo, M. Kapulu, J. Midega, S. Owusu-Agyei, C. Nabet, R. Piarroux, O. Doumbo, S. N. Doumbo, K. Koram, N. Lucchi, V. Udhayakumar, J. Mosha, A. Tiono, D. Chandramohan, R. Gosling, F. Mwingira, R. Sauerwein, R. Paul, E. M. Riley, N. J. White, F. Nosten, M. Imwong, T. Bousema, C. Drakeley and L. C. Okell, Nat. Commun., 2019, 10, 1433 CrossRef.
- P. F. Scholl, D. Kongkasuriyachai, P. A. Demirev, A. B. Feldman, J. S. Lin, D. J. Sullivan Jr. and N. Kumar, Am. J. Trop. Med. Hyg., 2004, 71, 546–551 CrossRef CAS.
- G. Campuzano-Zuluaga, T. Hänscheid and M. P. Grobusch, Malar. J., 2010, 9, 346 CrossRef.
- D. M. Newman, R. J. Matelon, M. L. Wears and L. B. Savage, IEEE J. Sel. Top. Quantum Electron., 2009, 16, 573–580 Search PubMed.
- Á. Orbán, M. Rebelo, P. Molnár, I. S. Albuquerque, A. Butykai and I. Kézsmárki, Sci. Rep., 2016, 6, 23218 CrossRef.
- A. Butykai, A. Orbán, V. Kocsis, D. Szaller, S. Bordács, E. Tátrai-Szekeres, L. F. Kiss, A. Bóta, B. G. Vértessy, T. Zelles and I. Kézsmárki, Sci. Rep., 2013, 3, 1431 CrossRef CAS.
- E. Y. Lukianova-Hleb, K. M. Campbell, P. E. Constantinou, J. Braam, J. S. Olson, R. E. Ware, D. J. Sullivan and D. O. Lapotko, Proc. Natl. Acad. Sci. U. S. A., 2014, 111, 900–905 CrossRef CAS.
- N. L. Garrett, R. Sekine, M. W. A. Dixon, L. Tilley, K. R. Bambery and B. R. Wood, Phys. Chem. Chem. Phys., 2015, 17, 21164–21168 RSC.
- A. Hubaux and G. Vos, Anal. Chem., 1970, 42, 849–855 CrossRef CAS.
- A. K. Tucker and M. J. Stevens, Macromolecules, 2012, 45, 6697–6703 CrossRef CAS.
- O. L. J. Virtanen and W. Richtering, Colloid Polym. Sci., 2014, 292, 1743–1756 CrossRef CAS.
- Z. Osváth and B. Iván, Macromol. Chem. Phys., 2017, 218, 1600470 CrossRef.
- S. H. C. Askes, W. Pomp, S. L. Hopkins, A. Kros, S. Wu, T. Schmidt and S. Bonnet, Small, 2016, 12, 5579–5590 CrossRef CAS.
- G. R. Buettner and B. A. Jurkiewicz, Radiat. Res., 1996, 145, 532–541 CrossRef CAS.
- G. R. Buettner, Free Radical Res. Commun., 1990, 10, 5–9 CrossRef CAS.
- D. E. Feierman, G. W. Winston and A. I. Cederbaum, Alcohol.: Clin. Exp. Res., 1985, 9, 95–102 CrossRef CAS.
- D. Sherrington, React. Funct. Polym., 1998, 1, 104–105 CrossRef.
- K. C. Tam, S. Ragaram and R. H. Pelton, Langmuir, 1994, 10, 418–422 CrossRef CAS.
- E. Fuguet, C. Ràfols, M. Rosés and E. Bosch, Anal. Chim. Acta, 2005, 548, 95–100 CrossRef CAS.
- N. Salehi, A. A. Moosavi-Movahedi, L. Fotouhi, S. Yousefinejad, M. Shourian, R. Hosseinzadeh, N. Sheibani and M. Habibi-Rezaei, J. Photochem. Photobiol., B, 2014, 133, 11–17 CrossRef CAS.
- W. Liu, X. Guo and R. Guo, Int. J. Biol. Macromol., 2007, 41, 548–557 CrossRef CAS.
- C. Asher, K. A. de Villiers and T. J. Egan, Inorg. Chem., 2009, 48, 7994–8003 CrossRef CAS.
- A. A. Moosavi-Movahedi, M. R. Dayer, P. Norouzi, M. Shamsipur, A. Yeganeh-faal, M. J. Chaichi and H. O. Ghourchian, Colloids Surf., B, 2003, 30, 139–146 CrossRef CAS.
- J. Du, J. J. Cullen and G. R. Buettner, Biochim. Biophys. Acta, 2012, 1826, 443–457 CAS.
- A. R. Giandomenico, G. E. Cerniglia, J. E. Biaglow, C. W. Stevens and C. J. Koch, Free Radicals Biol. Med., 1997, 23, 426–434 CrossRef CAS.
- M. Gutowski and S. Kowalczyk, Acta Biochim. Pol., 2013, 60, 1–16 CrossRef CAS.
- E. Nagababu and J. M. Rifkind, Biochemistry, 2000, 39, 12503–12511 CrossRef CAS.
- A. E. Enciso, L. Fu, A. J. Russell and K. Matyjaszewski, Angew. Chem., Int. Ed., 2018, 57, 933–936 CrossRef CAS.
- E. E. Bruce, P. T. Bui, B. A. Rogers, P. S. Cremer and N. F. A. van der Vegt, J. Am. Chem. Soc., 2019, 141, 6609–6616 CrossRef CAS.
- R. H. Pelton and P. Chibante, Colloids Surf., 1986, 20, 247–256 CrossRef CAS.
- G. R. Buettner and P. G. Czapski, Free Radical Res. Commun., 1986, 1, 349–353 CrossRef CAS.
- G. R. Buettner, Arch. Biochem. Biophys., 1993, 300, 535–543 CrossRef CAS.
- G. R. Buettner, J. Biochem. Biophys. Methods, 1988, 16, 27–40 CrossRef CAS.
- T. J. Egan, J. Inorg. Biochem., 2002, 91, 19–26 CrossRef CAS.
- N. H. Williams and J. K. Yandell, Aust. J. Chem., 1982, 35, 1133–1144 CrossRef CAS.
- D. M. Newman, J. Heptinstall, R. J. Matelon, L. Savage, M. L. Wears, J. Beddow, M. Cox, H. D. Schallig and P. F. Mens, Biophys. J., 2008, 95, 994–1000 CrossRef CAS.
- T. J. Egan, J. M. Combrinck, J. Egan, G. R. Hearne, H. M. Marques and S. Ntenteni, Biochem. J., 2002, 365, 343–347 CrossRef CAS.
- N. M. Pham, W. Karlen, H.-P. Beck and E. Delamarche, Malar. J., 2018, 17, 260–260 CrossRef.
Footnotes |
| † Electronic supplementary information (ESI) available: Influence of crosslinker on the precipitation polymerization. Influence of the measuring wavelength. Influence of the concentration of the cosolvent ethanol. Hemozoin absorption spectra at SDS concentration 0 mM, 0.170 μM and 34.7 mM. Short review on the sodium ascorbate degradation pathway. Additional measurement underlying the function of sodium pyruvate. MATLAB script used to calculate the rate of turbidity formation. See DOI: 10.1039/d0an00976h |
| ‡ Current address: Department of Materials and Department of Bioengineering, Institute of Biomedical Engineering, Imperial College London, Exhibition Road, London SW7 2AZ, UK. |
| This journal is © The Royal Society of Chemistry 2020 |

