 Open Access Article
Electrochemiluminescent sensors as a screening strategy for psychoactive substances within biological matrices†
Kelly
Brown
,
Charlotte
Jacquet
,
Julien
Biscay
,
Pamela
Allan
and
Lynn
Dennany
 *
*
WESTChem Department of Pure and Applied Chemistry, University of Strathclyde, Technology and Innovation Centre, 99 George Street, Glasgow, G1 1RD, UK. E-mail: lynn.dennany@strath.ac.uk
First published on 2nd June 2020
Abstract
With the rapid growth and appearance of novel psychoactive substances (NPS) onto the global drug market, the need for alternative screening methodologies for implementation within clinical environments is substantial. The immunoassay methods currently in use are inadequate for this new drug trend with the potential for misdiagnosis and subsequent administration of incorrect patient treatment increased. This contribution illustrates a strong proof-of-concept for the use of electrochemiluminescence (ECL) as a screening methodology for NPS within biological fluids, using the hallucinogen scopolamine as a model compound. A low cost, easy-to-use and portable sensor has been developed and successfully employed for the detection of scopolamine at clinically relevant concentrations within a variety of biological matrices, including human pooled serum, urine, artificial saliva and sweat, without any prior sample preparation required. Moreover, assessment of the sensor's potential as a point-of-care wearable device was performed with sample collection from the surface of skin, demonstrating its capability for the qualitative identification of scopolamine despite collection of only minimal volumes off the skins surface. The developed sensor described herein exhibits a strong proof-of-concept for the employment of such ECL sensors as point-of-care devices, where the sensors ease of use and removal of time-consuming and complex sample preparation methods will ultimately increase its usability by physicians, widening the avenues where ECL sensors could be employed.
Introduction
Despite global implementation of increased legislative controls to negate the use of novel psychoactive substances (NPS), they remain prevalent both within the drug community and market. NPS are typically designed to mimic the effects of traditional illicit substances but with an altered chemical structure, they were frequently outwith the control of current drug legislation. Unsurprisingly, they grew in popularity amongst users as a result of their accessibility.1–3 Despite their design to mimic the effects of traditional drugs they are often found to have unexpected and unwanted side effects. Currently, there is limited knowledge regarding the pharmacological or pharmacokinetic mechanisms of these substances; furthermore, the continuous growth of NPS structural variations make it almost impossible for authorities or practitioners to maintain a working knowledge. The lack of understanding regarding the pharmacokinetics of these substances is a significant problem; with no information on their bioavailability, elimination half-life, psychoactive effects, potency and toxicity available, life threatening side effects and fatalities are common.4–6One of the most notable issues related to NPS use is the current lack of adequate screening protocols. The immunoassay methods typically utilised for screening of traditional illicit substances, particularly within emergency rooms, are not adequate for the detection of NPS. Often generating a “false negative” or a “false positive” result, indicating the consumption of a traditional illicit substance rather than an NPS, as a result of the structure similarities or pharmacological targets of NPS to traditional drugs. As such clinicians, toxicologists, emergency physicians and forensic practitioners have been required to turn to alternative techniques for screening of these substances. However, the alternative techniques available often include laborious and expensive detection methods utilising mass spectrometry, a technique not suited for screening methods, especially when combined with the rapid appearance of new NPS and lack of reference materials available for their identification.4–7 This is especially relevant when considering the availability of such methods to emergency room physicians. Mass spectrometry is not only expensive to perform and maintain, but requires skilled personnel, time consuming sample preparation and available reference standards, all of which are not commonly available within a typical emergency room. Moreover, physicians require a rapid answer to determine patient treatment to ensure any further health risks are minimised. As such, there is an urgent requirement for new screening methodologies to address this gap. Although required for a number of fields, there is particular interest to focus upon methodologies appropriate for physicians, where the requirement for ease-of-use, low cost and rapid analysis is key.
Electrochemiluminescence (ECL) may hold a viable solution to this problem. ECL is a powerful technique with increased development in recent years resulting in its wide application across a number of different fields. ECL and other electrochemical (EC) based techniques have become popular within medical device and bioanalytical fields, largely owing to their significant benefits over the more traditional techniques.8–11 Primarily ECL and EC offer simplified instrumentation, increased operational simplicity and improved sensitivity. Uniquely the luminescence generated by ECL is controlled via the application of an applied external potential, negating the need for an external light source in contrast to alternative luminescence techniques. Removing this requirement allows for compact and lightweight instrumentation, ideal for portable or point-of-care devices. Furthermore, the cost of ECL instrumentation over the traditional techniques of gas chromatography mass spectrometry (GC-MS) or liquid chromatography mass spectrometry (LC-MS), required for the identification of NPS such as scopolamine, is drastically decreased. Not only is the initial outlay cost of instrumentation vastly decreased, the maintenance and operational costs are significantly lower and do not require a dedicated instrument suite. In addition the minimal sample preparation and rapid analysis times, intrinsic to ECL, ensure it satisfies all requirements for use by emergency room physicians.8–10,12 ECL based sensors therefore hold significant potential as viable alternatives to current screening techniques within emergency rooms, particularly for NPS but also for the screening of the traditional illicit substances.
Scopolamine, a naturally occurring tropane alkaloid, is produced by members of the solanaceous family. Much like atropine, its sister tropane alkaloid and biosynthetic precursor, scopolamine has a history of recreational abuse due to its anticholinergic hallucinogenic effects. Despite its hallucinogenic properties scopolamine remains largely unregulated in a number of countries, where the tropane alkaloid producing plants are easily accessible, found even within domestic gardens.13 Scopolamine is not only utilised for its hallucinogenic effects, but also for the its suspected aphrodisiac, amnesic and submissive effects on the user. These properties are likely related to the recent increase in the use of scopolamine for drug facilitate crimes, including sexual assaults, robberies and attempted murder.13–18 Scopolamine's often unknown toxicity poses an increased risk to the user, with unintentional poisonings and fatalities commonly reported despite the low amounts consumed. This was apparent in 2009, when an epidemic of scopolamine poisonings were reported in Oslo after the date-rape drug Rohypnol was adulterated with the tropane alkaloid;17 in 2018, a number of drug facilitate crimes in Spain were also found to involve scopolamine.19 Furthermore, the use of scopolamine as an incapacitating drug has been utilised among the South-America countries for decades.13–17 Scopolamine's reported half-life is approximately 1 hour, reaching its maximum concentration approximately 20 minutes after ingestion of a therapeutic dose, equivalent to a 0.5 mg tablet.20 One of the significant challenges when investigating the use of illicit substances within criminal activity, such as drug facilitated sexual assault, is the rapid metabolism and excretion of the compounds, making their detection after the matter extremely challenging. Under emergency room scenarios however, with patients presenting with symptoms, it is probable that such substances are still within the detection window. Despite limited human studies on the pharmacology and pharmacokinetics of scopolamine, it has been detected within the urine of different mammals between 24 to 106 hours following ingestion with a wide range of dosage percentages observed across different species.14,20,21 However, these animal studies fail to provide the required knowledge on the excretion and metabolism pathways of scopolamine.14,20,21 The few human studies available indicate that scopolamine is rapidly removed from the blood and distributed around the body prior to liver metabolism, where less than 5% of the parent compound is renally excreted with, on average, an 8-hour half-life. Secondary drug excretion of scopolamine is suspected with reports of the parent compound found within hair, faeces and breath.20–22
With scopolamine abuse increasing a screening methodology capable of offering rapid detection is thus necessary. This contribution discusses the use of a basic electrochemiluminescent sensor developed utilising screen-printed electrodes, which offers rapid detection with minimal sample preparation and volumes at a low cost. For the first time the ability to detect scopolamine not only via ECL but also within complex biological matrices including, human serum, urine, artificial saliva and artificial sweat has been achieved. What's more, successful replication of sensor application to the surface of skin was achieved and despite significantly low volumes of the hallucinogen present an easily identifiable signal was observed. By removing the requirement for sample preparation of biological fluids prior to analysis, it is hoped that such a sensor would be ideal for implementation within emergency rooms, although also appropriate for a range of different fields, where physicians would be able to perform analysis bedside obtaining the rapid answers they require for patient treatment. A strong proof-of-concept for not only the developed sensor but for the use of ECL based devices for employment as point-of-care or in-field sensors, has been demonstrated. These sensors could be easily used outwith a laboratory environment by non-experts. The cost of this analysis in comparison to the mass spectrometry techniques currently employed for screening of NPS, such as scopolamine, is a significant advantage of such a design and stands to offer a viable alternative screening methodology which currently does not exist.
Experimental
Materials and reagents
Tris (2,2′-bipyridyl) – dichlororuthenium(II) hexahydrate ([Ru(bpy)3]2+), (−)-scopolamine hydrobromide trihydrate, lithium perchlorate (LiClO4), urea, lactic acid, human pooled serum, Surine™ and 117 Nafion (∼5% mixture of lower aliphatic alcohols and water) were purchased from Sigma-Aldrich. Absolute EtOH, acetic acid, aluminium chloride (AlCl4) and NaCl were purchased from VWR Chemicals. All chemicals were used as received. All solutions were prepared in Milli-Q water (18 mΩ cm−1). Artificial saliva (Bioténe® oral balance gel) and synthetic skin were commercially purchased and used as received.Instrumentation
In brief, a combination of a CH instrument model 760D electrochemical analyser and Hamamatsu H10723-20 photomultiplier tube (PMT) were used for all electrochemical and photoluminescence measurements. GSI Technologies Electrochemical carbon screen printed electrodes (SPE) with a 4 mm carbon working electrode, carbon counter electrode and Ag paste quasi-reference electrode were used throughout with a maximum of 100 μL sample volume. A full description of the instrumentation employment can be found within our prior publications.23,24Fabrication of [Ru(bpy)3]2+/Nafion ECL sensor
The ECL sensor was fabricated using the same procedure previously described within Brown et al.23,24. In brief this comprised of modification of the working electrode surface via drop-casting 7 μL of a 0.5 mM [Ru(bpy)3]2+ and 0.2% Nafion film in a 50![[thin space (1/6-em)]](https://www.rsc.org/images/entities/char_2009.gif) :
:![[thin space (1/6-em)]](https://www.rsc.org/images/entities/char_2009.gif) 50 EtOH
50 EtOH![[thin space (1/6-em)]](https://www.rsc.org/images/entities/char_2009.gif) :
:![[thin space (1/6-em)]](https://www.rsc.org/images/entities/char_2009.gif) H2O solvent system. Once prepared the sensors were left to air dry under darkness for 2 hours. Prior to sample measurements, to ensure a stable signal was achieved, electrodes were pre-conditioned by performing three subsequent CV scans over the potential range of interest within the electrolyte solution. For biological fluid analysis preconditioning was performed within the respective matrix. For off-skin sample analysis no preconditioning was performed.
H2O solvent system. Once prepared the sensors were left to air dry under darkness for 2 hours. Prior to sample measurements, to ensure a stable signal was achieved, electrodes were pre-conditioned by performing three subsequent CV scans over the potential range of interest within the electrolyte solution. For biological fluid analysis preconditioning was performed within the respective matrix. For off-skin sample analysis no preconditioning was performed.
Preparation of biological samples
All samples were prepared via spiking of the selected matrix with the required volume of 5 mM scopolamine hydrobromide prepared in H2O to produce the desired concentration. Human pooled serum samples were stored at −80 °C and fully defrosted at room temperature prior to spiking and measurement. Artificial sweat was prepared following the ISO 3610-2 guidance.25,26 Artificial saliva and synthetic urine were commercially purchased and spiked with scopolamine as required.Results and discussion
Detection of scopolamine via ECL
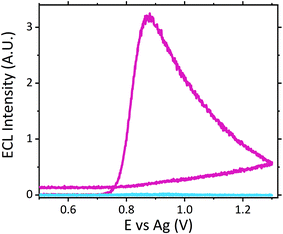
The ruthenium sensor utilised within this current study has been previously optimised and subsequently characterised within our prior publications.24,27 The sensor was observed to exhibit the same electrochemical behaviour as previously observed and hence is consistent with a typical Nafion-[Ru(bpy)3]2+ sensor.23,28–30 Tropane alkaloids, scopolamine and atropine, have demonstrated the ability to reliably behave as co-reactants producing ECL through the oxidative-reduction pathway.23,24,31 As previously observed for atropine,24 scopolamine's limited redox activity, results in minimal oxidation of the species at unmodified electrode surfaces. At significantly high concentrations a measurable oxidation signal can be obtained, with oxidation occurring at ∼1.3 V vs. Ag, refer to Fig. S1.† At the concentrations of interest however, direct electrochemical oxidation is not sufficient for viable detection methods. However, in the presence of [Ru(bpy)3]2+, mediated oxidation of the tropane group via the electro-generated Ru3+ species facilities light emission through the oxidative-reduction pathway with a maximum ECL intensity observed at ∼0.9 V, see Fig. 1. The ECL mechanism undertaken by scopolamine is believed to follow a similar pathway to that observed in the analytical studies of other structurally similar amine species.23,32,33 Currently there is limited literature available on the electrochemical detection of scopolamine itself. Da Costa Oliveira et al.34 and Florea et al.,35 have previously reported the direct electrochemical detection of scopolamine utilising boron doped diamond and graphite screen printed electrodes respectively. To date the detection of scopolamine via ECL has largely been achieved through the employment of a prior separation strategy,36–38 with its use as a direct detection method minimal.23,24The structural similarities, typically indistinguishable oxidation potentials and chemically irreversible electro-oxidation of scopolamine generating formaldehyde, suggests that it follows the same oxidative N-dealkylation mechanism as proposed for atropine.23 This mechanism is based upon those observed for tropanes39 and tertiary aliphatic amines40 and is responsible for the ECL emission of scopolamine. The irreversible oxidation observed can be attributed to the electrolytic degradation of scopolamine, forming a secondary amine species at the tropane ring (norscopolamine) alongside formaldehyde. The oxidative-reduction mechanism proposed is summarised in Scheme 1 and within eqn (1)–(5). The Ru3+ species generated at the electrode surface during the forward potential sweep (1) is required for the subsequent mediated oxidation of scopolamine following (2), which generates the highly reducing intermediate scopolamine˙ (a neutral radical species) (3). This scopolamine radical (b) then undergoes homogenous electron transfer with the remaining Ru3+ species to produce the excited Ru2+* species, which upon relaxation emits a photon of a characteristic wavelength. Following this homogenous electron transfer reaction, the imminium cation (c) formed decomposes via hydrolysis and subsequent N-dealkylation generating formaldehyde and the secondary amine species, norscopolamine (e).
| [Ru(bpy)3]2+ − e− ↔ [Ru(bpy)3]3+ | (1) |
 | (2) |
| Scopolamine˙+ ⇌ Scopolamine˙ | (3) |
 | (4) |
| [Ru(bpy)3]2+* → [Ru(bpy)3]2+ + hν | (5) |
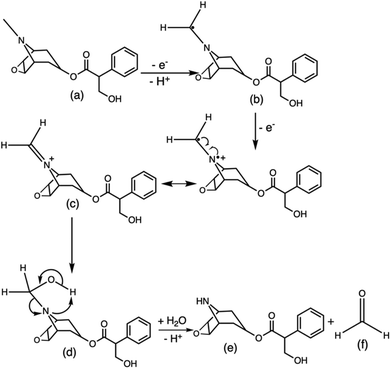 | ||
| Scheme 1 Mechanism of the oxidative N-dealkylation responsible for the ECL emission of scopolamine (a), based upon the oxidative N-dealkylation mechanism of atropine,24 leading to the formation of norscopolamine (e) and formaldehyde (f). | ||
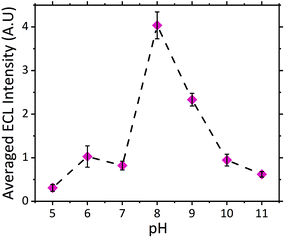
The dependence of signal intensity with sample pH for ECL analysis is dictated by the molecules’ dissociation mechanism. pH determines whether the oxidizable form of the molecule is dominant under different pH conditions. Previously we have reported on the trend observed for atropine's ECL intensity with varying pH.27 As expected scopolamine displayed a similar trend as seen for atropine and other structurally similar amine species, refer to Fig. 2.23,24,29,41 As such, the maximum ECL intensity was obtained at pH 8 close to the compounds pKa of 7.75.42 Furthermore measurable signals were obtained across the entire pH range investigated for scopolamine, although to varying intensities.24 The ability to obtain a measurable signal across a range of pH values, presented a unique opportunity to utilise this systems intrinsic characteristic for the analysis of biological fluids, where samples with a range of pH values would be encountered.
Biological fluid analysis
The developed [Ru(bpy)3]2+ sensing platform utilised here for the analysis of biological fluid samples has previously demonstrated satisfactory analytical performance,24,27 offering suitable detection limits and the required precision, with an electrode reproducibility of 1.9% and repeatability of 8.3%. As such the designed sensor offers an idea analysis tool for the screening of biological fluids for illicit substance detection.Human pooled serum analysis
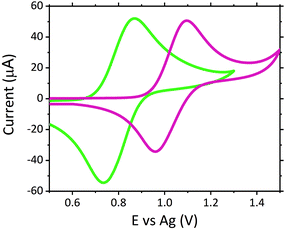
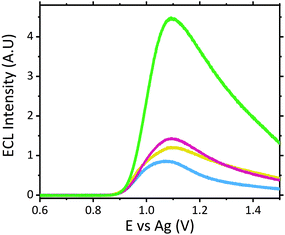
The dose of scopolamine administered for criminal and predatory use has been reported between 0.99 and 6.23 μM in blood (0.0003 to 0.00189 mg mL−1), which is approximately 50 to 3000 times the typical therapeutic dose for one dermal slow release patch administered over a 24 hours period, resulting in an approximate therapeutic blood concentration of 0.99 nM (3.0 × 10⁻⁷ μg mL−1).15,16,43 Despite the therapeutic concentration of approximately 0.99 nM lying outwith the detection limits achievable with this current screening methodology, such low concentrations would not induce the adverse symptoms which would result in users requiring emergency treatment. As such, there is currently no significant demand for emergency room screening protocols to operate in the nM region.No sample preparation was performed on serum samples, which were analysed neat. Neat serum was spiked to give a final concentration of 1 μM scopolamine hydrobromide. Once serum was spiked with the hallucinogen, this mixture was then analysed directly upon the modified electrodes. Fig. 3 shows a comparison of the voltammograms obtained with the ruthenium modified electrodes. Despite the complexity and likely resistance to charge transfer of neat serum, the voltammograms obtained demonstrate its ability to offer the conductivity necessary for use as a suitable electrochemical matrix. This is confirmed through the comparable peak-to-peak separations of the Ru2+/3+ redox couple within serum and a typical supporting electrolyte of 0.1 M LiClO4, with ΔEp values of 136 mV for serum and 134 mV in 0.1 M LiClO4 achieved. Where the difference in the E0, Epa and Epc values is attributed to the use of the non-isolated quasi-reference electrode comprising of screen-printed silver paste.
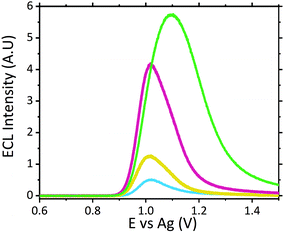
Analysis of neat serum revealed that species intrinsic to the matrix were able to behave as suitable co-reactants producing a measurable signal at potentials similar to that of scopolamine. This is not entirely surprising given the complex composition of serum, containing a wide variety of amino acids and proteins, which have been previously shown to produce ECL with the [Ru(bpy)3]2+ luminophore.44–48 Previous ECL analysis within extracted and purified serum has demonstrated a similar ECL response from serum with the [Ru(bpy)3]2+ luminophore.49 Further analysis of four of the common amino acids; proline, tryptophan, glutamine and lysine with the developed sensor with a supporting electrolyte of LiClO4, revealed their ability to behave as suitable ECL co-reactants, refer to Fig. S2.† As such, the specificity of any ruthenium based ECL sensors’ will be negatively impacted, for biological fluid analysis, due to the presence of free amino acids. Although under ideal electrochemical conditions these free amino acids produced intensities comparable to scopolamine, when compared to the signal intensity observed for raw serum (see Fig. 4) there is a significant difference between this and that of 0.1 μM scopolamine signal. This background response intrinsic to serum can likely be attributed to the low concentration of free amino acids present within serum, which generates this response. A brief investigation across six pooled serum samples demonstrated a degree of variation in the intrinsic background signal, shown in Fig. S3.† With an RSD of 17% across pooled serum samples, there is a high likelihood of the background serum response varying across individuals. This variation could be influence be a person's health, whether blood collection was performed fed or fasted or any medication they are prescribed. This would require a comprehensive clinical study to be performed, and although beyond the scope of this current proof-of-concept study it would be erroneous to not consider the potential impact this could have. Although variation was observed across the pooled serum samples a threshold signal of ∼0.498 A.U. could be established lying well below the lowest concentration of 0.1 μM analysed at an intensity of ∼1.23 A.U. However, this by no means represents a true threshold value, as clinical studies across a range of individuals would be required to establish this.
Although the use of raw serum as a sample matrix without performing any prior purification therefore poses an increased risk of false identification within biological fluids the significant visual difference observed between the matrix without the hallucinogen and with a clinically relevant concentration displays a strong premise for its use as a screening tool for serum samples. Screening protocols rely upon qualitative identification, a prerequisite met by this proposed methodology. Even at significantly low scopolamine concentrations at 0.5 μM and 0.1 μM, which lie below scopolamine's LD50 at an approximate concentration of 6.23 μM,43 an easily identifiable difference between neat serum and that containing the hallucinogen is observed, refer to Fig. 4.
Analysis of the ECL signal in Fig. 4 also reveals a shift in the potential at which the maximum ECL intensity is observed. This phenomenon is something which has been previously reported with increasing concentrations of co-reactants at the ruthenium sensor.24,27 As such, it is likely this observed shift can be attributed to the two main effects previously reported;24,27,50 ruthenium becoming the rate limiting reagent and a pH alternation at the inner Helmholtz plane close to the electrode surface. As the ruthenium within the sensor becomes the rate limiting reagent, oxidation of the species required to produce ECL becomes more difficult with the luminophore consumed at a rate quicker than it can be produced. Secondly, as higher concentrations of scopolamine are present, there is a greater concentration of the oxidative N-dealkylation by-products, formaldehyde and norscopolamine, resulting in a shift in pH at the inner Helmholtz plane.
The signal observed at 0.1 μM lies at the limit of detection (LOD) of ∼1.29 A.U., where the LOD was determined at 3 times the blank signal intensity observed from neat serum (with a serum ECL intensity of ∼0.43 A.U.). As such with a low LOD we are confident in the sensors ability to operate as a qualitative screening tool at clinically relevant concentrations.
Despite the frequent use of blood and subsequently serum for drug detection, the need to separate serum from blood prior to analysis still poses a significant limitation. Furthermore, collection of blood from a patient is an invasive procedure. The extraction of serum from the collected whole blood matrix, requires time consuming sample preparation, specialist equipment and expertise. As such this fails to meet the requirement for point-of-care devices for use by physicians. Although the ability to overcome this sample preparation step through the use of whole blood samples offers a possible solution, the limited penetration of visible light through whole blood prevents detection of the electrogenerated luminescence from the ruthenium complex with an emission maximum at ∼625 nm.51
Urine
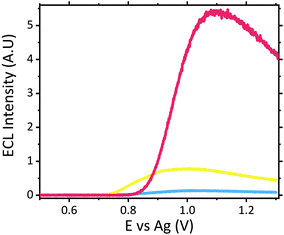
With limited pharmacological studies on scopolamine available, little is known regarding its metabolism and excretion pathways. However current studies do suggest scopolamine undergoes a first pass metabolism, with ∼5% of the parent drug renally excreted. As such it was important to assess sensor performance within this matrix. As with serum no sample preparation was performed, with all samples analysed neat in Suirne™ without dilution or purification. In contrast to serum, urine produced an anodic peak at ∼1.11 V vs. Ag at the unmodified carbon electrode surface, see Fig. S4.† Previous electrochemical analysis of urine has displayed a similar oxidation peak at ∼1.0 V vs. Ag/AgCl![[thin space (1/6-em)]](https://www.rsc.org/images/entities/char_2009.gif) 34 and was attributed to the presence of uric acid, which has previously been shown to undergo oxidation at carbon electrodes.34,52 The same anodic peak is observed at the ruthenium modified electrode, at ∼1.16 V vs. Ag, refer to Fig. S4,† and as such obscures the reversible Ru2+/3+ couple normal observed. The ECL response of the urine matrix, shown in Fig. 5, displays significant background signal from the matrix, comparable to that observed in serum. Previous analysis of urine via ruthenium based ECL sensors has demonstrated an intrinsic emission generated by the matrix,53–55 as such the emission observed here is not unexpected. Although the presence of uric acid produced the oxidation peak within the CV, it has been previously demonstrated that uric acid behaves as an ECL quencher toward the tripropylamine [Ru(bpy)3]2+ system and hence it is not assumed to be responsible for the emission peak observed within the blank urine.55,56 Similarly, urea and ascorbic acid have also shown quenching interreference of [Ru(bpy)3]2+ generated ECL during urine analysis.55–57 As such it is likely that the emission intrinsic to the urine matrix is in fact related to the presence of lactic acid and creatinine, both of which have previously been shown to produce ECL with ruthenium luminophores.48,58–60 Scopolamine hydrobromide was spiked into the urine matrix at a range of clinically relevant concentrations from 0.5 to 6 μM. As can be seen within Fig. 5 a distinct visual difference across all concentrations was apparent, with 6 μM at an ECL intensity ∼5.3 times that of the blank. In comparison to the serum matrix, sensitivity was reduced, with the LOD ten times greater than that of serum. It is thought this could be related to the competing reactions due to the presence of the known quenchers of ascorbic acid, urea and uric acid. However, despite the signals obtained at 0.5 μM and 1 μM being below that of the typical analytical standard of 3 times the blank intensity, if a threshold was established then if the observed intensity was greater than that of the threshold the hallucinogen could be qualitatively identified. Initial studies established the threshold at ∼0.7 V across three electrode measurements. However further investigation would be warranted to determine whether this value would be affected by person to person variation from clinical human urine samples. As such, despite urine being one of the most frequently used toxicological samples for drug detection and negates the requirement for sample extraction, as is required for serum from whole blood, the reduced sensitivity as a result of the competing quenching reactions would limit its use as a point-of-care device in its current format.
34 and was attributed to the presence of uric acid, which has previously been shown to undergo oxidation at carbon electrodes.34,52 The same anodic peak is observed at the ruthenium modified electrode, at ∼1.16 V vs. Ag, refer to Fig. S4,† and as such obscures the reversible Ru2+/3+ couple normal observed. The ECL response of the urine matrix, shown in Fig. 5, displays significant background signal from the matrix, comparable to that observed in serum. Previous analysis of urine via ruthenium based ECL sensors has demonstrated an intrinsic emission generated by the matrix,53–55 as such the emission observed here is not unexpected. Although the presence of uric acid produced the oxidation peak within the CV, it has been previously demonstrated that uric acid behaves as an ECL quencher toward the tripropylamine [Ru(bpy)3]2+ system and hence it is not assumed to be responsible for the emission peak observed within the blank urine.55,56 Similarly, urea and ascorbic acid have also shown quenching interreference of [Ru(bpy)3]2+ generated ECL during urine analysis.55–57 As such it is likely that the emission intrinsic to the urine matrix is in fact related to the presence of lactic acid and creatinine, both of which have previously been shown to produce ECL with ruthenium luminophores.48,58–60 Scopolamine hydrobromide was spiked into the urine matrix at a range of clinically relevant concentrations from 0.5 to 6 μM. As can be seen within Fig. 5 a distinct visual difference across all concentrations was apparent, with 6 μM at an ECL intensity ∼5.3 times that of the blank. In comparison to the serum matrix, sensitivity was reduced, with the LOD ten times greater than that of serum. It is thought this could be related to the competing reactions due to the presence of the known quenchers of ascorbic acid, urea and uric acid. However, despite the signals obtained at 0.5 μM and 1 μM being below that of the typical analytical standard of 3 times the blank intensity, if a threshold was established then if the observed intensity was greater than that of the threshold the hallucinogen could be qualitatively identified. Initial studies established the threshold at ∼0.7 V across three electrode measurements. However further investigation would be warranted to determine whether this value would be affected by person to person variation from clinical human urine samples. As such, despite urine being one of the most frequently used toxicological samples for drug detection and negates the requirement for sample extraction, as is required for serum from whole blood, the reduced sensitivity as a result of the competing quenching reactions would limit its use as a point-of-care device in its current format.
Analysis of artificial saliva
A potential alternative biological matrix which could easily be collected from a patient presenting with symptoms is saliva. Saliva offers a number of advantages over blood and serum as a sample matrix. Collection of saliva can be considered less invasive for patients compared to blood withdrawal or indeed urine collection. What's more saliva, unlike blood, would not require preparation prior to analysis, with visible light able to easily penetrate through the matrix for analyte detection. Previous analysis of saliva via ECL have been reported, however they have required either buffer dilution or incorporation into an immunoassay format, rather than a direct detection method, as proposed here.60–63Compatibility of the proposed ECL sensor for direct saliva analysis was investigated through the use of artificial saliva, containing a number of the active enzymes naturally present within human saliva. Neat artificial saliva did not produce a significant ECL emission as shown by Fig. 6. This is in contrast to human serum and urine (refer to Fig. 4 and 5), where as a result of the free amino acids, lactic acid and creatinine a notable ECL response from the biological matrix is observed. This therefore suggests that the enzymes present within saliva do not behave as suitable co-reactants toward the ruthenium complex utilised within this sensor design. When the artificial saliva sample was spiked with high scopolamine concentrations at 10 μM, a clear visual difference between the neat matrix and that which contains the hallucinogen was observed, refer to Fig. 6. However, this concentration is greater than what would be clinically observed, as such the concentration was decrease to 1 μM to establish the sensors potential for clinical translation. Despite this significant concentration decrease, we can again observe a distinct visual difference between the blank biological matrix and that containing the hallucinogen. In contrast to serum, where a LOD of 0.1 μM was obtained, here the LOD will be approximately ten times greater, comparable to urine analysis, with the 1 μM intensity observed at 4 times that of the blank. This poorer sensitivity within saliva could be attributed to the poorer electron transfer kinetics within this matrix. Saliva compared to serum has a higher viscosity. As such, as can be seen through interrogation of the CV (refer to Fig. S5†), the ruthenium redox couple display flatter and broader peaks with an increased ΔEp of 399 mV. This increase in ΔEp is likely related to the increased resistance of the more viscous matrix toward charge transfer. As such, a large Ohmic drop will be observed, contributing to the large peak-to-peak separation observed. Thus, with the poorer kinetics present within this viscous matrix the decreased sensitivity compared with serum is not surprising. However, the unmistakable difference in ECL intensity at 1 μM does nevertheless meet the requirements for use as a qualitative tool for identification of the hallucinogen within saliva at clinically relevant concentrations. As such, the ECL sensing platform within this contribution meets the prerequisites for use as a saliva screening tool without any pre-treatment or purification required.
Artificial sweat
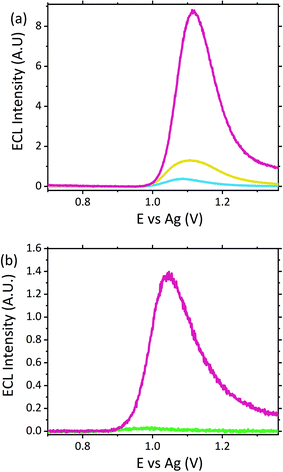
With serum, saliva and urine providing suitable matrices for ECL analysis of biological fluids, the potential for the use of sweat provided a promising avenue. The ability to use sweat for drug screening would offer a minimally invasive technique, which could offer a viable alternative matrix for emergency room physicians. Patients experiencing significant hallucinogenic symptoms, under severe distress or intubated due to respiratory problems could make the collection of serum, urine or saliva for physicians challenging, particularly when rapid answers are required. Thus, sweat which can be easily collected from the skins surface offers a practical alternative. As with the previous matrices sweat itself did produce a small signal, likely related to the presence of the different biological and salt components, including lactic acid previously reported to produce an ECL emission.64–66Fig. 7 shows the ECL response observed when scopolamine was present within artificial sweat at a concentration of 10 μM. Comparable to that observed within saliva, a significant difference between the neat matrix and that containing the hallucinogen was observed. Furthermore, when the concentration was decreased to the clinically relevant concentration of 1 μM, a distinct visual difference at an intensity 3.4 times greater than the blank matrix signal allowed for clear differentiation between the intrinsic matrix signal and that of the hallucinogen. As such, this methodology allowed for confident identification of scopolamine within sweat. However, prior to implementation as a point-of-care device it would be necessary to establish a threshold signal which would account for person to person variation and any further potential interferents as a result of the consumption of medications, alcohol or any others substances a patient may have taken or applied to their skin. As such, to confidently establish such a threshold value further investigation is warranted.
To obtain the signals shown in Fig. 7(a) a casting volume of 100 μL was employed. However, in reality the volume of sweat which would be collected off an individual's skin would be far less. A wearable or surface applied sensor would offer the most appropriate system for future point-of-care devices and would also facilitate continuous real time patient monitoring. To determine the feasibility of this sensor design for incorporation into a wearable device, the sensor was assessed for the collection and detection of scopolamine off synthetic skin. To perform these measurements synthetic skin was either soaked in blank sweat or sweat spiked with scopolamine for approximately 30 minutes, after which the skin was then removed. The skin coated with the sweat was then placed within a petrie dish to provide a flat surface to facilitate the mechanical wiping of the modified electrode. The electrode was slowly wiped across the surface of the skin by hand a total of three times to collect the sample, visually ensuring full electrode coverage prior to analysis. The geometry of the SPE is ideal for such applications due to the close proximity of all three electrodes, with a total area of ∼33 mm2 requiring sample coverage. While the flexible polymer support allows for the electrode to be manipulated with ease avoiding any damage to the electrode surfaces during this process. Despite a significant reduction in the volume of sample present upon the electrode surface, as can be seen within Fig. 7(b), the sample containing the hallucinogen can still be confidently identify from the blank sweat, with a signal intensity ∼47 times greater that of the blank sweat.
As such, this presents a strong proof-of-concept for the developed ECL sensor for employment as a wearable point-of-care device, however further investigation is again warranted to established whether the reported design is appropriate for clinical translation. Preferably human trials would offer the greatest understanding and knowledge regarding potential clinical translation. However, the toxicity of scopolamine and potential side effects at the required levels would prevent such trials, in turn preventing the attainment of genuine sweat samples from human skin following indigestion, metabolism and execration of the drug. Nevertheless, the successful use of ruthenium based ECL sensors for the analysis of human sweat on skin and off surfaces have been recently reported,65,66 and as such provides us with a degree of confidence that the proposed sensor within this contribution would be fundamentally viable for clinical use.
Conclusions
A portable electrochemilunescent sensor has been successfully developed for the detection of tropane alkaloid scopolamine within a variety of complex biological matrices. Utilising disposable screen-printed electrodes modified with a simple Nafion-[Ru(bpy)3]2+ film, a low-cost alternative to the complex instrumentation currently utilised for analysis of such samples is offered. Here we propose a timely qualitative sensor for screening of the consumption of non-traditional drugs, such as novel psychoactive substances, alongside common illicit substances which may be encountered within an hospital emergency room. Within such clinical environments an easily obtained and rapid “yes or no” answer is often required, a criterion met by our proposed methodology. Despite the complex nature of matrices such as serum, urine, saliva and sweat, we did not observe any significant interference effects which negatively impacted upon our qualitative analysis at clinically relevant concentrations. As such we were able to confidently identify between neat matrices and those containing the hallucinogen. What's more, we have been able to remove the requirement for complex, time-consuming and costly sample extraction procedures which would require specialist facilities and knowledgeable experts in variety of sample extraction techniques. Further to this, we have developed a simplistic sensing system capable of detecting low volumes of a species from a biological surface such as artificial skin. The proof-of-concept demonstrated within this contribution is strong, however further testing of the sensor is warranted. Although this contribution only discusses the identification of scopolamine, previous reports have demonstrated how this sensor alongside similar systems have been employed for the detection of other structurally similar amines, including atropine and methamphetamine.24,27,29 As such, this sensor could be applied for the detection of species other than scopolamine within these biological matrices with ease. However, this also proposes a question of potential interreference effects from structurally similar species. Further investigations into the impact of other commonly consumed substances such as medication, nicotine or alcohol would therefore also be pertinent. Current investigations into the ability to negate the interference effects from structurally similar species such as amino acids and atropine is on-going, and includes examination of alternative metal luminophores, with preliminary results suggesting the ability to switch off emission from interfering species is possible. While the ability to differentiate between species via pH controlled ECL has been previously demonstrated.24 Ultimately, enhancing the specificity of the sensor would only stand to improve its design and hence increase its potential toward clinical translation. Current analysis has been performed on simulated scenarios utilising artificial sweat, skin and saliva. In order to gain a greater understanding of the applicability of the current sensor design for employment within patient care it would be necessary to test the sensor upon clinical samples obtained following scopolamine consumption. The toxicity of scopolamine makes testing of the sensor under real-world conditions challenging. To combat this, there is the potential to utilise more commonly encounter species which produce ECL emission within the same region. We have previously reported that compounds with structural similarities, such as sister tropane alkaloid atropine, produce similar ECL signals within the same potential region.23,24 As such the use of a structurally similar species such as nicotine, another alkaloid known to produce an ECL signal within sweat66 could offer a viable solution. Allowing for the assessment of additional interferent effects on the sensor due to other components excreted within sweat or saliva not considered within this current contribution. Nevertheless, the current sensor design within the contribution demonstrates a promising avenue toward the expansion of ECL based sensors as point-of-care devices.Conflicts of interest
There are no conflicts to declare.Acknowledgements
The authors would like to thank the Carnegie Trust for the Universities of Scotland for financially supporting this research.The artificial biological samples were all purchased from Sigma Aldrich and the artificial saliva (Bioténe® oral balance gel) was purchased from Boots Ltd.
Notes and references
- United Nations Publication, World Drug Report 2018, https://www.unodc.org/wdr2018/prelaunch/WDR18_Booklet_1_EXSUM.pdf, (accessed 9th October, 2018).
- L. Shaw and L. Dennany, Curr. Opin. Electrochem., 2017, 3, 23–28 CrossRef CAS
.
- J. Tettey and C. Crean, Philos. Trans. R. Soc., B, 2015, 370, 20140265 CrossRef PubMed
.
- K. E. Grafinger, M. E. Liechti and E. Liakoni, Br. J. Clin. Pharmacol., 2020, 86, 429–436 CrossRef PubMed
.
- M. Fagiola, T. Hahn and J. Avella, J. Anal. Toxicol., 2018, 42, 562–569 CrossRef CAS PubMed
.
- A. Helander, M. Bäckberg, P. Hultén, Y. Al-Saffar and O. Beck, Forensic Sci. Int., 2014, 243, 23–29 CrossRef CAS PubMed
.
- O. Beck, L. Rausberg, Y. Al-Saffar, T. Villen, L. Karlsson, T. Hansson and A. Helander, Drug Test. Anal., 2014, 6, 492–499 CAS
.
- W. Miao, Chem. Rev., 2008, 108, 2506–2553 CrossRef CAS PubMed
.
- M. M. Richter, Chem. Rev., 2004, 104, 3003–3036 CrossRef CAS PubMed
.
- C. K. P. Truong, T. D. D. Nguyen and I.-S. Shin, BioChip J., 2019, 13, 203–216 CrossRef CAS
.
- W. Gao, S. Jeanneret, D. Yuan, T. Cherubini, L. Wang, X. Xie and E. Bakker, Anal. Chem., 2019, 91, 4889–4895 CrossRef CAS PubMed
.
-
A. J. Bard, L. R. Faulkner, J. Leddy and C. G. Zoski, Electrochemical methods: fundamentals and applications, wiley New York, 1980 Search PubMed
.
- S. Reichert, C. Lin, W. Ong, C. C. Him and S. Hameed, Can. Fam. Physician., 2017, 63, 369–370 Search PubMed
.
- L. Fernández-López, M. Falcón Romero, G. Prieto-Bonete, C. Pérez-Martínez, J. Navarro-Zaragoza, D. Suarez and A. Luna Maldonado, Forensic Sci. Int., 2018, 287, e10 CrossRef PubMed
.
- E. Le Garff, Y. Delannoy, V. Mesli, V. Hédouin and G. Tournel, Forensic Sci. Int., 2016, 261, e17–e21 CrossRef CAS PubMed
.
- K. J. Lusthof, I. J. Bosman, B. Kubat and M. J. Vincenten-van Maanen, Forensic Sci. Int., 2017, 274, 79–82 CrossRef CAS PubMed
.
- O. M. Vallersnes, C. Lund, A. K. Duns, H. Netland and I.-A. Rasmussen, Clin. Toxicol., 2009, 47, 889–893 CrossRef CAS PubMed
.
- BBC News, Woman in court over alleged murder and poisoning, https://www.bbc.co.uk/news/uk-england-london-51123944, (accessed 6th April 2020).
- J. Sáiz, T. D. Mai, M. L. López, C. Bartolomé, P. C. Hauser and C. García-Ruiz, Sci. Justice, 2013, 53, 409–414 CrossRef PubMed
.
- U. D. Renner, R. Oertel and W. Kirch, Ther. Drug Monit., 2005, 27, 655–665 CrossRef CAS PubMed
.
- H. Chen, Y. Chen, H. Wang, P. Du, F. Han and H. Zhang, Talanta, 2005, 67, 984–991 CrossRef CAS PubMed
.
-
S. F. Malamed, in Sedation, ed. S. F. Malamed, Mosby, Saint Louis, 5th edn, 2010, pp. 316–354. DOI:10.1016/B978-0-323-05680-9.00029-1.
.
- K. Brown, M. McMenemy, M. Palmer, D.W. Robinson, M. J. Baker, P. Allan and L. Dennany, Anal. Chem., 2019, 91, 12369–12376 CrossRef CAS PubMed
.
- K. Brown, C. Jacquet, J. Biscay, P. Allan and L. Dennany, Anal. Chem., 2020, 92, 2216–2223 CrossRef CAS PubMed
.
- S. Caporali and U. Bardi, Corrosion, 2012, 68, 025001–025001 CrossRef
.
- ISO, International Organisation for Strandardization standard, 3160-2, 2015.
- K. Brown, M. McMenemy, M. Palmer, M. J. Baker, D. W. Robinson, P. Allan and L. Dennany, Anal. Chem., 2019, 91, 12369–12376 CrossRef CAS PubMed
.
- E. J. O'Reilly, P. J. Conroy, S. Hearty, T. E. Keyes, R. O'Kennedy, R. J. Forster and L. Dennany, RSC Adv., 2015, 5, 67874–67877 RSC
.
- J. McGeehan and L. Dennany, Forensic Sci. Int., 2016, 264, 1–6 CrossRef CAS PubMed
.
- E. J. O'Reilly, T. E. Keyes, R. J. Forster and L. Dennany, Electrochem. Commun., 2018, 86, 90–93 CrossRef
.
- A. Zhang, C. Miao, H. Shi, H. Xiang, C. Huang and N. Jia, Sens. Actuators, B, 2016, 222, 433–439 CrossRef CAS
.
- A. Devadoss, L. Dennany, C. Dickinson, T. E. Keyes and R. J. Forster, Electrochem. Commun., 2012, 19, 43–45 CrossRef CAS
.
- R. Russell, A. J. Stewart and L. Dennany, Anal. Bioanal. Chem., 2016, 408, 7129–7136 CrossRef CAS PubMed
.
- T. da Costa Oliveira, M. H. P. Santana, C. E. Banks, R. A. A. Munoz and E. M. Richter, Electroanalysis, 2019, 31, 567–574 CAS
.
- A. Florea, J. Schram, M. de Jong, J. Eliaerts, F. Van Durme, B. Kaur, N. Samyn and K. De Wael, Anal. Chem., 2019, 91, 7920–7928 CrossRef CAS PubMed
.
- Y. Gao, Y. Tian and E. Wang, Anal. Chim. Acta, 2005, 545, 137–141 CrossRef CAS
.
- L. Jianguo, C. Yuan and J. Huangxian, Electroanalysis, 2007, 19, 1569–1574 CrossRef
.
- B. Yuan, C. Zheng, H. Teng and T. You, J. Chromatogr. A, 2010, 1217, 171–174 CrossRef CAS PubMed
.
- B. L. Laube, M. R. Asirvatham and C. K. Mann, J. Org. Chem., 1977, 42, 670–674 CrossRef CAS
.
- L. C. Portis, V. V. Bhat and C. K. Mann, J. Org. Chem., 1970, 35, 2175–2178 CrossRef CAS
.
- L. Dennany, Z. Mohsan, A. L. Kanibolotsky and P. J. Skabara, Faraday Discuss., 2014, 174, 357–367 RSC
.
- J. Sangster, LOGKOW Data Base. Montreal, Quebec, Canada: Sangster Res Lab, 1994 Search PubMed.
- C. L. Winek, W. W. Wahba, C. L. Winek and T. W. Balzer, Forensic Sci. Int., 2001, 122, 107–123 CrossRef CAS PubMed
.
-
K. Mariño, R. Saldova, B. Adamczyk and P. M. Rudd, in Carbohydrate Chemistry, The Royal Society of Chemistry, 2012, vol. 37, pp. 57–93 Search PubMed
.
- L. Dennany, E. J. O'Reilly, T. E. Keyes and R. J. Forster, Electrochem. Commun., 2006, 8, 1588–1594 CrossRef CAS
.
- J. Perła-Kaján, T. Twardowski and H. Jakubowski, Amino Acids, 2007, 32, 561–572 CrossRef PubMed
.
- H. Xie, X. Li, L. Zhao, L. Han, W. Zhao and X. Chen, Sens. Actuators, B, 2016, 222, 226–231 CrossRef CAS
.
- H. Hosono, W. Satoh, J. Fukuda and H. Suzuki, Sens. Actuators, B, 2007, 122, 542–548 CrossRef CAS
.
- Y. Hu, W. Xu, J. Li and L. Li, Luminescence, 2012, 27, 63–68 CrossRef CAS PubMed
.
- L.-H. Shen, H.-N. Wang, P.-J. Chen, C.-X. Yu, Y.-D. Liang and C.-X. Zhang, J. Food Drug Anal., 2016, 24, 199–205 CrossRef CAS PubMed
.
- A. J. Stewart, J. Hendry and L. Dennany, Anal. Chem., 2015, 87, 11847–11853 CrossRef CAS PubMed
.
- J. L. Owens, H. A. Marsh and G. Dryhurst, J. Electroanal. Chem. Interfacial Electrochem., 1978, 91, 231–247 CAS
.
- Y.-M. Liu, W. Tian, Y.-X. Jia and H.-Y. Yue, Electrophoresis, 2009, 30, 1406–1411 CrossRef CAS PubMed
.
- X. Sun, J. Liu, W. Cao, X. Yang, E. Wang and Y. S. Fung, Anal. Chim. Acta, 2002, 470, 137–145 CrossRef CAS
.
- Y. Tao, X. Zhang, J. Wang, X. Wang and N. Yang, J. Electroanal. Chem., 2012, 674, 65–70 CrossRef CAS
.
- J. Ballesta-Claver, R. Rodríguez-Gómez and L. F. Capitán-Vallvey, Anal. Chim. Acta, 2013, 770, 153–160 CrossRef CAS PubMed
.
- F. Takahashi and J. Jin, Luminescence, 2008, 23, 121–125 CrossRef CAS PubMed
.
- W. Satoh, H. Hosono and H. Suzuki, Anal. Chem., 2005, 77, 6857–6863 CrossRef CAS PubMed
.
- D. An, Z. Chen, J. Zheng, S. Chen, L. Wang, Z. Huang and L. Weng, Food Chem., 2015, 168, 1–6 CrossRef CAS PubMed
.
- J. Ballesta Claver, M. C. Valencia Mirón and L. F. Capitán-Vallvey, Analyst, 2009, 134, 1423–1432 RSC
.
- Z.-Y. Shang, C.-F. Han and Q.-J. Song, Chin. J. Anal. Chem., 2014, 42, 904–908 CAS
.
- Y. Yao, H. Li, D. Wang, C. Liu and C. Zhang, Analyst, 2017, 142, 3715–3724 RSC
.
- Z. Zhou, L. Xu, S. Wu and B. Su, Analyst, 2014, 139, 4934–4939 RSC
.
- X. Cai, J. Yan, H. Chu, M. Wu and Y. Tu, Sens. Actuators, B, 2010, 143, 655–659 CrossRef CAS
.
- M.-M. Chen, S.-B. Cheng, K. Ji, J. Gao, Y.-L. Liu, W. Wen, X. Zhang, S. Wang and W.-H. Huang, Chem. Sci., 2019, 10, 6295–6303 RSC
.
- S. Li, Y. Lu, L. Liu, S. S. Low, B. Su, J. Wu, L. Zhu, C. Li and Q. Liu, Sens. Actuators, B, 2019, 285, 34–41 CrossRef CAS
.
Footnote |
| † Electronic supplementary information (ESI) available. See DOI: 10.1039/d0an00846j |
| This journal is © The Royal Society of Chemistry 2020 |

