
Quantum dot to quantum dot Förster resonance energy transfer: engineering materials for visual color change sensing†
Margaret
Chern
 a,
Reyhaneh
Toufanian
a and
Allison M.
Dennis
*ab
a,
Reyhaneh
Toufanian
a and
Allison M.
Dennis
*ab
aMaterials Science and Engineering, Boston University, Boston, MA, 02215 USA. E-mail: aldennis@bu.edu
bBiomedical Engineering, Boston University, Boston, MA, 02215 USA
First published on 17th July 2020
Abstract
In this work, quantum dots (QDs) of various heterostructured compositions and shell thicknesses are used as Förster or fluorescence resonance energy transfer (FRET) donors and acceptors to optimize QD–QD FRET sensing through materials design. While several reports have highlighted the advantages of using QD–dye, rather than dye–dye, FRET in sensing applications, QD–QD FRET has lagged behind in development as a result of high background signal from direct acceptor excitation. However, in designing sensors for longitudinal studies, QD–dye sensors are limited by the photostability of the fluorescent dye. While fluorescence generally affords higher sensitivity than absorbance-based readouts, the instrumentation needed for detecting fluorescence can be expensive, motivating the development of sensors bright enough to be seen by eye or imaged with cheap consumer electronics. Harnessing the exceptional brightness of QDs, our study focuses on the development of QD–QD FRET pairs where color change is achieved for visual readout and instrument-free sensing. We demonstrate that bulk semiconductor material characteristics can be used to a priori predict and tailor the behavior of QD–QD FRET systems, and our findings show that it is possible to create QD donors that are brighter than their acceptors through concerted compositional and morphological choices in heterostructured QDs. This is significant for developing visual sensors, as we show that the most profound color change occurs when the direct acceptor emission is lower than that of the donor. Finally, the use of an optimal cadmium-free QD–QD FRET pair is presented in a pH sensor that shows a large range of pH-dependent color change with bright, instrument-free readout.
Introduction
Semiconductor quantum dots (QDs) are effective fluorescent labels due to their outstanding brightness as well as exceptional chemical- and photostability;1 their use as donors in Förster resonance energy transfer (FRET)-based biosensors has been particularly successful. FRET is a non-radiative dipole–dipole energy transfer that results in donor fluorescence quenching and acceptor brightening. By looking at the change in acceptor to donor emission, ratiometric sensors can be designed.2–4 Using ratiometric output for sensing is advantageous as it is self-calibrating and therefore less sensitive to fluctuations in sensor environment.5The majority of QD-based FRET sensors use a QD as a donor to a fluorescent protein (FP) or dye (FD) acceptor.6–13 These have several photophysical advantages over FRET systems using only FPs and/or FDs. Broadband QD absorbance in the UV enables selective excitation of QD donors, whereas the comparatively narrow absorbance bands exhibited by FPs and FDs often leads to direct excitation of the acceptor. In contrast, QD–QD FRET has not been as well explored as QD–FP(D) FRET for sensing applications.14,15 The broadband nature of QD absorbance profiles makes direct excitation unavoidable, confounding analyses based on the observation of sensitized emission from the acceptor. This issue can be circumvented by evaluating changes in the donor fluorescence lifetime instead, as it is not directly impacted by high acceptor background signal, but the experimental setup and analysis of these measurements can be more difficult and time consuming than collecting and analyzing spectral data. Furthermore, PL lifetime instrumentation is less ubiquitous and rarely outfitted with plate readers that facilitate measurement of many sample conditions. More recently, QDs have been used very successfully as FRET acceptors for lanthanide complexes.16 In these systems, time-gated PL measurements can be used which are much simpler than lifetime measurements and available with many commercial plate readers.
However, due to their exceptional brightness, the development of QD–QD FRET for point-of-care sensors (POCs) with easy to read visual output could be of interest—specifically, sensors exhibiting visible color change. POCs are portable devices meant for fast diagnostic screening at or near the patient site of care. To truly make an impact, sensors of this type should not only be fast and accurate, but also cheap and easy to use.17 For POCs that use FDs, both colorimetric and fluorescence read-out can be achieved, with fluorescent read-out often being more sensitive.18,19 However, the instrumentation needed for the detection of fluorescence can be expensive, motivating the development of POCs bright enough to be seen by eye or imaged by cheap consumer electronics.20 In this area, the enhanced brightness and stability of QDs would be a huge advantage. Extrapolating the benefits of ratiometric sensing, using QD–QD FRET for color change may hold potential in further increasing sensitivity and improving sensor robustness. Therefore, we focus on developing material systems where color change is observed upon the induction of FRET. To achieve this, several QD–QD FRET pairs were synthesized and tested in aggregation-based FRET assays. Their spectral outputs were compared, and we show that it is possible to create a QD–QD FRET system that exhibits visual color change.
We examine energy resonance transfer from a donor QD to an acceptor QD through both PL intensity and PL lifetime. Previous reports of QD–QD FRET most often focus on fundamental photophysical observations,21–33 but several describe sensing applications as well.34–37 The vast majority of the reports use red- and green-emitting semiconductor nanocrystals comprising the same material—i.e., both donor and acceptor QDs are CdSe23,27,35,38 or CdTe.26,29,39 Composition-consistent examples suffer from fundamental limitations in their optimization and applications. Specifically, because the absorption cross-section of the larger, redder-emitting acceptor QD is by definition higher than that of the smaller, bluer-emitting donor QD, the background due to direct acceptor excitation can overwhelm the system, making PL intensity measurements challenging to interpret.14 We hypothesize that tuning the relative absorbances of the donor and acceptor using different compositions of QDs would enhance preferential donor excitation sufficiently for PL-based observations of QD–QD FRET. Furthermore, heterostructured QDs exhibiting increasing absorption cross-sections with thicker shells6 may be leveraged to promote preferential excitation of the donor QDs over acceptor QDs.
Results and discussion
Resonance energy transfer efficiency is influenced by the quantum yield (QY) of the donor (ΦD), the molar extinction coefficient of the acceptor (εA), and the donor–acceptor distance (rDA). The visual output of the sensor is dependent on the relative brightness of the donor and acceptor, which means that the donor absorptivity (εD) and acceptor QY (ΦA) are relevant as well. In this study, we utilized multiple donor and acceptor QDs to vary these specific parameters. We discuss the observed differences in energy transfer and photoluminescence (PL) spectra and link these to theoretical foundations of energy transfer to establish a better understanding of how material choices influence energy transfer efficiency and the visual output of QD–QD energy transfer.Quantum dot donors and acceptors
Using established protocols,6,40,41 we synthesized donor and acceptor QDs exhibiting green (510–560 nm) and red (650 nm) emission with minimal emission peak overlap using both CdSe and InP cores. These wavelengths were chosen to facilitate the creation of visual sensors with colors that are clearly distinguishable by eye. The CdSe-based donor is a core-alloyed-shell CdxZn1−xSeyS1−y QD (D1) with a thick enough shell to maintain its QY after ligand exchange for water solubility; this thick shell also makes it the largest QD used in the study at ∼10 nm in diameter. Three InP-based donors were synthesized using InP cores with different core/shell and core/shell/shell structures of varying ZnSe shell thickness controlled through successive ion layer adsorption and reaction (SILAR)-based shell depositions. The sample with no ZnSe (D2, InP/7ZnS, where 7 indicates the number of rounds of SILAR deposition) is completely comprised of ZnS, while QDs with thin (D3) and thick (D4) ZnSe shells were synthesized through 4 and 7 SILAR rounds, respectively, before ZnS capping (Table 1). The red acceptor QD (InP/3ZnS) was designed to be relatively small, with only the necessary shells to ensure PL in aqueous media.| Heterostructureb | PLmax (nm) | FWHM (nm) | ε 400 (M−1 cm−1) | Radiusd (nm) | Φ CHCL3 (%) | Φ H2O (%) | BH2Of ×103 | |
|---|---|---|---|---|---|---|---|---|
| a Used as the acceptor QD; all other samples were used as donors. b QD composition. The first QD is an alloyed structure that forms a CdSe/ZnS QD with an alloyed interface based on the differential reactivities of the precursor materials; remaining heterostructures formed through SILAR deposition of shells on pre-made cores. The numbers before the shell compositions indicate the number of rounds of SILAR deposition, not final yield of shelling reaction. c ε 400 determined using published empirical equations correlating 1s peak position to core size and ε1s to map ε to the entire QD absorption spectrum. d Sizing based on TEM images (n = 76–212). e Absolute quantum yield measurements taken with an integrating sphere. f QD brightness in water calculated by multiplying ε400 and ΦH2O and rounding to the nearest thousand. | ||||||||
| D1 | CdxZn1−xSeyS1−y | 510 | 30 | 170![[thin space (1/6-em)]](https://www.rsc.org/images/entities/char_2009.gif) 000 000 |
5.0 ± 0.6 | 30.2 ± 1.0 | 28.9 ± 0.3 | 49 |
| D2 | InP/7ZnS | 560 | 63 | 360000 |
2.2 ± 0.3 | 11.7 ± 2.5 | 0.7 ± 0.3 | 3 |
| D3 | InP/4ZnSe/3ZnS | 555 | 61 | 940000 |
2.0 ± 0.2 | 17.0 ± 1.3 | 4.2 ± 0.6 | 40 |
| D4 | InP/7ZnSe/3ZnS | 560 | 47 | 2400000 |
2.3 ± 0.3 | 16.1 ± 0.2 | 4.6 ± 0.2 | 110 |
| A1 | InP/3ZnSa | 650 | 69 | 1100000 |
1.7 ± 0.2 | 14.6 ± 0.7 | 1.4 ± 0.2 | 15 |
Absorbance and PL were measured with optical and fluorescence spectroscopy, respectively. Transmission electron microscopy images were analyzed to determine the size of the semiconductor particles (Table 1 and Fig. S1†). Assessment of fluorophore brightness and FRET parameters relies on converting the absorbance spectra to wavelength-dependent molar extinction coefficients, ελ. The precise determination of ε requires carefully taken absorbance measurements, elemental analysis, and TEM imaging/sizing of each QD sample, which can be both time and material consuming. Alternative methods for estimating ε have been reported but, depending on the approach, may only apply to QDs of a specific composition or synthesized in a specific manner.42–44 For example, if theoretical calculations are used, the amount of error associated with the calculation of different material types and heterostructures can differ, making comparison between systems difficult. Our estimation of ε assumed that the location of the QD first absorption peak (1s peak) is dictated by the size of its core. All of the QDs used in this study exhibit Type-I band alignments where the lowest energy gap is not substantively affected by shell size,40 making this an acceptable approximation. For each QD, the molar extinction coefficient at the 1s peak was estimated using previously reported empirical fit formulas for core-only QDs of the appropriate material45 and scaling the absorption spectra to this point to determine the molar extinction coefficients for the full absorption spectrum.35 It should be noted that this approximation may be less accurate for the alloyed CdSe donor, CdxZn1−xSeyS1−y, as its core is not as well defined.
Inducing QD–QD FRET with pH dependent aggregation assays
To efficiently compare QD–QD FRET pairs, we needed a simple and efficient way to induce FRET. Unfortunately, while a few examples exist,35,46 it is non-trivial to link two QDs in a precisely controlled manner.14 In FRET systems employing QDs paired with molecular species, the large surface area of the QD acts as a scaffold for the attachment of multiple moieties, each of which can only bind a single QD. Well-established methods12,47,48 for linking dyes, fluorescent proteins, or lanthanide complexes to QDs for biosensing include histidine based self-assembly49,50 and traditional covalent coupling methods such as carbodiimide crosslinking.51 In QD–QD FRET, both the acceptor and donor present multiple binding sites, which can cause unwanted and inhomogeneous aggregation,52 limiting assay reproducibility. As an alternative to directed conjugation of QD donors and acceptors, previous reports indicate that QD–QD FRET can be induced by aggregating the nanoparticles in either organic22 or aqueous39 solution. While perhaps less controlled, aggregation-based assays benefit from the simplicity of their preparation.FRET is a highly distance-dependent phenomenon whereby the energy transfer efficiency (E) is proportional to the donor–acceptor distance (rDA) to the inverse sixth power, i.e., E ∝ rDA−6. In a well-dispersed solution, the QDs are too far apart for FRET to occur, whereas after aggregation, they are extremely close, facilitating energy transfer. We performed our aggregation studies in aqueous media, inducing clustering of QDs coated with a dithiolate zwitterion called compact ligand 4 (CL4)53 through a change in pH (Fig. 1). The colloidal stability of CL4-coated QDs from pH 5–13 is imparted through charge–charge repulsion and, therefore, highly affected by the protonation state of two carboxyl groups that impart the particle hydrophilicity.53 For the aggregation assay, we compared well-dispersed QDs in phosphate buffered saline (PBS), pH 7.4 (no FRET), to aggregated QDs in citrate buffer, pH 3.5 (FRET). We confirmed aggregation through DLS at neutral and acidic pHs (Fig. 1A and B), PL spectra of dispersed and aggregated QDs (Fig. 1C and D), and PL decays (donor lifetimes, Fig. S2†) of select pairs. To circumvent potential errors arising from the molar extinction coefficient estimations and to facilitate the rapid screening of a number of different QD–QD FRET pairs, the ratio of acceptors to donors was pegged to the ratio of their absorbances at 400 nm, rather than molar ratio.
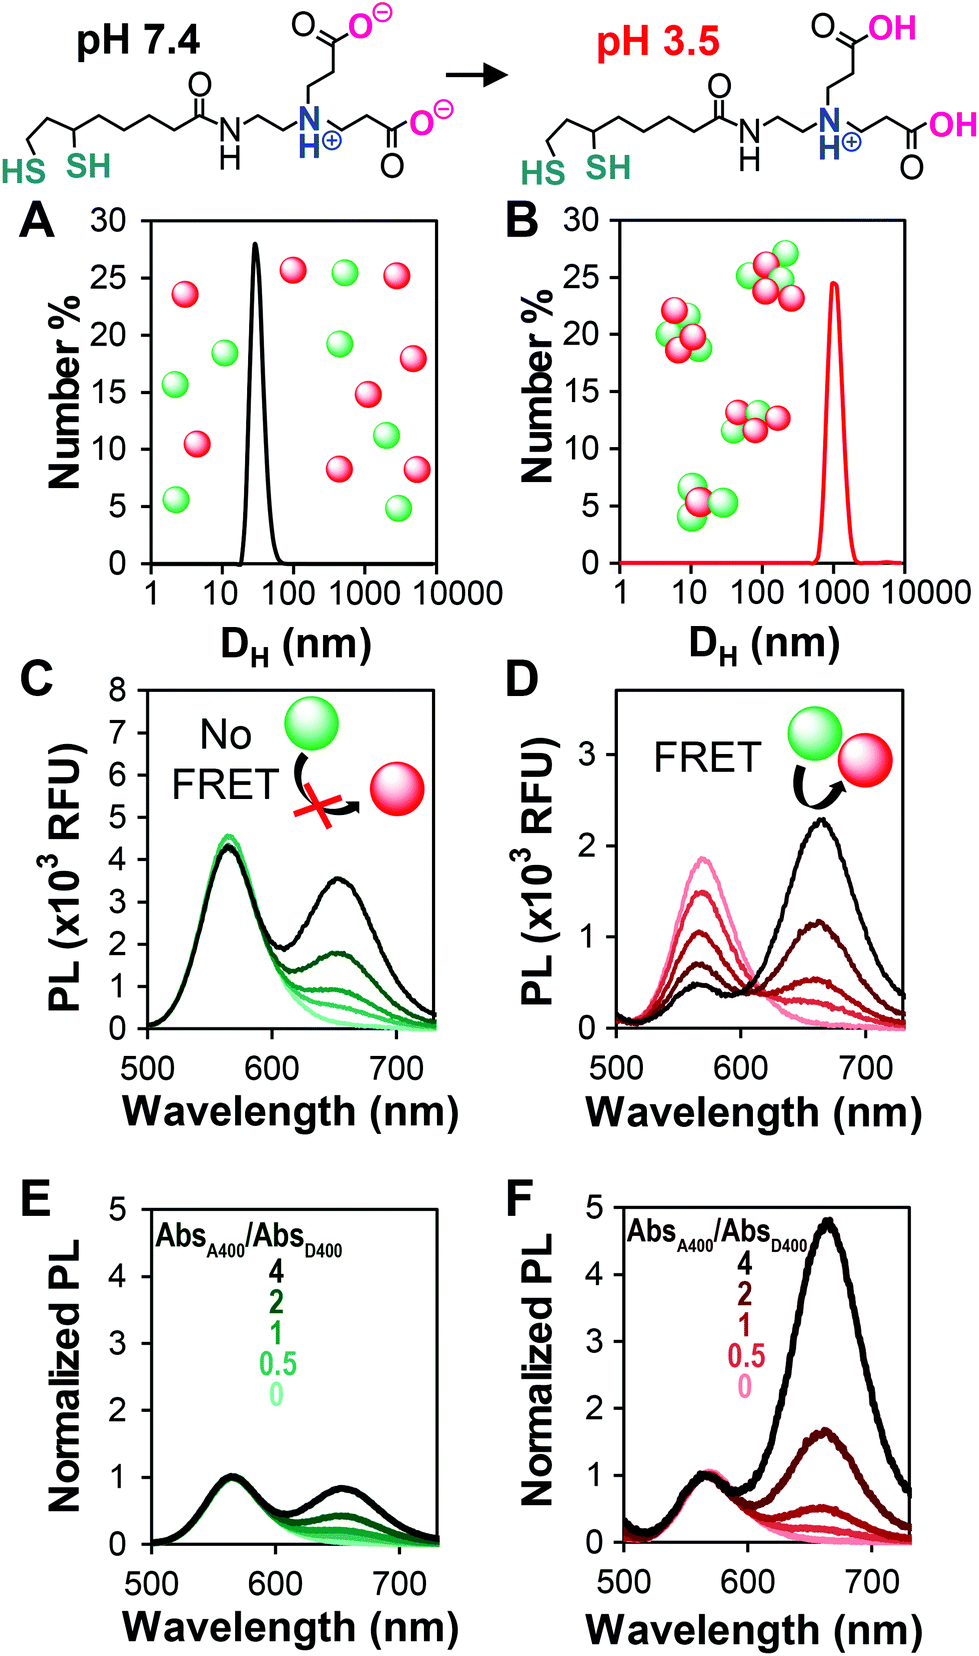 | ||
| Fig. 1 Representative data from a QD–QD aggregation assay. CL4 is used to impart water solubility to the QDs. At pH 7.4 (top-left), the carboxyl groups on CL4 are predominantly negatively charged, while they are protonated at pH 3.5 (top-right). This causes aggregation as indicated by DLS measurements of QD solutions at (A) pH 7.4 and (B) pH 3.5. The photoluminescence (PL) of mixed solutions in (C) dispersed and (D) aggregated states with the acceptor to donor absorbance ranging from 0, 0.5, 1, 2, to 4, as indicated by the light to dark transition in trace color. The difference in the y-axis ranges in C and D arises from the self-quenching/homoFRET of the donor when aggregated, resulting in lower donor emission even in the absence of the acceptor. (E, F) When the spectra in C and D are normalized to the donor peak height, the enhancement in the acceptor emission and the change in ratio between the donor and acceptor peak intensities is apparent. Data shown use an InP-based QD with a thin ZnSe shell (D3) as the donor. | ||
Addition of increasing amounts of the acceptor QD increases the intensity of the acceptor peak emission arising from direct acceptor emission. As long as the overall assay concentration is moderate and the particles are well-dispersed, the donor peak intensity does not change with the addition of the acceptor (Fig. 1C). Aggregation of the particles causes a decrease in the donor emission relative to the dispersed state due to collisional quenching and donor–donor FRET (a.k.a. homoFRET). When acceptor QDs are co-aggregated with the donors, FRET between the two species is evident through the acceptor concentration-dependent quenching of the donor. The acceptor emission intensity increases significantly due to the energy received from the donor (Fig. 1D). By normalizing the spectra of the dispersed and aggregated mixtures to the donor peak intensity, it is easier to see how the acceptor emission dominates the PL spectra in the aggregated/FRET case (Fig. 1E and F). This transition from donor-dominant to acceptor-dominant fluorescence is the key to the visual FRET sensor.
Most assays had an acceptor to donor absorbance ratio (AbsA400/AbsD400) of 0 to 4, but in assays that used D1, whose QY was very high compared to that of the acceptor, the ratio was extended from 0 to 40. Depictions of the PL spectra and acceptor/donor fluorescence intensity ratio (Fa/Fd) for all assays is comprehensively depicted in the ESI (Table S1†).
Linking fluorimeter output with color change
For potential point of care (POC) applications, it is important for sensor readouts to be fast and easy to decipher.54 Previous reports have shown that large changes in brightness can be used for visual detection,6 but color change is an additional way to provide such a read-out.29 In order to optimize QD–QD FRET for color change, we correlated the color change observed in digital images of the aggregation assays with PL spectra of the same samples (Fig. 2). Color can also be directly calculated by using color matching functions and mapping the emission spectrum to a standard color space (Fig. 2D and E).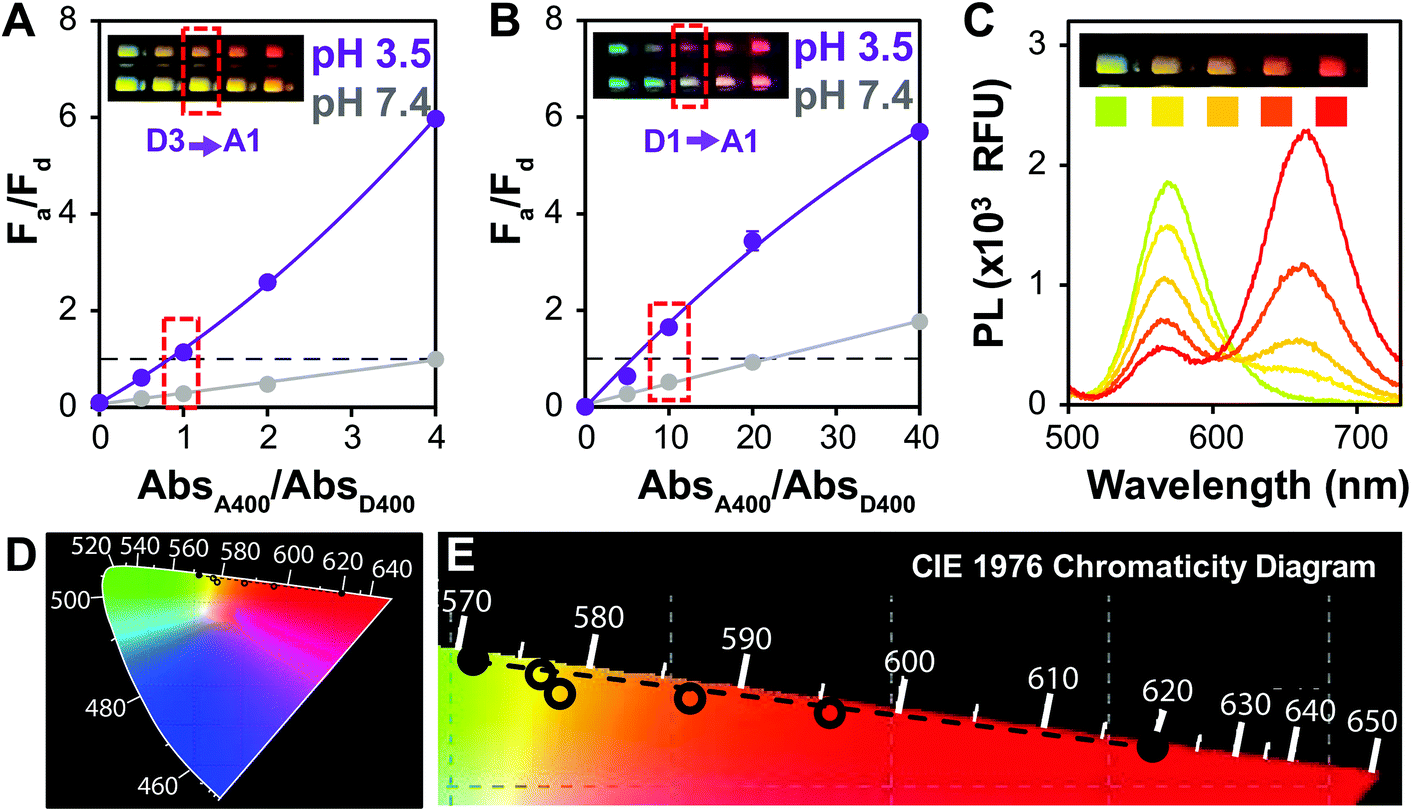 | ||
| Fig. 2 Transition from Fa/Fd < 1 to Fa/Fd > 1 facilitates visual color change. Fa/Fd plots for QD–QD pairs using (A) D3 and (B) D1. Images of the wells measured are shown as insets to correlate color with PL. Dashed horizontal line indicates Fa/Fd = 1. The point at which clear color change is visible is boxed in red in the plots as well as in the inset images. Mean ± SD, n = 3. (C) PL spectra and plate assay image (inset) of the aggregated system using D3 as a donor. Colored squares under each well are colors determined by mapping the PL intensity to the (D) CIE1976 chromaticity diagram. (E) The chromaticity diagram is enlarged and cropped to show the colors calculated from the FRET assay (open circles), which fall along the line between the donor and acceptor emission colors (solid circles). | ||
To investigate color change, we examine the ratio of the donor and acceptor emission intensities (Fa/Fd), which in this case is effectively the ratio of red to green PL intensity. In the two examples shown in Fig. 2, the color difference between the donors (greenish yellow vs. bluish green for D3 and D1, respectively), yields visual color outputs that are noticeably different for the two pairs. When using D3 (Fig. 2A), the Fa/Fd of the non-aggregated samples is <1 for all absorbance ratios tested. In this case, visible color change emerges in wells with Fa/Fd > 1 after aggregation; the most visible color change corresponded to the largest ΔFa/Fd. When using D1, no color change was seen when AbsA400/AbsD400 < 4. However, the Fa/Fd in the unaggregated system was still very low (<0.2), so the assay was repeated with the donor diluted by a factor of 10 to obtain AbsA400/AbsD400 = 0, 5, 10, 20 and 40. In this case, Fa/Fd at pH 7.4 was ≥1 when AbsA400/AbsD400 ≥ 20. Although the ΔFa/Fd is greatest at the highest acceptor to donor ratio (40×), color change is difficult to discern. Because Fa/Fd > 1 before aggregation, the acceptor emission color is already well represented both in the spectrum and visual presentation. Thus, when aggregation promotes FRET, there is perhaps an intensity change, but no visible color change. In contrast, when AbsA400/AbsD400 = 10, Fa/Fd is <1 at pH 7.4 and >1 at pH 3.5; although the ΔFa/Fd is lower than when AbsA400/AbsD400 > 20, color change was easiest to discern using the 10× ratio. Looking across multiple samples, the change from Fa/Fd ≤ 1 to Fa/Fd > 1 was a consistent criterion for visual detection of color change. This benchmark is used in future discussion, and therefore the Fa/Fd = 1 line is clearly marked for ease of data interpretation.
For the assays discussed in this section, quenching of the donor is seen when titrating the system with an acceptor at pH 7.4, indicating that inner filter effects and/or collisional quenching were present (Table S1†).55 In the following sections, the donor and acceptor concentrations were decreased by a factor of 5, and this phenomenon was significantly reduced or eliminated, except in the cases where AbsA400/AbsD400 ≥ 5.
Comparing QD donors with InP and CdSe cores
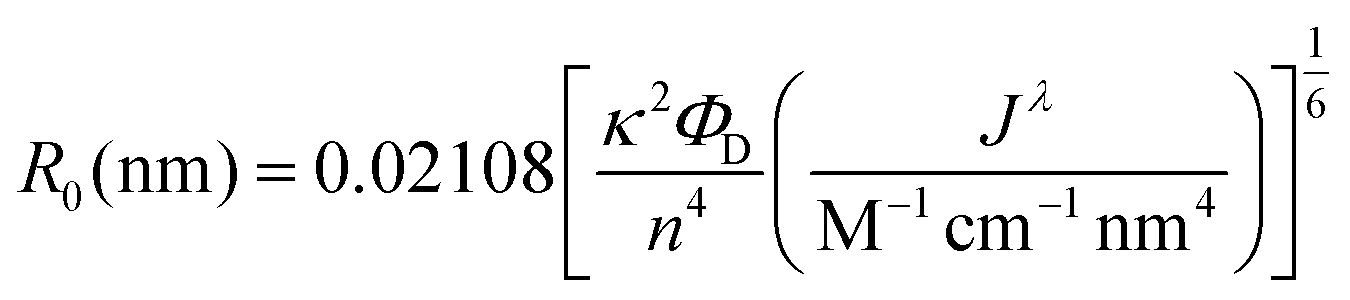
Many examples of QD–QD FRET in the literature use core-only donors and acceptors of the same semiconductor, usually CdSe or CdTe.23,26,34,39 In that context, we first examine the differences in QD–QD FRET output when using heterostructured donors with different core materials. Our ideal QD–QD FRET pair for visual sensing comprises a bright donor, a less bright acceptor, and a minimized distance between the donor and acceptor. The importance of reducing the donor–acceptor distance—in this case dictated by the size of the donor and acceptor QDs—to maximize FRET efficiency is well known and based on the extreme distance dependence of energy transfer noted above. The relevance of the relative brightness of the QDs is based on the need to transition a pair from Fa/Fd < 1 to Fa/Fd > 1 through FRET to produce a change in hue; as discussed above, visible color change is severely limited if the emission spectrum is already dominated by the acceptor color.Brightness is the product of the fluorophore molar extinction coefficient (ε) and QY (Table 1).56 When QD pairs of the same composition are used, the larger, redder QD acceptor absorbs more than the donor;57 if the QY of the donor and acceptor are similar, the higher brightness of the acceptor will overwhelm donor emission. In breaking away from composition consistent QD–QD pairs, we converted bulk semiconductor characteristics into QD-specific parameters to predict the best core material to use in order to minimize acceptor brightness with respect to the donor. We first used the Brus equation to calculate QD size over the relevant range of QD emission wavelengths and then calculated the QD size-dependent molar extinction coefficients for those core materials in aqueous media (Fig. 3A and B). InP and CdSe particle sizes are very similar for the same emission wavelength <∼525 nm. Above ∼525 nm, however, the size of the CdSe core increases steeply as the quantum confinement energy approaches the CdSe bulk bandgap at 712 nm. Given the similar sizes of the InP and CdSe cores for donor emission ∼550 nm, either a CdSe (Fig. 3C) or InP (Fig. 3D) donor paired with an InP acceptor minimizes the rDA of the FRET pair; an InP acceptor would also absorb less excitation illumination than a CdSe acceptor (Fig. 3A), decreasing the likelihood of the direct acceptor emission overwhelming the donor emission signal. However, the lower molar extinction coefficient of the InP acceptor also correlates to a reduced acceptor absorbance in the calculation of the spectral overlap integral, J, which in turn leads to a shorter characteristic Förster distance (R0, the donor–acceptor distance exhibiting FRET efficiency of 50%).
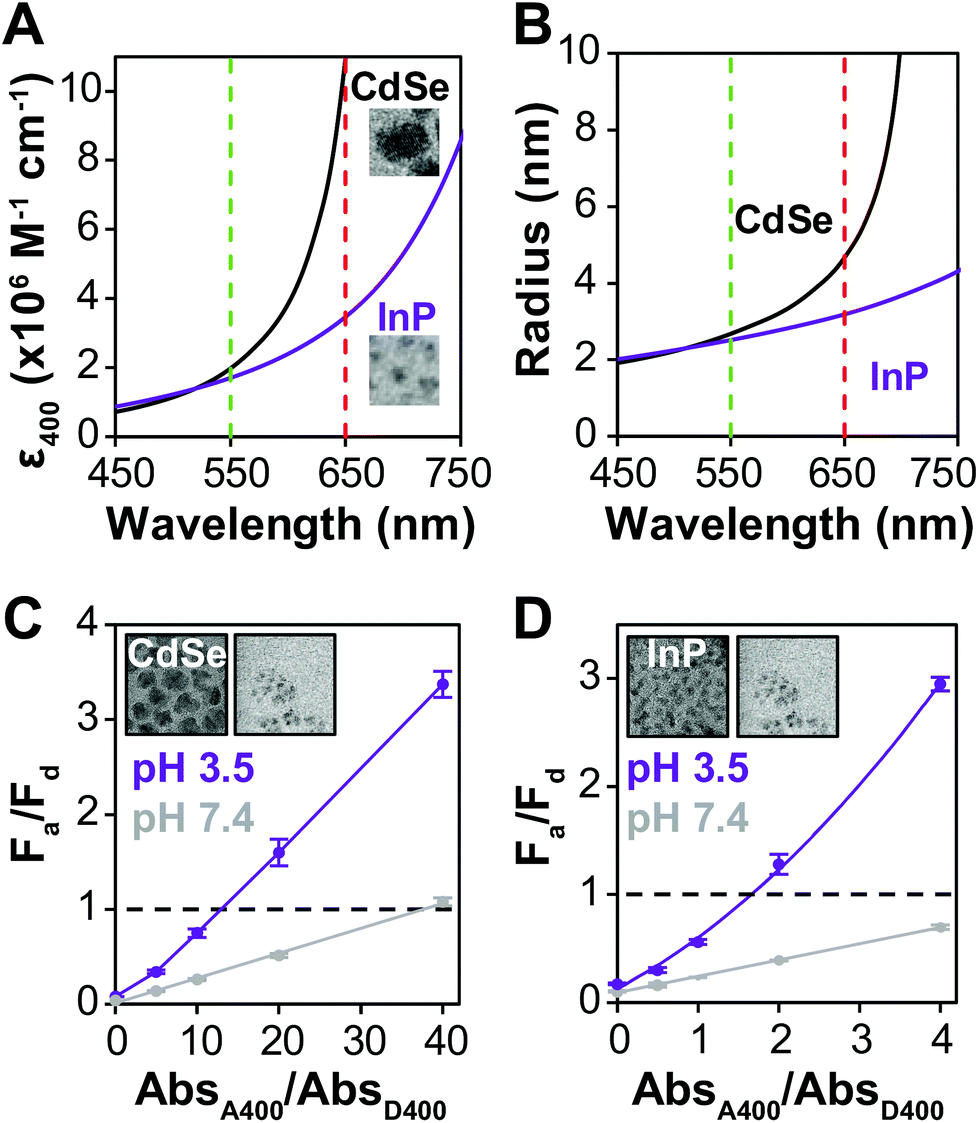 | ||
| Fig. 3 InP based acceptors minimize donor–acceptor distance. (A) QD molar extinction coefficient and (B) radius as a function of QD emission wavelength for InP and CdSe cores. Vertical lines indicate green and red emission colors. Insets in panel A show TEM images of representative red-emitting InP and CdSe QDs to illustrate the difference in their sizes. Each image represents a 17 × 17 nm square. Fa/Fd before (gray) and after (purple) aggregation comparing (C) CdSe- or (D) InP-based donors paired with an InP-based acceptor. Mean ± SD, n = 3. TEM images of each donor (left) and acceptor (right) are shown as insets and represent 45 × 45 nm squares. The CdSe donor, InP donor, and InP acceptor have radii of 5.0 ± 0.6 nm, 2.0 ± 0.2 nm, and 1.7 ± 0.6 nm, respectively. | ||
To offset decreased R0, FRET efficiency can be enhanced by integrating multiple acceptors per donor (Fig. S3†), in which case it is advantageous for the donor brightness to be greater, rather than equal to, acceptor brightness. The donor brightness can be enhanced by increasing absorption, increasing QY, or both. Increasing ΦD is doubly effective, as it also increases R0 (eqn (2)). R0 when using D1 is 30–40% higher than when using any of the other donors presented in this report. The large alloyed shell of D1 not only contributes to absorbance, but helps to retain ΦD after ligand exchange resulting in a brightness more than three-fold larger than that of the acceptor. While brightness tuning was achieved this way, the increased size of the donor becomes an issue in FRET sensing, highlighting the importance of using an acceptor with minimized size—in our case an InP based acceptor.
Given that there are several contributing factors that are both beneficial and detrimental to FRET efficiency, we determine rDA/R0 values for each QD–QD pair to assess their relative FRET potential (Table 2). Lower rDA/R0 values are expected to correlate with more efficient energy transfer, as rDA/R0 < 1 corresponds to a minimum donor–acceptor distance that is lower than the Förster distance for that pair. The shortest possible distance between two aggregated QDs can be estimated as the sum of their radii; however, the ligand coating is likely to add distance.58 In the worst-case scenario, the ligand on both QDs is fully extended, adding two times the extended length of CL4 to rDA. These two situations (i.e., no ligand vs. fully extended ligand) represent the minimum and maximum estimated rDA values given in Table 2, respectively. Most likely, the ligands interdigitate, and the actual value for rDA lies somewhere within this range.
| QD donor | Acceptor | J (×1016 M−1 cm−1 nm4) | R 0 (nm) | r DA (nm) | r DA/R0 | E theory (n = 1)c | E observed (n = 1)c | ΔFa/Fdd (AbsA400/AbsD400) |
|---|---|---|---|---|---|---|---|---|
| Min–maxb | Min–max | Min–max | Min–max | |||||
| a Overlap integral calculated using eqn (3) and the estimated molar extinction coefficient given for the InP/3ZnS acceptor given in Table 1. b The min–max values given correspond to the sum of the donor and acceptor QD radii and the summed radii + estimated extended length of CL4 multiplied by 2 (3.6 nm), respectively. Error shown is the standard deviation of TEM particle sizing (76–212). The min–max values given for rDA/R0 and EFRET,theory are calculated using the min–max values given for rDA. c Experimentally obtained FRET efficiencies calculated by evaluating the degree of donor lifetime quenching as given in eqn (4) at an acceptor/donor molar ratio (n) of 1 (estimated using the molar extinction coefficients given in Table 1). Min–max values of the experimentally observed FRET values are calculated by normalizing to the donor only sample at pH 3.5 and normalizing to the donor lifetime of the sample at the same donor/acceptor ratio at pH 7.4, respectively. d ΔFa/Fd at the highest AbsA400/AbsD400 where Fa/Fd ≤ 1 before aggregation; AbsA400/AbsD400 at highest ΔFa/Fd indicated in parentheses. | ||||||||
| CdxZn1−xSeyS1−y (D1) | InP/3ZnS | 2.60 | 7.2 | 6.7–10.3 ± 0.6 | 0.93–1.4 | 0.10–0.61 | 0.20–0.78 | 2.3 (40) |
| InP/7ZnS (D2) | InP/3ZnS | 2.82 | 3.9 | 3.9–7.5 ± 0.4 | 1.00–1.9 | 0.02–0.50 | 0.55–0.86 | 1.2 (1) |
| InP/4ZnSe/3ZnS (D3) | InP/3ZnS | 2.84 | 5.3 | 3.6–7.2 ± 0.3 | 0.68–1.3 | 0.14–0.91 | 0.37–0.76 | 2.3 (4) |
| InP/7ZnSe/3ZnS (D4) | InP/3ZnS | 2.91 | 5.4 | 4.0–7.6 ± 0.4 | 0.74–1.4 | 0.11–0.86 | 0.10–0.66 | 2.1 (4) |
When comparing systems using D1 (Fig. 3C) and D3 (Fig. 3D), both show a substantial change in Fa/Fd with aggregation. Comparing the values for rDA/R0, it is expected that the pair using an InP donor (D3) would exhibit more FRET at the same acceptor/donor molar ratio (Table 2). Observed FRET efficiencies reported in Table 2 are derived from lifetime measurements (Fig. S2†) and confirm this trend. However, aggregation-based assays can be difficult to analyze; the acceptor–donor ratios are not precisely controlled, and quenching from donor–donor interactions skew results14 (Fig. S2†). To design a color change system, however, ΔFa/Fd and the maximum AbsA400/AbsD400 where Fa/Fd of the system ≤1 (Table S1†) is more important than the FRET efficiency, E. Comparing D1 and D3 paired with A1, Fa/Fd is less than 1 at pH 7.4 at AbsA400/AbsD400 of 40 and 4, respectively, with ΔFa/Fd = 2.3 for both.
Effect of donor QD shells on FRET efficiency and ratiometric output
We hypothesized that enhancing donor absorption through shelling with a composition that contributes to ε400 would support the preferential excitation of the donor QD, improving FRET metrics. We have previously shown that CdSe/xCdS/2ZnS QDs of increasing shell thickness can exhibit up to a 40-fold enhancement in ε, greatly increasing the brightness of the QD, enabling the creation of a visual sensor.6 ZnS is traditionally used to terminate the surface of QDs, as its wide bandgap (3.61 eV, 343 nm)45 further confines the exciton to the core while passivating the surface for enhanced PL.59–61 ZnSe also has a relatively large bandgap (2.69 eV, 460 nm)45 and absorbs at a common QD excitation wavelength (400 nm) while ZnS does not; most ZnSe-shelled QDs are also capped with a thin shell of ZnS to passivate surface traps and protect the material from oxidation.40 We compared InP-based QDs of similar emission wavelength and particle size, but with varying ZnSe shell thicknesses, as donors to the InP acceptor (Fig. 4A–C). The QY of the ZnSe-shelled QDs are higher than that of the QD with no ZnSe, resulting in increased R0 (Table 2). Comparison of the estimated extinction coefficients (Table 1 and Fig. 4D) shows that the acceptor absorbs significantly more (3.1×) than the donor with no ZnSe (D2) at 400 nm because they possess similar non-absorbing shells, but the InP core of the acceptor is larger. With the ZnSe shell contributing to ε400, D2 absorbs similarly to the acceptor (0.85×) and D4 absorbs more (2.2×). QD absorbance is enhanced up to 6.7× (D4 vs. D2) by including ZnSe in the heterostructure composition.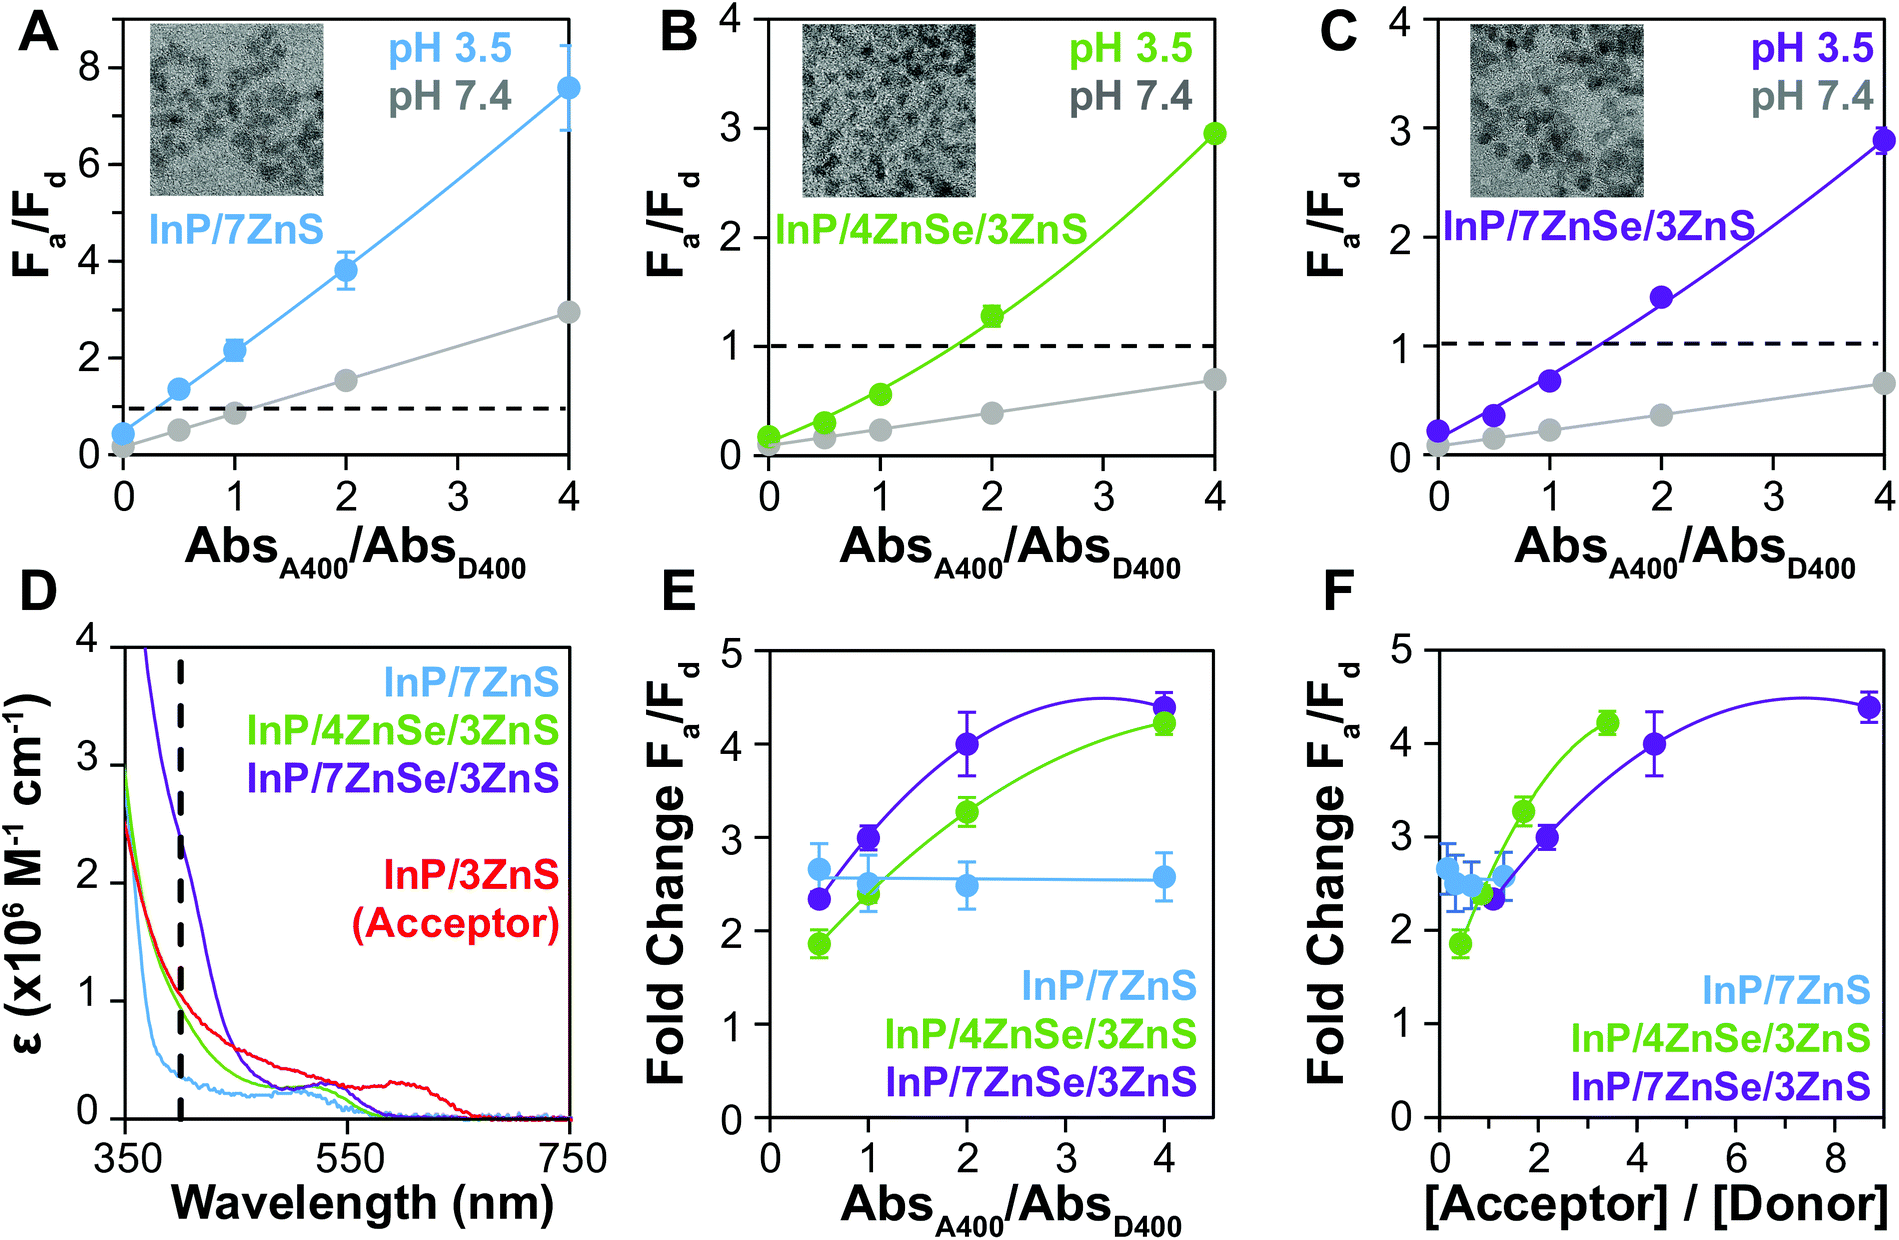 | ||
| Fig. 4 F a/Fd at pH 7.4 and 3.5 are shown for the (A) D2–A1, (B) D3–A1, and (C) D4–A1 pairs. These donors have undergone 0, 4, or 7 rounds of ZnSe SILAR addition, respectively. The particles are all comparable in size with radii r = 2.2 ± 0.3, 2.0 ± 0.2, and 2.3 ± 0.3 nm, respectively, given by TEM imaging and sizing analysis. (D) Estimated molar extinction coefficients indicate that donor D4 absorbs 6.7× more than D2 and 2.2× more than A1 at excitation wavelength 400 nm. (E) Plotting the fold change in Fa/Fd illustrates that the QD with no ZnSe performs poorly as a FRET donor. (F) Re-plotting fold change against acceptor/donor molar ratios, it is apparent that the number of acceptor QDs per donor QD is relatively low for the experiments using D2. | ||
F a/Fd increases after aggregation for all pairs but is much higher both before and after aggregation when using the QD with no ZnSe. While high Fa/Fd at pH 7.4 is expected for this donor because of the low ΦD2, the larger ΔFa/Fd contradicts the expected outcome when comparing rDA/R0 for the InP based QD donors. When the fold change in Fa/Fd from pH 7.4 to pH 3.5 (Fig. 4E) is considered, however, the relative Fa/Fd for D2 at the two pHs does not change regardless of absorbance ratio. The degree of energy transfer should increase with increasing acceptors per donor,62 and therefore the uniformity of the fold change implies that energy transfer is low or absent. When the fold change values are replotted as a function of molar ratio (Fig. 4F), it is apparent that number of acceptors per donor is much lower in when using D2, making it a much less efficient energy transfer system. This ratio could be increased, but Fa/Fd is already >1 when the donor and acceptor QDs are at the same concentration, so increasing the acceptor concentration is not an effective way to achieve color change for this system.
By increasing the size of the ZnSe layer in the donor QD, the QD extinction coefficient increases, resulting in higher acceptor to donor ratios when titrating the assays by absorbance. As a result, when comparing the thin- (D3) and thick-shelled (D4) donors, the fold change in Fa/Fd of D4 is a bit larger when plotted against absorbance ratios (Fig. 4E). However, when using the estimated extinction coefficients to replot the data against molar ratio (Fig. 4F), the 4-shell donor exhibits a slightly higher fold change at equivalent acceptor/donor ratios. The R0 is similar for 4- and 7-shell QDs, so the 4-shell QD (r = 2.0 nm) performs a little better at the same acceptor to donor molar ratios than the 7-shell QD (r = 2.3 nm) due to its smaller size.
Increased ΦD enhances FRET efficiency
Because of its influence on R0, increasing ΦD increases the amount of energy transfer in any specific donor–acceptor pair. The QYs of QDs water solubilized with small molecule ligands are often severely diminished in the ligand exchange process, but some groups have reported that the introduction of zinc during the procedure increases the QY of QDs in the water phase.63 We used this method to ligand exchange D3 and modestly increased its ΦD from 4.2% to 6.8%. While this degree of change is not enough to significantly alter Fa/Fd before aggregation (Fig. 5A and B), the fold change in Fa/Fd between the dispersed and aggregated states is clearly improved by the higher ΦD. In fact, the donor with higher QY shows change in Fa/Fd that results in color change starting at a lower absorbance ratio (1:1) than the donor with lower QY (1:2), indicating that it has potential not only for making a brighter sensor, but also a more sensitive one.
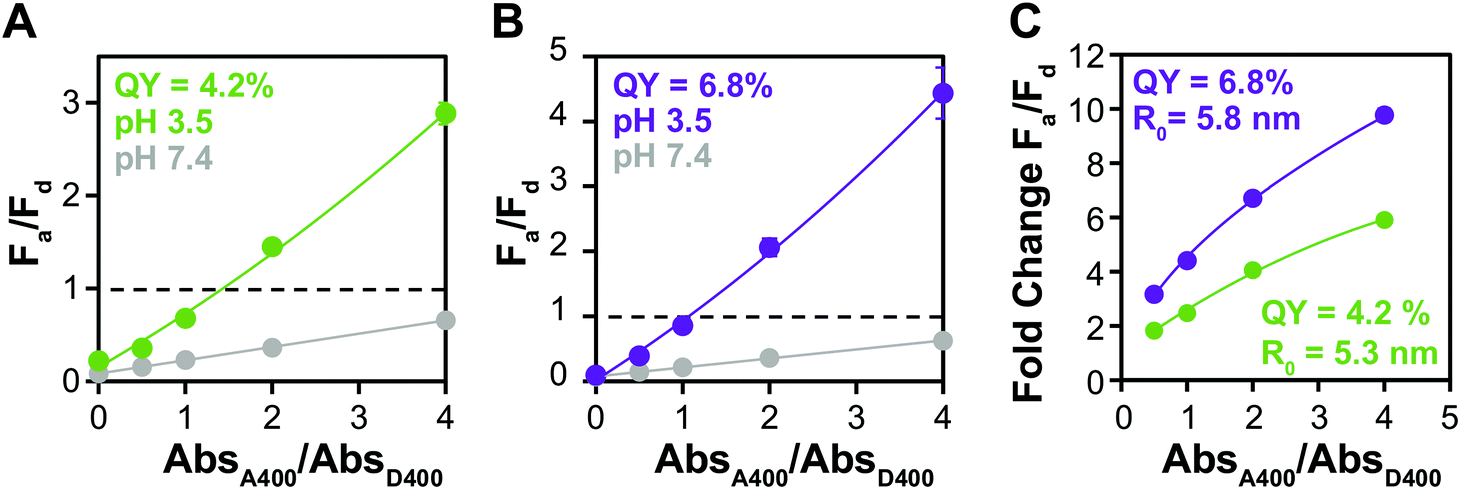 | ||
| Fig. 5 Improving donor quantum yield improves FRET output. Fa/Fd plots of aggregation assays using D3 ligand transferred with CL4 (A) normally and (B) in the presence of zinc to enhance QY (4.2 → 6.8%). (C) Fold change in Fa/Fd. Means ± SD, n = 3. | ||
Test sensor
Lastly, we demonstrate the efficacy of QD–QD FRET to transduce color change in a test sensor. In an extension of our foundational aggregation assays, we demonstrate that the charge-based aggregation of the CL4-coated QDs can be harnessed to produce a QD–QD FRET-based pH sensor. Because CL4 is negatively charged, this sensing paradigm could also apply to positively charged analytes such as cationic elemental salts, biomolecules, pharmaceuticals, or metabolites. Additionally, the lessons learned throughout this study could be used to improved other QD–QD FRET sensor designs described the literature and summarized in the referenced review.14In the screening studies, we showed data from neutral and very low pHs, to ensure complete transition between the dispersed and aggregated states. However, the degree of protonation of CL4 is a function of pH,64 and therefore the aggregation dynamics at different pHs should differ, allowing for a range of colors to be produced. Here, the thick ZnSe-shelled donor (D4) and InP acceptor are mixed at a 1 to 4 absorbance ratio for pH titration. Significant color change occurs (Fig. 6A) between pH 3.5 and 7.5. Upon the addition of base, the pH of each sample is raised above neutral, resulting in the redispersion of the QDs. All samples returned to a color indicative of full redispersion (Fig. 6B), indicating reversibility of the system and providing further confirmation that color change results from aggregation-induced FRET. As pH cycling induces no permanent changes to the QDs or the CL4 coating, the QD–QD FRET-based pH sensor should be fully reversible and responsive as long as colloidal stability persists. Further detailed studies into the reversibility of the aggregated state in response to harsh or gentle aggregation protocols will demonstrate the physical and photophysical durability of QD–QD FRET sensors as well as any hysteresis in the spectral response.
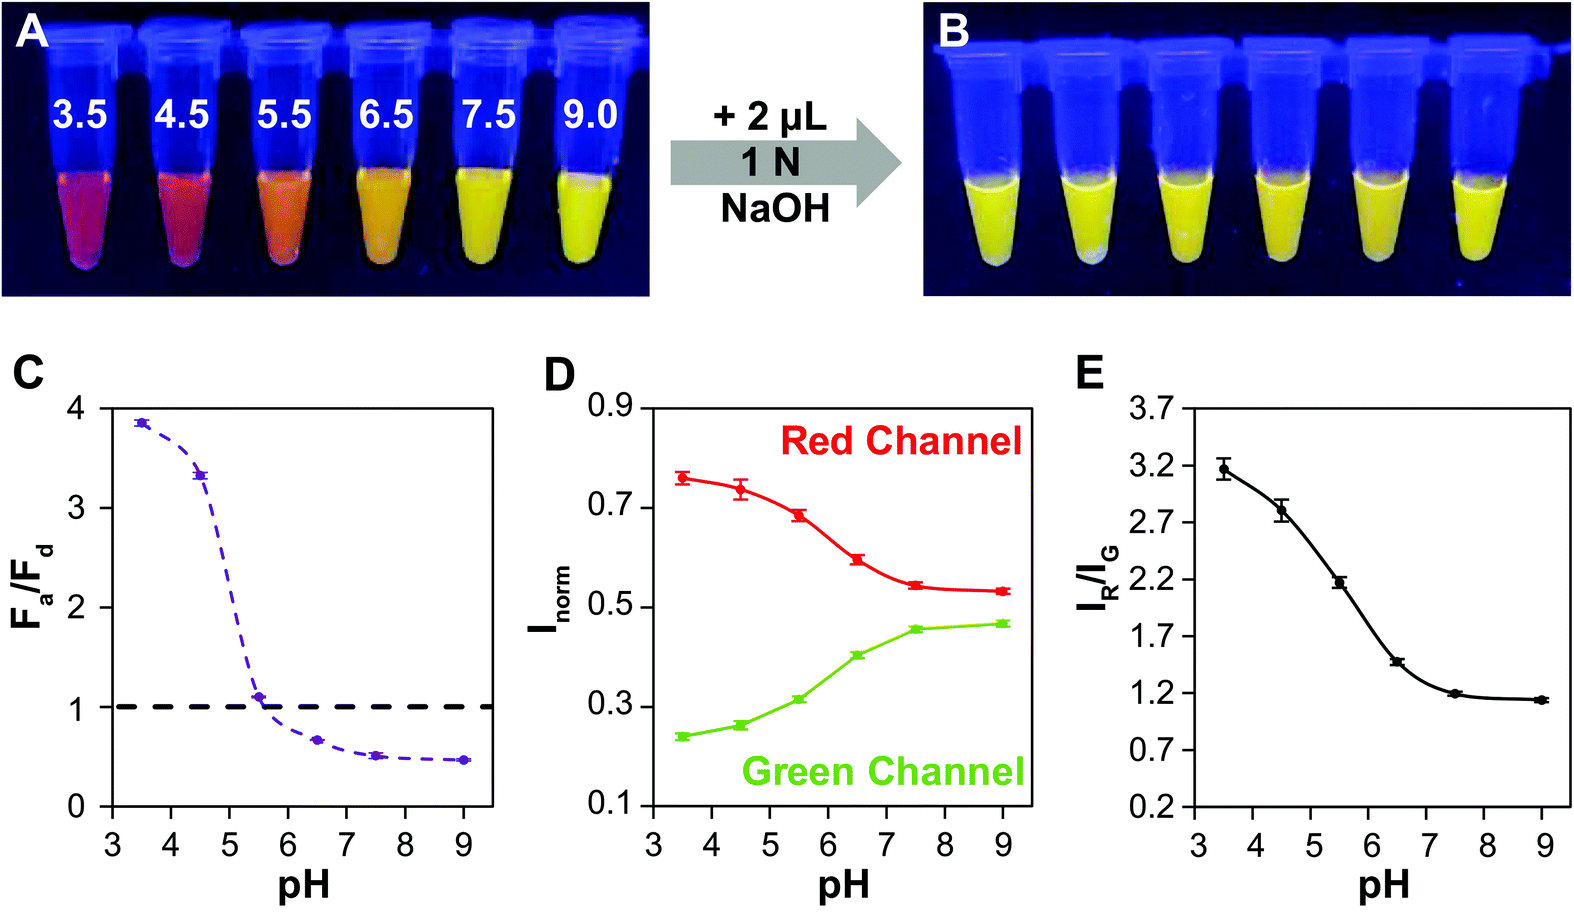 | ||
| Fig. 6 Example pH sensor. (A) Image of an aggregation assay using D4 at an AbsA400/AbsD400 ratio of 4 undergoing FRET at different pHs shows a wide range of colors. (B) Image of the assay after addition of base shows change in color (lowered Fa/Fd) indicating reversibility of the system. (C) Fa/Fd as a function of pH evaluated using PL spectra obtained from a fluorimeter. (D) Pixel intensities in the red and green channel of the image normalized to the sum of red and green intensities evaluated using ImageJ. (E) The red/green pixel intensity ratio plotted as a function of pH shows a similar trend to the Fa/Fd plot obtained using a fluorimeter. | ||
A signal response curve was created by plotting Fa/Fd as a function of pH (Fig. 6C). The pH ranges and sensor response of this QD–QD FRET-based pH sensor are comparable to other QD-based pH sensors that have been published,2,4,65 but the magnitude of the ratiometric change is somewhat lower in the QD–QD FRET case due to higher background signal from direct acceptor excitation. Because the focus of this work was to create QD–QD FRET pairs with visual output for instrument-free or economical read-out, the images were also analyzed using ImageJ to demonstrate a method for quantitative assessment without the use of laboratory grade instrumentation using the ratio of pixel intensities in the red and green channel for each tube obtained (Fig. 6D). The red/green intensity ratio tracks very similarly to the trend seen when plotting Fa/Fd obtained from PL measurements using a fluorimeter (Fig. 6E). While this construct does not allow for sensing above neutral pH, the viability of using QD–QD FRET for color-change sensing is demonstrated. Some commercially available pH strips consist of multiple indicator pads using different pH sensitive dyes that change color at different cut-offs for extending the sensing range. Similarly, different ligands that show differing protonation responses to pH could be used to extend the sensing range of the QD–QD FRET systems.
Conclusions
In this work, QDs of different compositions and heterostructures are used as FRET donors and acceptors in order to illuminate how materials design can be used to optimize QD–QD FRET sensing. We show that bulk semiconductor material characteristics can be used to a priori predict and design a QD–QD FRET system to meet the needs of a given application. The study focused on the development of FRET pairs where color change is seen for use in instrument-free sensing. The requirement for visual color change necessitated a change from a spectrum dominated by the donor emission (Fa/Fd < 1) to a spectrum dominated by the acceptor emission (Fa/Fd > 1) in the transition from the no-FRET state to FRET state. In the context of this criterion and the fact that FRET efficiency can be enhanced by pairing multiple acceptors with a single donor, it is important that the donor QD exhibit higher brightness at the excitation wavelength than the acceptor. Our findings show that it is possible to create QD donors that are brighter than their acceptors by changing the composition and size of their shell. For green-emitting InP QDs, the incorporation of a ZnSe shell can enhance the QD's estimated molar extinction coefficient nearly 7-fold. By increasing the thickness of the ZnSe shell, absorption of the green QD can surpass that of a red QD with a larger InP core, successfully creating QD–QD pairs where acceptor emission is less than donor emission, even at acceptor to donor ratios >1. Finally, an optimal FRET pair using an InP/7ZnSe/3ZnS donor paired with an InP/3ZnS acceptor was used as a test pH sensor that shows a large range of pH dependent color change. These results show that it is possible to engineer bright, cadmium-free, visible color change sensors using QD–QD FRET.Experimental
Materials
For QD synthesis, 99.95% cadmium oxide (CdO, Alfa Aesar), 99.99% zinc acetate (ZnAc, Sigma-Aldrich), and 99.99% indium acetate (InAc, ACROS Organics) were used to make cation precursors while 99.99% selenium (Se, pellets, Sigma-Aldrich) and 99.5% sulfur (S, ACROS Organics) were used for anion precursors. Octadecence (Tech, 90% ODE, Sigma-Aldrich), oleic acid (Tech, 90% OA, Sigma-Aldrich), oleylamine (Tech, 70% Olam, Sigma-Aldrich), 97% trioctylphosphine (TOP, Sigma-Aldrich), and trioctylphosphine oxide (TOPO, Sigma-Aldrich) were used as solvents and coordinating ligands during synthesis. Quantum dots were cleaned and stored in organic solutions post-synthesis using hexane (Sigma-Aldrich), chloroform (CHCl3, J.T. Baker), ethanol (EtOH, anhydrous, Sigma-Aldrich), and methanol (MeOH, Sigma-Aldrich). For CL4 synthesis, alpha-lipoic acid (LA, Sigma Aldrich), 97% N,N′-carbonyldiimidazole (CDI, Alfa Aesar), ethylenediamine (EDA, Sigma-Aldrich), methyl acrylate (ACROS Organics), lithium hydroxide (LiOH, Sigma-Aldrich) and sodium borohydride (NaBH4, ACROS Organics) were used. Zinc nitrate hexahydrate, (reagent grade, 98%, Sigma Aldrich) was used for metalated ligand transfer. Buffered solutions were prepared by using phosphate buffered saline packets (pH 7.4, Sigma-Aldrich), sodium citrate dihydrate (Sigma-Aldrich) and citric acid (Fisher Chemicals).Quantum dot synthesis
The precursors used for QD synthesis included cadmium oleate (Cd(OA)2), zinc oleate (Zn(OA)2), indium oleate (In(OA)3), sulfur (S:ODE) and selenium (TOP:Se or Se:ODE), the syntheses of which have been previously described.6,40,66 A pre-mixed S/Se solution was made by mixing the Se and S precursors at a 1:1.5 molar ratio before diluting with TOP to a final Se concentration of 1 M and S concentration of 1.5 M.
CdSe cores were nucleated as previously described by a hot-injection synthesis.67 Size and emission color of the cores can be modulated by changing the amount of time at which the solution is allowed to react at 270 °C. For our study, we made CdSe cores with an emission peak at 580 nm by letting the solution react for 5 minutes (mins) before allowing it to cool to room temperature (RT). To shift the emission maximum of the QD to 650 nm and protect the surface of the emissive core, a single CdSe shell was added followed by 1 CdS and 2 ZnS shells in a successive ion layer adsorption and reaction (SILAR) procedure as previously reported.6,67
Synthesis of large core-alloyed-shelled Cd based QDs was done by slightly modifying a single step one-pot method reported by Bae et al.41 Specifically, 5 mL of 0.2 M Zinc Oleate (Zn(OA)2) and 0.4 mL of 0.2 M Cd(OA)2 were mixed in a 100 mL round bottom flask (rbf) under argon and degassed under vacuum at 80 °C for 30 min before heating to 300 °C. While the solution was heating, a syringe containing 2 mL of TOP:Se:S solution was prepared in the glovebox. Once the cation solution reached 300 °C, the anion solution was quickly injected and left to react for 15 min before turning off the temperature controller and allowing the reaction solution to cool to room temperature.
InP cores were synthesized in a method previously reported by Toufanian et al.40 For green emitting donors, medium InP cores were used and ZnSe or ZnS shelled on top via SILAR. The starting reaction flask was seeded with 100 nmols of InP cores in a 10% Olam/ODE solution at a final volume of 10 mL. ZnSe shelling was performed using 0.2 M Zn(OA)2 and 0.2 M Se:ODE, while ZnS shelling was done using 0.2 M S:ODE as the sulfur precursor. Red emitting InP/3ZnS acceptors were made in the same method using larger cores.
CL4 synthesis and ligand exchange were performed exactly as described in a previous report.6 ‘Metalated’ ligand transfer with CL4 was carried out in a modified protocol previously described by the Snee group.63 Zinc nitrate (Zn(NO3)2) was weighed and added directly to 1 mL of CL4 to a final concentration of 0.2 M. 1 M NaOH was added dropwise to the solution while stirring until the Zn was fully dissolved (∼pH 10–12). The Zn/CL4 solution was used for ligand exchange in the same protocol when using CL4 alone. In samples containing Zn/CL4, QDs were aggregated to the sides of the vial after overnight ligand exchange. They were re-dispersed in 0.2 M NaOH before filtering on a 0.1 μm syringe filter and buffer exchanging into 0.2 M NaHCO3 by spin filtration (3×) on a 30 kDa centrifugal filter.
Quantum dot characterization
PL spectra were taken with QDs in cuvettes or in plates using the MicroWell plate reader attachment on a HORIBA (Nanolog FL3-2iHR) fluorimeter. QDs were excited at 400 nm (slit width (SW) = 5 nm) and emission was collected using a 300 × 500 grating centered around 600 nm (SW = 5 nm). QY measurements were taken using the quanta-φ integrating sphere attachment and calculated using HORIBA's FluorEssence software. For QY measurements, QDs were excited at 400 nm (SW = 3 nm) and emission was collected using a 100 × 450 grating centered around 550 nm (SW = 3 nm). Absorbance measurements were taken in a 1 cm pathlength cuvette on a Nanodrop 2000c spectrophotometer. Förster distance calculations were performed using MATLAB.QD–QD FRET aggregation assays
Aggregation assays were performed in 384-well black bottomed, non-binding Corning well-plates. For plate assays, QD stocks were diluted in diH20 immediately prior to their use. Donor and acceptor QDs were diluted to Abs400 of 0.1 and Abs400 of 0.4, respectively, with the exception of assays shown in Fig. S2: row 2 and Table S1: rows 1 & 4† which were made at concentrations 5 times higher. In assays with AbsA400/AbsD400 = 0, 5, 10, 20 and 40, donor absorbance was equal to 0.05 and acceptor absorbance was equal to 2. A 1 to 2 serial dilution of the acceptor QDs produced four solutions with final Abs400 of 0.05, 0.1, 0.2, 0.4, plus an acceptor-free control (i.e., diH2O). Equal volumes (60 μL) of donor and acceptor solutions were mixed in Eppendorf UVettes resulting in five solutions with a donor Abs400 of 0.025 and acceptor to donor absorption ratios of 0, 0.5, 1, 2. For the donor only solution, 60 μL of diH20 was added. 20 μL of each solution was then added to the well-plate in sextuplicate. 20 μL of PBS, pH 7.4, was added to three of the wells, while citrate, pH 3.5, was added to the other three, resulting in three independently aggregated measurements at each pH. The pH of stock solutions was measured using a pH meter (Thermo Scientific, Orion Dual Star). PL spectra were collected as indicated above. For photographs, a UV lamp was used (Spectroline XX-15A, 365 nm, 120 V, 60 Hz, 0.7 A) for excitation and a camera phone (Samsung Galaxy S6 Edge+) used to collect images. For images depicting QDs in 200 μL PCR tubes, solutions were pipetted out of the black well plates and into the tubes.FRET analysis
The aggregation-based FRET assays are analyzed the same way as conjugation-based FRET assays. Namely, FRET efficiency, E, is distance dependent to the inverse 6th power: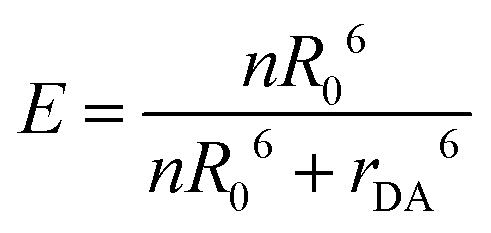 | (1) |
 | (2) |
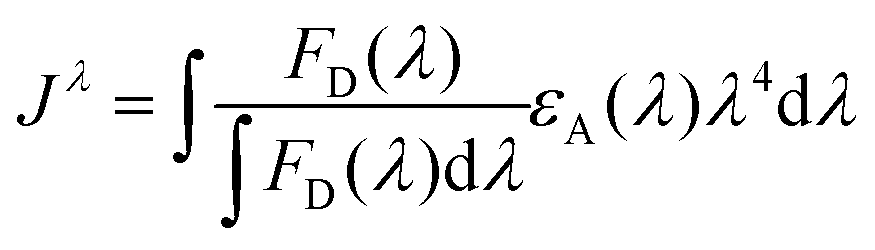 | (3) |
FRET efficiency can also be calculated using experimentally observed changes in the donor's fluorescence (PL or lifetime) as given by eqn (4)
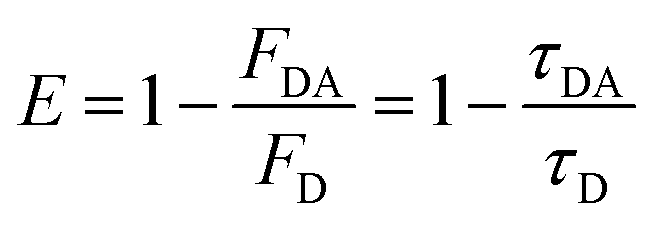 | (4) |
Calculating material-dependent QD properties
The relationship between QD size and emission wavelength for any material can be roughly estimated with the Brus equation (Fig. 3A and eqn (5)):68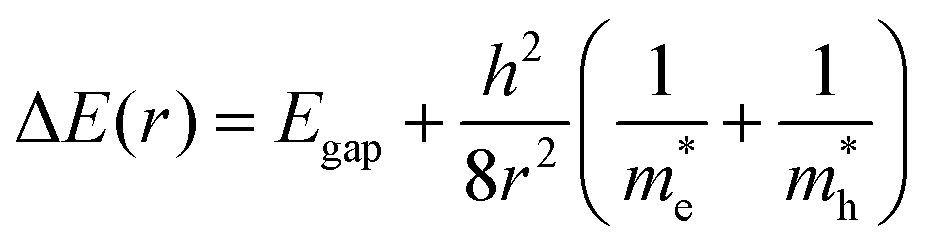 | (5) |
 and
and  are the electron and hole effective mass, respectively, h is Planck's constant, and r is the radius of the QD.
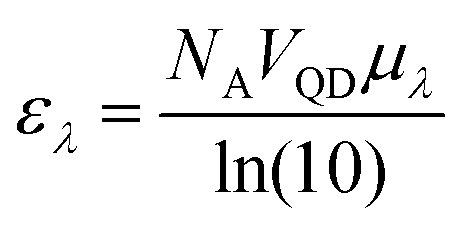
A particle's size independent absorption coefficient, μλ, can be estimated using effective medium approximations:69
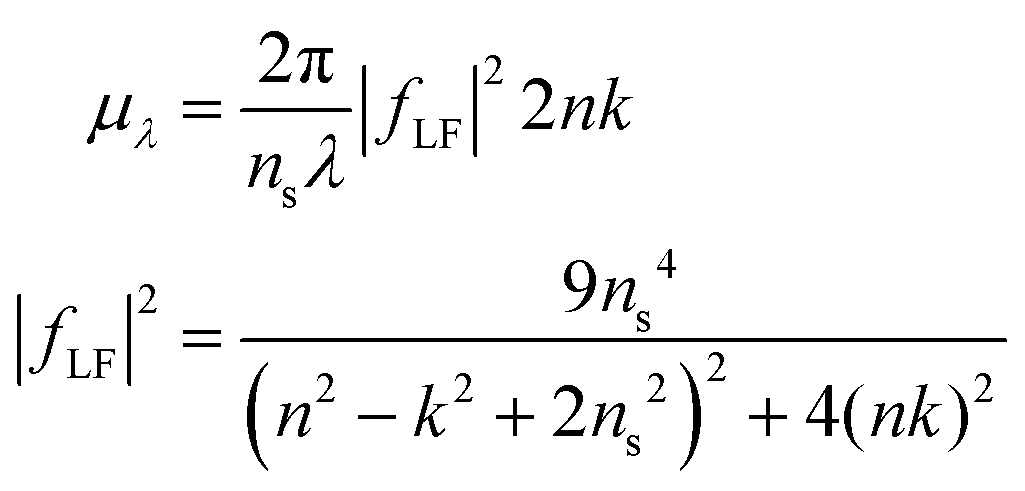 | (6) |
 | (7) |
Author contributions
The manuscript was written through contributions of all authors. All authors have given approval to the final version of the manuscript.Conflicts of interest
There are no conflicts to declare.Acknowledgements
Research reported in this publication was supported by the National Institute of General Medical Sciences of the National Institutes of Health under Award Number R01GM129437. This work was performed in part at the Center for Nanoscale Systems (CNS), a member of the National Nanotechnology Infrastructure Network (NNIN), which is supported by the National Science Foundation under NSF award no. ECS-0335765. CNS is part of Harvard University.References
- U. Resch-Genger, M. Grabolle, S. Cavaliere-Jaricot, R. Nitschke and T. Nann, Quantum Dots versus Organic Dyes as Fluorescent Labels, Nat. Methods, 2008, 5(9), 763–775, DOI:10.1038/nmeth.1248.
- A. M. Dennis, W. J. Rhee, D. Sotto, S. N. Dublin and G. Bao, Quantum Dot-Fluorescent Protein Fret Probes for Sensing Intracellular PH, ACS Nano, 2012, 6(4), 2917–2924, DOI:10.1021/nn2038077.
- J. Lee, M. B. Brennan, R. Wilton, C. E. Rowland, E. A. Rozhkova, S. Forrester, D. C. Hannah, J. Carlson, E. V. Shevchenko and D. S. Schabacker, et al., Fast, Ratiometric FRET from Quantum Dot Conjugated Stabilized Single Chain Variable Fragments for Quantitative Botulinum Neurotoxin Sensing, Nano Lett., 2015, 15(10), 7161–7167, DOI:10.1021/acs.nanolett.5b03442.
- R. C. Somers, M. G. Bawendi, J. P. Zimmer, D. G. Nocera, G. Nair and P. T. Snee, A Ratiometric CdSe/ZnS Nanocrystal PH Sensor, J. Am. Chem. Soc., 2006, 128(41), 13320–13321, DOI:10.1021/ja0618999.
- M. H. Lee, J. S. Kim and J. L. Sessler, Small Molecule-Based Ratiometric Fluorescence Probes for Cations, Anions, and Biomolecules, Chem. Soc. Rev., 2015, 44(13), 4185–4191, 10.1039/c4cs00280f.
- M. Chern, T. T. Nguyen, A. H. Mahler and A. M. Dennis, Shell Thickness Effects on Quantum Dot Brightness and Energy Transfer, Nanoscale, 2017, 9(42), 16446–16458, 10.1039/c7nr04296e.
- M. Massey, J. J. Li and W. R. Algar, Multifunctional Concentric FRET-Quantum Dot Probes for Tracking and Imaging of Proteolytic Activity, in Methods in Molecular Biology, ed. R. Zeineldin, Springer New York, New York, NY, 2017, vol. 1530, pp. 63–97. DOI:10.1007/978-1-4939-6646-2_4.
- I. L. Medintz, A. R. Clapp, F. M. Brunel, T. Tiefenbrunn, H. Tetsuo Uyeda, E. L. Chang, J. R. Deschamps, P. E. Dawson and H. Mattoussi, Proteolytic Activity Monitored by Fluorescence Resonance Energy Transfer through Quantum-Dot-Peptide Conjugates, Nat. Mater., 2006, 5(7), 581–589, DOI:10.1038/nmat1676.
- E. Petryayeva and W. R. Algar, Multiplexed Homogeneous Assays of Proteolytic Activity Using a Smartphone and Quantum Dots, Anal. Chem., 2014, 86(6), 3195–3202, DOI:10.1021/ac500131r.
- S. A. Díaz, A. P. Malonoski, K. Susumu, R. V. Hofele, E. Oh and I. L. Medintz, Probing the Kinetics of Quantum Dot-Based Proteolytic Sensors, Anal. Bioanal. Chem., 2015, 407(24), 7307–7318, DOI:10.1007/s00216-015-8892-y.
- S. B. Lowe, J. A. G. Dick, B. E. Cohen and M. M. Stevens, Multiplex Sensing of Protease and Kinase Enzyme Activity via Orthogonal Coupling of Quantum Dot-Peptide Conjugates, ACS Nano, 2012, 6(1), 851–857, DOI:10.1021/nn204361s.
- T. Pons, C. M. Spillmann, W. R. Algar, M. H. Stewart, K. Susumu, N. Hildebrandt, I. L. Medintz, E. Oh, J. B. Delehanty and S. A. Díaz, Energy Transfer with Semiconductor Quantum Dot Bioconjugates: A Versatile Platform for Biosensing, Energy Harvesting, and Other Developing Applications, Chem. Rev., 2016, 117(2), 536–711, DOI:10.1021/acs.chemrev.6b00030.
- A. M. Dennis and G. Bao, Quantum Dot-Fluorescent Protein Pairs as Novel Fluorescence Resonance Energy Transfer Probes, Nano Lett., 2008, 8(5), 1439–1445, DOI:10.1021/nl080358.
- K. F. Chou and A. M. Dennis, Förster Resonance Energy Transfer between Quantum Dot Donors and Quantum Dot Acceptors, Sensors, 2015, 15(6), 13288–13325, DOI:10.3390/s150613288.
- M. Chern, J. C. Kays, S. Bhuckory and A. M. Dennis, Sensing with Photoluminescent Semiconductor Quantum Dots, Methods Appl. Fluoresc., 2019, 7(1), 012005, DOI:10.1088/2050-6120/aaf6f8.
- M. Cardoso Dos Santos and N. Hildebrandt, Recent Developments in Lanthanide-to-Quantum Dot FRET Using Time-Gated Fluorescence Detection and Photon Upconversion, TrAC, Trends Anal. Chem., 2016, 60–71, DOI:10.1016/j.trac.2016.03.005.
- L. Duchesne and K. Lacombe, Innovative Technologies for Point-of-Care Testing of Viral Hepatitis in Low-Resource and Decentralized Settings, J. Viral Hepatitis, 2018, 25(2), 108–117, DOI:10.1111/jvh.12827.
- K. Wang, D. Fan, Y. Liu and S. Dong, Cascaded Multiple Amplification Strategy for Ultrasensitive Detection of HIV/HCV Virus DNA, Biosens. Bioelectron., 2017, 87, 116–121, DOI:10.1016/j.bios.2016.08.017.
- J. Bruno, Application of DNA Aptamers and Quantum Dots to Lateral Flow Test Strips for Detection of Foodborne Pathogens with Improved Sensitivity versus Colloidal Gold, Pathogens, 2014, 3(2), 341–355, DOI:10.3390/pathogens3020341.
- E. Petryayeva, W. R. Algar, W. Russ Algar and W. R. Algar, Toward Point-of-Care Diagnostics with Consumer Electronic Devices: The Expanding Role of Nanoparticles, RSC Adv., 2015, 5(28), 22256–22282, 10.1039/c4ra15036h.
- Y. Altlntas, M. Y. Talpur, E. Mutlugün, Y. Altıntas, M. Y. Talpur and E. Mutlugün, Efficient Förster Resonance Energy Transfer Donors of In(Zn)P/ZnS Quantum Dots, J. Phys. Chem. C, 2017, 121(5), 3034–3043, DOI:10.1021/acs.jpcc.6b09978.
- J. Miyazaki, S. Kinoshita and T. Jin, Non-Radiative Exciton Recombination through Excitation Energy Transfer in Quantum Dot Clusters, J. Lumin., 2011, 131(3), 539–542, DOI:10.1016/j.jlumin.2010.11.006.
- C. R. Kagan, C. B. Murray, M. Nirmal and M. G. Bawendi, Electronic Energy Transfer in CdSe Quantum Dot Solids, Phys. Rev. Lett., 1996, 76(9), 1517–1520, DOI:10.1103/PhysRevLett.76.1517.
- O. I. Mićić, K. M. Jones, A. Cahill and A. J. Nozik, Optical, Electronic, and Structural Properties of Uncoupled and Close-Packed Arrays of InP Quantum Dots, J. Phys. Chem. B, 2002, 102(49), 9791–9796, DOI:10.1021/jp981703u.
- S. W. Clark, J. M. Harbold and F. W. Wise, Resonant Energy Transfer in PbS Quantum Dots, J. Phys. Chem. C, 2007, 111(20), 7302–7305, DOI:10.1021/jp0713561.
- L. Xu, J. Xu, W. Li, Z. Weiming, P. Sun, Z. Ma, X. Huang and K. Chen, Luminescence and Resonant Energy Transfer of Two Sizes of CdTe Quantum Dots Embedded in Gelatin Films, J. Mater. Sci., 2007, 42(23), 9696–9699, DOI:10.1007/s10853-007-1942-x.
- W. Lü, I. Umezu and A. Sugimura, Evolution of Energy Transfer Process between Quantum Dots of Two Different Sizes during the Evaporation of Solvent, Jpn. J. Appl. Phys., Part 1, 2008, 47(8 PART 1), 6592–6595, DOI:10.1143/JJAP.47.6592.
- C. W. Chen, C. H. Wang, Y. F. Chen, C. W. Lai and P. T. Chou, Tunable Energy Transfer Efficiency Based on the Composite of Mixed CdSe Quantum Dots and Elastomeric Film, Appl. Phys. Lett., 2008, 92(5), 2006–2009, DOI:10.1063/1.2841047.
- L. Xu, J. Xu, Z. Ma, W. Li, X. Huang and K. Chen, Direct Observation of Resonant Energy Transfer between Quantum Dots of Two Different Sizes in a Single Water Droplet, Appl. Phys. Lett., 2006, 89(3), 2004–2007, DOI:10.1063/1.2226980.
- R. Wargnier, A. V. Baranov, V. G. Maslov, V. Stsiapura, M. Artemyev, M. Pluot, A. Sukhanova and I. Nabiev, Energy Transfer in Aqueous Solutions of Oppositely Charged CdSe/ZnS Core/Shell Quantum Dots and in Quantum Dot - Nanogold Assemblies, Nano Lett., 2004, 4(3), 451–457, DOI:10.1021/nl0350938.
- S. Sarkar, A. R. Maity, N. S. Karan and N. Pradhan, Fluorescence Energy Transfer from Doped to Undoped Quantum Dots, J. Phys. Chem. C, 2013, 117(42), 21988–21994, DOI:10.1021/jp4035612.
- M. Lunz, A. L. Bradley, V. A. Gerard, S. J. Byrne, Y. K. Gun'Ko, V. Lesnyak and N. Gaponik, Concentration Dependence of Förster Resonant Energy Transfer between Donor and Acceptor Nanocrystal Quantum Dot Layers: Effect of Donor-Donor Interactions, Phys. Rev. B: Condens. Matter Mater. Phys., 2011, 83(11), 115423, DOI:10.1103/PhysRevB.83.115423.
- G. Azevedo, A. F. G. Monte, A. F. Reis and D. N. Messias, Fluorescence Resonance Energy Transfer Measured by Spatial Photon Migration in CdSe-ZnS Quantum Dots Colloidal Systems as a Function of Concentration, Appl. Phys. Lett., 2014, 105(20), 203108, DOI:10.1063/1.4902223.
- T. Shiraki, Y. Tsuchiya and S. Shinkai, Ratiometric Fluorescent Sensor for 2,4,6-Trinitrotoluene Designed Based on Energy Transfer between Size-Different Quantum Dots, Chem. Lett., 2010, 39(3), 156–158, DOI:10.1246/cl.2010.156.
- C. Y. Chen, C. T. Cheng, C. W. Lai, P. W. Wu, K. C. Wu, P. T. Chou, Y. H. Chou and H. T. Chiu, Potassium Ion Recognition by 15-Crown-5 Functionalized CdSe/ZnS Quantum Dots in H2O, Chem. Commun., 2006, 3, 263–265, 10.1039/b512677k.
- B. Wang, Q. Wang, M. Ma and Z. Cai, The Inhibition of Fluorescence Resonance Energy Transfer between Multicolor Quantum Dots for Rapid and Sensitive Detection of Staphylococcus Aureus, Spectrochim. Acta, Part A, 2015, 135, 428–434, DOI:10.1016/j.saa.2014.07.024.
- A. R. Clapp, J. R. Deschamps, H. Mattoussi, M. E. Lassman, H. T. Uyeda, J. L. Whitley, A. Hayhurst, E. R. Goldman and I. L. Medintz, A Hybrid Quantum Dot–Antibody Fragment Fluorescence Resonance Energy Transfer-Based TNT Sensor, J. Am. Chem. Soc., 2005, 127(18), 6744–6751, DOI:10.1021/ja043677l.
- K. Zheng, K. Žídek, M. Abdellah, N. Zhu, P. Chábera, N. Lenngren, Q. Chi and T. Pullerits, Directed Energy Transfer in Films of CdSe Quantum Dots: Beyond the Point Dipole Approximation, J. Am. Chem. Soc., 2014, 136(17), 6259–6268, DOI:10.1021/ja411127w.
- S. Mayilo, J. Hilhorst, A. S. Susha, C. Höhl, T. Franzi, T. A. Klar, A. L. Rogach and J. Feldmann, Energy Transfer in Solution-Based Clusters of CdTe Nanocrystals Electrostatically Bound by Calcium Ions, J. Phys. Chem. C, 2008, 112(37), 14589–14594, DOI:10.1021/jp803503g.
- R. Toufanian, A. Piryatinski, A. H. Mahler, R. Iyer, J. A. Hollingsworth and A. M. Dennis, Bandgap Engineering of Indium Phosphide-Based Core/Shell Heterostructures Through Shell Composition and Thickness, Front. Chem., 2018, 6(November), 1–12, DOI:10.3389/fchem.2018.00567.
- W. K. Bae, K. Char, H. Hur and S. Lee, Single-Step Synthesis of Quantum Dots with Chemical Composition Gradients, Chem. Mater., 2008, 20(2), 531–539, DOI:10.1021/cm070754d.
- S. J. Lim, M. U. Zahid, P. Le, L. Ma, D. Entenberg, A. S. Harney, J. Condeelis and A. M. Smith, Brightness-Equalized Quantum Dots, Nat. Commun., 2015, 6, 8210, DOI:10.1038/ncomms9210.
- B. De Geyter and Z. Hens, The Absorption Coefficient of PbSe/CdSe Core/Shell Colloidal Quantum Dots, Appl. Phys. Lett., 2010, 97(16), 161908, DOI:10.1063/1.3499754.
- A. E. Neeves and M. H. Birnboim, Composite Structures for the Enhancement of Nonlinear-Optical Susceptibility, J. Opt. Soc. Am. B, 2008, 6(4), 787, DOI:10.1364/josab.6.000787.
- P. Reiss, M. Protière and L. Li, Core/Shell Semiconductor Nanocrystals, Small, 2009, 5(2), 154–168, DOI:10.1002/smll.200800841.
- G. Tikhomirov, S. Hoogland, P. E. Lee, A. Fischer, E. H. Sargent and S. O. Kelley, DNA-Based Programming of Quantum Dot Valency, Self-Assembly and Luminescence, Nat. Nanotechnol., 2011, 6(8), 485–490, DOI:10.1038/nnano.2011.100.
- I. L. Medintz, H. T. Uyeda, E. R. Goldman and H. Mattoussi, Quantum Dot Bioconjugates for Imaging, Labelling and Sensing, Nat. Mater., 2005, 4(6), 435–446, DOI:10.1038/nmat1390.
- C. M. Tyrakowski and P. T. Snee, A Primer on the Synthesis, Water-Solubilization, and Functionalization of Quantum Dots, Their Use as Biological Sensing Agents, and Present Status, Phys. Chem. Chem. Phys., 2014, 16(3), 837–855, 10.1039/c3cp53502a.
- A. M. Dennis, D. C. Sotto, B. C. Mei, I. L. Medintz, H. Mattoussi and G. Bao, Surface Ligand Effects on Metal-Affinity Coordination to Quantum Dots: Implications for Nanoprobe Self-Assembly, Bioconjugate Chem., 2010, 21(7), 1160–1170, DOI:10.1021/bc900500m.
- G. P. Anderson, A. Hayhurst, G. Georgiou, I. L. Medintz, E. R. Goldman, J. M. Mauro, H. Mattoussi and B. L. Iverson, Self-Assembled Luminescent CdSe–ZnS Quantum Dot Bioconjugates Prepared Using Engineered Poly-Histidine Terminated Proteins, Anal. Chim. Acta, 2004, 534(1), 63–67, DOI:10.1016/j.aca.2004.03.079.
- G. T. Hermanson, Bioconjugate Techniques, 3rd edn, 2013. DOI:10.1016/C2009-0-64240-9.
- S. Wang, N. Mamedova, N. A. Kotov, W. Chen and J. Studer, Antigen/Antibody Immunocomplex from CdTe Nanoparticle Bioconjugates, Nano Lett., 2002, 2(8), 817–822, DOI:10.1021/nl0255193.
- B. J. Johnson, K. Susumu, P. E. Dawson, W. R. Algar, J. B. Blanco-Canosa, E. Oh, W. J. Hervey, I. L. Medintz, J. B. Delehanty and K. Boeneman, et al., Multifunctional Compact Zwitterionic Ligands for Preparing Robust Biocompatible Semiconductor Quantum Dots and Gold Nanoparticles, J. Am. Chem. Soc., 2011, 133(24), 9480–9496, DOI:10.1021/ja201919s.
- T. Clark, Mobile Point-of-Care Monitors and Diagnostic Device Design, CRC Press, Boca Raton, 2015, vol. 49. DOI:10.2345/0899-8205-49.4.277.
- D. J. Desilets, P. T. Kissinger and F. E. Lytle, Improved Method for Determination of Stern-Volmer Quenching Constants, Anal. Chem., 2005, 59(8), 1244–1246, DOI:10.1021/ac00135a040.
- B. Valeur, Molecular Fluorescence Principles and Applications 2001, ed. M. N. Berberan-Santos, Wiley-VCH, Weinheim, 2nd edn, 2001, vol. 8. DOI:10.1002/3527600248.
- Z. Hens and I. Moreels, Light Absorption by Colloidal Semiconductor Quantum Dots, J. Mater. Chem., 2012, 22(21), 10406–10415, 10.1039/c2jm30760j.
- Z. Lingley, S. Lu and A. Madhukar, A High Quantum Efficiency Preserving Approach to Ligand Exchange on Lead Sulfide Quantum Dots and Interdot Resonant Energy Transfer, Nano Lett., 2011, 11(7), 2887–2891, DOI:10.1021/nl201351f.
- M. A. Hines and P. Guyot-Sionnest, Synthesis and Characterization of Strongly Luminescing ZnS-Capped CdSe Nanocrystals, J. Phys. Chem., 1996, 100(2), 468–471, DOI:10.1021/jp9530562.
- J. Rodriguez-Viejo, M. G. Bawendi, R. Ober, H. Mattoussi, F. V. Mikulec, J. R. Heine, B. O. Dabbousi and K. F. Jensen, (CdSe)ZnS Core–Shell Quantum Dots: Synthesis and Characterization of a Size Series of Highly Luminescent Nanocrystallites, J. Phys. Chem. B, 2002, 101(46), 9463–9475, DOI:10.1021/jp971091y.
- K. K. Song and S. Lee, Highly Luminescent (ZnSe)ZnS Core-Shell Quantum Dots for Blue to UV Emission: Synthesis and Characterization, Curr. Appl. Phys., 2001, 1(2–3), 169–173, DOI:10.1016/S1567-1739(01)00012-8.
- I. Medintz and N. Hildebrandt, FRET - Förster Resonance Energy Transfer: From Theory to Applications, Wiley-VCH, 2014 Search PubMed.
- D. Liu and P. T. Snee, Water-Soluble Semiconductor Nanocrystals Cap Exchanged with Metalated Ligands, ACS Nano, 2011, 5(1), 546–550, DOI:10.1021/nn1025934.
- C. A. Johnson, M. Chern, T. T. Nguyen, A. M. Dennis and J. L. Goldfarb, Ligands and Media Impact Interactions between Engineered Nanomaterials and Clay Minerals, NanoImpact, 2019, 13, 112–122, DOI:10.1016/J.IMPACT.2019.01.004.
- K. Susumu, L. D. Field, E. Oh, M. Hunt, J. B. Delehanty, V. Palomo, P. E. Dawson, A. L. Huston and I. L. Medintz, Purple-, Blue-, and Green-Emitting Multishell Alloyed Quantum Dots: Synthesis, Characterization, and Application for Ratiometric Extracellular pH Sensing, Chem. Mater., 2017, 29(17), 7330–7344, DOI:10.1021/acs.chemmater.7b02174.
- W. Ki Bae, J. Kwak, J. W. Park, K. Char, C. Lee and S. Lee, Highly Efficient Green-Light-Emitting Diodes Based on CdSe@ZnS Quantum Dots with a Chemical-Composition Gradient, Adv. Mater., 2009, 21(17), 1690–1694, DOI:10.1002/adma.200801908.
- Y. Ghosh, B. D. Mangum, J. L. Casson, D. J. Williams, H. Htoon and J. A. Hollingsworth, New Insights into the Complexities of Shell Growth and the Strong Influence of Particle Volume in Nonblinking “Giant” Core/Shell Nanocrystal Quantum Dots, J. Am. Chem. Soc., 2012, 134(23), 9634–9643, DOI:10.1021/ja212032q.
- L. E. Brus, Electron-Electron and Electron-Hole Interactions in Small Semiconductor Crystallites: The Size Dependence of the Lowest Excited Electronic State, J. Chem. Phys., 1984, 80(9), 4403–4409, DOI:10.1063/1.447218.
- I. Moreels, K. Lambert, D. De Muynck, F. Vanhaecke, D. Poelman, J. C. Martins, G. Allan and Z. Hens, Composition and Size-Dependent Extinction Coefficient of Colloidal PbSe Quantum Dots, Chem. Mater., 2007, 19(25), 6101–6106, DOI:10.1021/cm071410q.
- J. Sun and E. M. Goldys, Linear Absorption and Molar Extinction Coefficients in Direct Semiconductor Quantum Dots, J. Phys. Chem. C, 2008, 112(25), 9261–9266, DOI:10.1021/jp800700m.
Footnote |
| † Electronic supplementary information (ESI) available. See DOI: 10.1039/d0an00746c |
| This journal is © The Royal Society of Chemistry 2020 |