 Open Access Article
An efficient assay for identification and quantitative evaluation of potential polysialyltransferase inhibitors†
Xiaoxiao
Guo
,
Jodie R.
Malcolm
,
Marrwa M.
Ali
,
Goreti
Ribeiro Morais
,
Steven D.
Shnyder
,
Paul M.
Loadman
,
Laurence H.
Patterson
and
Robert A.
Falconer
 *
*
Institute of Cancer Therapeutics, Faculty of Life Sciences, University of Bradford, Bradford BD7 1DP, UK. E-mail: r.a.falconer1@bradford.ac.uk; Tel: +44 (0)1274 235842
First published on 8th May 2020
Abstract
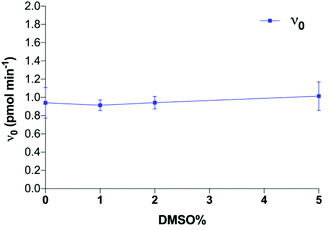
The polysialyltransferases (polySTs) catalyse the polymerisation of polysialic acid, which plays an important role in tumour metastasis. While assays are available to assess polyST enzyme activity, there is no methodology available specifically optimised for identification and quantitative evaluation of potential polyST inhibitors. The development of an HPLC-fluorescence-based enzyme assay described within includes a comprehensive investigation of assay conditions, including evaluation of metal ion composition, enzyme, substrate and acceptor concentrations, temperature, pH, and tolerance to DMSO, followed by validation using known polyST inhibitors. Thorough analysis of each of the assay components provided a set of optimised conditions. Under these optimised conditions, the experimentally observed Ki value for CMP, a competitive polyST inhibitor, was strongly correlated with the predicted Ki value, based on the classical Cheng–Prusoff equation [average fold error (AFE) = 1.043]. These results indicate that this assay can provide medium-throughput analysis for enzyme inhibitors with high accuracy, through determining the corresponding IC50 values with substrate concentration at the KM, without the need to perform extensive kinetic studies for each compound. In conclusion, an in vitro cell-free assay for accurate assessment of polyST inhibition is described. The utility of the assay for routine identification of potential polyST inhibitors is demonstrated, allowing quantitative measurement of inhibition to be achieved, and exemplified through assessment of full competitive inhibition. Given the considerable and growing interest in the polySTs as important anti-metastatic targets in cancer drug discovery, this is a vital tool to enable preclinical identification and evaluation of novel polyST inhibitors.
1. Introduction
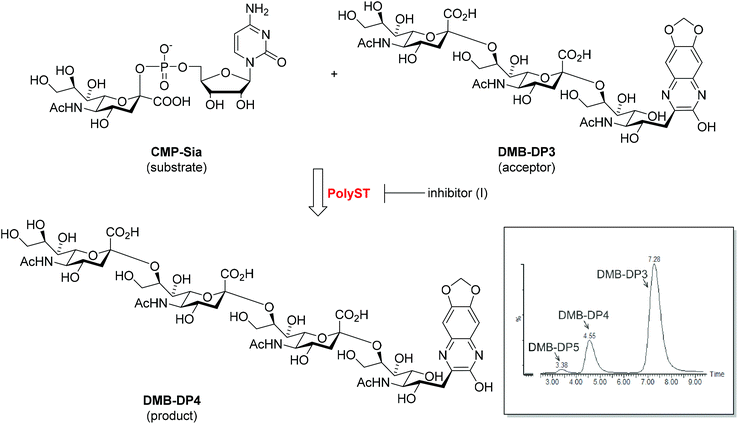
Polysialyltransferases (polySTs), specifically enzymes ST8SiaII and ST8SiaIV, catalyse the biosynthesis of polysialic acid (polySia), which is a unique carbohydrate homopolymer of N-acetylneuraminic acid (sialic acid, Neu5Ac), linked specifically by α-2,8 glycosidic bonds. PolySia is found on several proteins in humans, but is predominantly observed as a post-translational modification of the neural cell adhesion molecule (NCAM). Whilst polySTs are active embryologically, with roles including driving the polySia-dependent migration of cells of neural crest origin in the foetus, polySia expression is generally dramatically reduced post-partum,1,2 with relatively low level polySia expression only detectable in discrete areas of the brain, and in blood, milk, semen, and on immune cells.2–7 Crucially, significant polySia expression is observed in many cancers, principally those of neuroendocrine origin, where the expression of polySTs is re-capitulated and is associated with tumour cell migration, invasion, and the events associated with metastasis. This is closely correlated with poor prognosis in the clinic.8–14 The polySTs, and ST8SiaII in particular (generally thought to be the dominant enzyme in tumours where polySia is expressed8,15), have significant potential as drug targets in a number of difficult-to-treat cancers, notably neuroblastoma and small cell lung cancer.8,16A number of in vitro assays have been developed and reported for the evaluation of polyST enzyme activity, utilising the enzyme, the substrate CMP-sialic acid, and the acceptor NCAM.17–19 The Gerardy-Schahn group recently reported the utility of a non-ganglioside fluorescent acceptor, DMB-DP3, as a convenient substitute for NCAM, enabling analysis of polymerisation. DMB-DP3 is a trimer (degree of polymerisation, DP = 3) of α-2,8-linked sialic acid (‘DP3’) derivatised with a fluorescent 1,2-diamino-4,5-methylenedioxybenzene (DMB) label thereby forming ‘DMB-DP3’. This was successfully employed to assess bacterial and murine ST8SiaII enzyme activity.18 Building on this work, we previously utilised DMB-DP3 to determine the activity of human polySTs, monitoring polymerisation of DMB-DP3 to predominantly DMB-DP4 (Fig. 1).20 The fluorescent acceptor and product in the enzyme reaction are separated by reversed-phase chromatography over a short timeframe (10 min), while being simultaneously visualised by fluorescence detection (Fig. 1, inset), allowing rapid analysis. Whilst adequate for measurement of enzyme activity, this assay lacks the characteristics to deduce accurate kinetics required for detailed analysis of potential enzyme inhibitors.
In our research focused on the identification of novel polyST inhibitors, we require a reproducible medium-throughput quantitative assay for determination of enzyme inhibition, with the key additional requirement for robust detailed enzyme kinetics information, and compound mode of inhibition (i.e. competitive or non-competitive).20,21 Herein we report a cell-free polyST assay that meets these demands. We have systematically investigated the assay parameters that are predicated to influence the underlying enzyme catalysis with a view to providing a sound basis on which to reliably determine mode of inhibition, IC50 and Ki values for putative inhibitors, the latter through both prediction and experiment. The optimised assay conditions were validated by evaluating known polyST small molecule inhibitors.
2. Materials and methods
2.1 Reagents
The following materials were obtained from Sigma-Aldrich, UK: cytidine-5′-monophospho-N-acetylneuraminic acid sodium salt (CMP-Sia, C8271), 4,5-methylenedioxy-1,2-phenylenediamine dihydrochloride (DMB, D4784), anhydrous magnesium chloride (MgCl2, M8266), manganese chloride (MnCl2, 8054), potassium chloride (KCl, P9333), sodium cacodylate trihydrate (C4945), glycerol solution (G5516), ammonium formate (AmF, F-2004), β-mercaptoethanol (M-7522), dimethyl sulfoxide (DMSO, D8418), trifluoroacetic acid: (98% Reagent Grade, T6508) and sodium hydrosulfite (157951).N-Acetylneuraminic acid trimer DP3 (α,2–8) was purchased from Nacalai Tesque, Japan (00641-52). Human ST8SiaII recombinant protein was purchased from R&D systems (6590-GT, USA). Tris-base was purchased from Fisher Bioreagents UK (BP152-1). Sodium hydroxide was obtained from Alfa Aesar (A16037). The reversed-phase chromatography column (RPB, 2.1 × 250 mm, 5 μm particle size) was purchased from Hichrom Ltd, UK.
2.2 DMB-DP3 synthesis and purification
DMB-DP3 synthesis was conducted as described previously.20 Briefly, DP3 (10 mg ml−1) was dissolved in a labelling solution containing DMB (20 mM), sodium hydrosulfite (40 mM) and β-mercaptoethanol (1 M). The mixture was then added to an equal volume of ice-cold trifluoroacetic acid (40 mM), followed by incubation at 4 °C overnight. The reaction was subsequently quenched by addition of one fifth of the reaction volume of sodium hydroxide (0.2 M). The synthesised DMB-DP3 was subsequently purified on a reversed-phase liquid chromatography-fluorescence detection system, as previously described.202.3 Enzyme assay characterisation
The initial polyST enzyme assay conditions were as described previously for the assessment of enzyme activity,20 with minor modifications. Specifically, recombinant polyST (ST8SiaII) protein (250 ng) and DMB-DP3 (50 μM) were added to a solution containing MgCl2 (20 mM), MnCl2 (10 mM), 5% glycerol, and sodium cacodylate (10 mM, pH 6.7, adjusted by addition of HCl). The reaction was initiated by addition of the substrate, CMP-Sia (500 μM), and maintained at 25 °C for 2 h. The final reaction volume was 10 μl. The enzyme reaction was quenched by addition of 9 volumes of a stopping buffer containing Tris-HCl (100 mM, pH 8.0) and EDTA (20 mM), followed by incubation at 50 °C for 10 min. A 90% methanol precipitation step was then performed to remove the recombinant proteins prior to HPLC-fluorescence analysis, using centrifugation at 14![[thin space (1/6-em)]](https://www.rsc.org/images/entities/char_2009.gif) 000 rpm (20
000 rpm (20![[thin space (1/6-em)]](https://www.rsc.org/images/entities/char_2009.gif) 000g).
000g).
2.4 HPLC-fluorescence analysis of polyST catalytic activity
PolyST enzymatic activity was determined by analysis of the conversion of DMB-DP3 to DMB-DP4 (and DMB-DP5, which is often additionally detected), using a reversed-phase HPLC system in conjunction with fluorescence detection. Samples for analysis were subjected to separation with a reversed-phase chromatographic column (2.1 × 250 mm, 5 μm, RPB-Hichrom, UK) eluting with methanol (16% in HPLC grade water) and ammonium formate (5 mM) using an isocratic mobile phase (350 μl min−1) at 20 °C. Each chromatographic separation was conducted over 10 min. The DMB-labelled acceptor (DMB-DP3) and products (DMB-DP4 & DMB-DP5) were visualised using a fluorescence detector (Ex 373 nm/Em 448 nm (ref. 20)). The acquired chromatograms were analysed by Masslynx and Quanlynx software (Waters, UK).2.5 Assessment relative potencies (IC50 values) for polyST inhibitors
For determination of IC50 values for known polyST inhibitors (CMP, and 5-methyl-CMP), enzymatic reactions were carried out in the presence of each compound at pre-determined concentrations for 2 h. Enzyme reactions were carried out in the presence of 24 μM substrate (CMP-Sia), which is the KM at the optimised conditions (see below). Experiments were performed in triplicate.2.6 Assessment of inhibitory constant (Ki) for CMP
In order to determine inhibitory constant (Ki) for the known polyST inhibitor CMP, enzymatic reactions were performed in the presence of the inhibitor at each single concentration, with increasing concentrations of CMP-Sia substrate (0.5–5 KM) at 25 °C at selected time points (specifically, 0.5, 1, 2, 3, and 5 h). Experiments were performed in triplicate.2.7 Kinetics data analysis
PolyST enzymatic conversion of fluorescent acceptor (DMB-DP3) to fluorescent products (DMB-DP4 and DMB-DP5) was calculated from fluorescence signal peak areas (measured as Relative Fluorescence Units, RFU) of products and acceptor molecules, according to eqn (1): | (1) |
Enzymatic transfer of Sia from substrate (CMP-Sia) to fluorescent acceptor was calculated from the percentage concentration of transferred Sia against total substrate concentration, according to eqn (2):
 | (2) |
Percent enzyme inhibition was calculated using the % conversion values, based on eqn (1), obtained in the presence and absence of inhibitor according to the eqn (3):
| % Inhibition = [1 − Conversion (i)/Conversion (C)] × 100% | (3) |
Inhibitor compound potency (IC50 value) was determined by plotting percentage inhibition as a function of inhibitor concentration and fitting in a normalised dose–response non-linear regression curve, using Graphpad Prism 6 software.
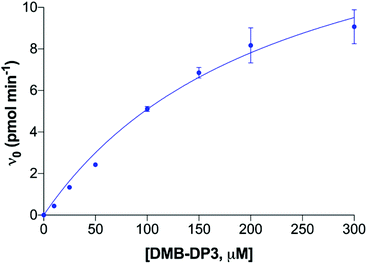
Initial velocities (v0) for enzymatic reactions were calculated using differential equations derived from the respective enzyme reaction progress curves, using a time point of 0.01 h. The enzyme kinetics parameters were calculated by plotting initial reaction velocities [v0] versus substrate concentration [S] and fitting the data points by non-linear regression to the classical Michaelis–Menten steady-state model:
| V0 = V(app)max × [S]/([S] + K(app)M) | (4) |
The catalytic constant for the enzyme was estimated by the eqn (5), assuming a molecular mass of 41 kDa per subunit of ST8SiaII:
| kcat = Vmax/[ETotal] | (5) |
The accuracy of the prediction for experimentally-measured intrinsic potency (Ki) values from half apparent potencies (IC50/2) was determined by calculating the average fold error (AFE) according to eqn (6).22
AFE = 10![[thin space (1/6-em)]](https://www.rsc.org/images/entities/char_2009.gif) exp exp![[thin space (1/6-em)]](https://www.rsc.org/images/entities/char_2009.gif) [1/n [1/n![[thin space (1/6-em)]](https://www.rsc.org/images/entities/char_2009.gif) ∑log(Predicted Ki/measured Ki)] ∑log(Predicted Ki/measured Ki)] | (6) |
This methodology is based on absolute values of the logarithm of the ratio of predicted to measured values, so that negative values are also converted to positive values. An AFE value of 1 represents an ideal prediction.22
All data points presented are representative of 3 independent experiments, each with a minimum of 2 technical replicates.
3. Results and discussion
3.1 Assay development
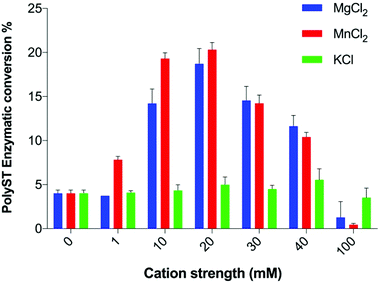
Measuring the effect of small molecules on the cell-free catalytic activity of polyST is an effective way to identify novel inhibitors of this enzyme. Existing assays reported in the literature have focused on maximising enzyme activity, rather than providing the optimum conditions to measure enzyme inhibition, or to derive important information about mode of inhibition and kinetics data. We have thus undertaken an exploration of the reaction conditions, and have arrived at an assay with highly effective capability for inhibitor detection, including determination of Ki values and mode of inhibition. Given that ST8SiaII is the predominant of the two polySTs in cancer, this enzyme was the focus for these studies.We observed that polyST was significantly more active in the presence of Mn2+ than Mg2+ up to a concentration of 20 mM (Fig. 2). Higher concentrations of either ion led to a reduction in enzyme activity, as measured by conversion of acceptor DMB-DP3 to products DMB-DP4/DMB-DP5. This is in agreement with previous studies suggesting that Mn2+ was more important for human polyST activities than Mg2+.24,26,29 K+ ions exhibited very little effect on enzyme activity, while Mn2+ and Mg2+ ions significantly improved enzymatic activity (as compared to the control) up to a concentration of 40 mM, above which activity was reduced. Both divalent cations significantly improved enzyme activity at 20 mM. Furthermore, we demonstrated that the effects were not additive (Fig. S1†). The optimum metal ion composition in the enzyme assay buffer was thus selected as 20 mM MnCl2, in the absence of MgCl2 and KCl.
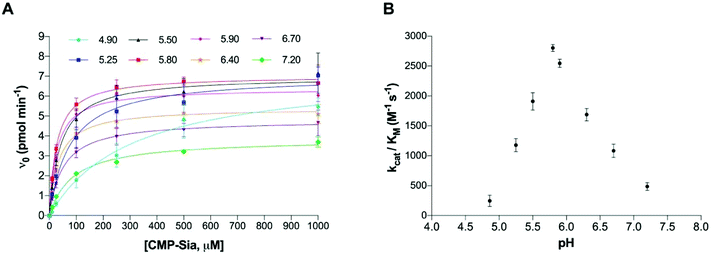
The corresponding kinetic parameters, Vmax, kcat, substrate (CMP-Sia) KM and catalytic efficiency (kcat/KM) of polyST for CMP-Sia, measured at both acceptor concentrations, are summarised in Table 1. The results indicate that pH 5.8 was optimal for catalytic activity, at both low and high concentrations of the acceptor. This indicates that the effect of pH on the catalytic efficiency of polyST is independent of the acceptor concentration. The catalytic efficiencies, measured at 150 μM DMB-DP3, were then plotted against pH (Fig. 4B). These results are consistent with previously reported findings for the activity of human and chick brain polySTs for NCAM polysialylation with CMP-Sia, albeit in MES buffer and utilising NCAM as acceptor.23,26,29 It is interesting that the enzyme activity is apparently optimal in slightly acidic conditions. A potential explanation for this phenomenon may be due to the pH in the Golgi apparatus in malignant cells (where this enzyme is usually located) being mildly acidic at pH 5.8–6.2.33,34 The optimum pH for the assay was thus selected as 5.8.
| pH | 50 μM DMB-DP3 | 150 μM DMB-DP3 | ||||||
|---|---|---|---|---|---|---|---|---|
| V (app)max (pmol min−1 μg−1) | k cat (s−1) | K (app)M (μM) | k cat/KM (s−1 M−1) | V (app)max (pmol min−1 μg−1) | k cat (s−1) | K (app)M (μM) | k cat/KM (s−1 M−1) | |
| 5.25 | 10.41 ± 0.26 | 7.11 × 10⁻³ | 52.39 ± 6.32 | 135.73 | 28.82 ± 0.58 | 0.079 | 67.32 ± 5.91 | 1170.31 |
| 5.5 | 9.17 ± 0.19 | 6.27 × 10⁻³ | 34.54 ± 3.39 | 181.41 | 27.45 ± 0.84 | 0.075 | 39.16 ± 5.71 | 1916.11 |
| 5.8 | 7.65 ± 0.29 | 5.23 × 10⁻³ | 23.64 ± 5.08 | 220.95 | 28.10 ± 0.48 | 0.077 | 26.88 ± 2.33 | 2857.78 |
| 6.7 | 5.57 ± 0.34 | 3.81 × 10⁻³ | 57.29 ± 15.46 | 66.45 | 19.20 ± 0.58 | 0.052 | 50.34 ± 6.85 | 1042.50 |
| 7.2 | 3.78 ± 0.36 | 2.59 × 10⁻³ | 92.35 ± 30.16 | 27.98 | 15.42 ± 0.42 | 0.042 | 86.98 ± 9.33 | 484.44 |
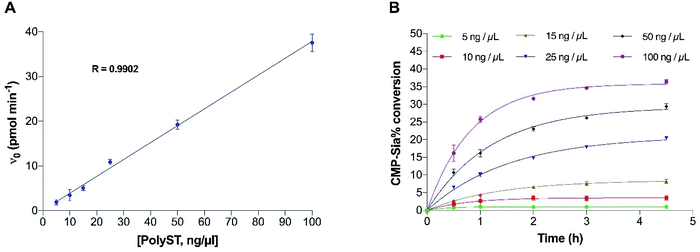
To ensure the final enzyme concentration fell within the range that provides enzyme reaction linearity, the effect of enzyme concentration on the reaction velocity was analysed, and is shown in Fig. 5A. As expected, initial velocity increased linearly with increased enzyme concentration within the measured range of 5 to 100 ng μL−1, with saturated concentrations of both substrate (500 μM) and acceptor (200 μM). This indicates that the assay is reliable for quantitative studies using enzyme concentrations within this range. Next, the corresponding donor substrate (CMP-Sia) conversion was analysed at each time point (Fig. 5B). At our routine screening time point (2 h), substrate conversion was approximately 15%, when the enzyme concentration was 25 ng μL−1, while the conversion was lower than 10% when the enzyme concentration was lower than 15 ng μL−1, in the presence of the saturated concentrations of CMP-Sia (500 μM) (Fig. 5B). Moreover, the donor substrate conversion at its original KM (100 μM, pH 6.7) was also analysed at various enzyme concentrations (Fig. S2†). Enzyme conversion significantly reduced to approximately 8% in the presence of 25 ng μL−1 enzyme, and to lower than 3% when using enzyme concentrations lower than 15 ng μL−1 (Fig. S2†). The low conversion observed at lower enzyme concentrations (5–15 ng μL−1) resulted in insufficient fluorescent signal (from the DMB-DP4 product) for reliable detection. In contrast, a substrate conversion of higher than 15%/2 h may not be favourable since the greater substrate depletion will not provide the ideal steady-state conditions previously discussed.35,36 With these factors in mind, an enzyme concentration of 25 ng μL−1 (providing a substrate conversion of 8% at the 2 h screening time point) was thus selected for the optimised assay, with the concentration of CMP-Sia at its KM.
3.2 Assay validation using known polyST inhibitors
In order to test if the assay conditions are suitable for determination of IC50, mode of inhibition and Ki of potential polyST inhibitors, we next explored the effect of known compounds CMP and 5-methyl-CMP (5-Me-CMP).37 CMP and 5-Me-CMP have both been previously reported as inhibitors of polyST (in addition to other sialyltransferases).38 Cytidine was also evaluated as a negative control, i.e. a compound known to have no effect on polyST catalytic activity (structures shown in Fig. 8). | ||
| Fig. 8 Structures of cytidine monophosphate (CMP), 5-methyl-cytidine monophosphate (5-Me-CMP) and cytidine. | ||
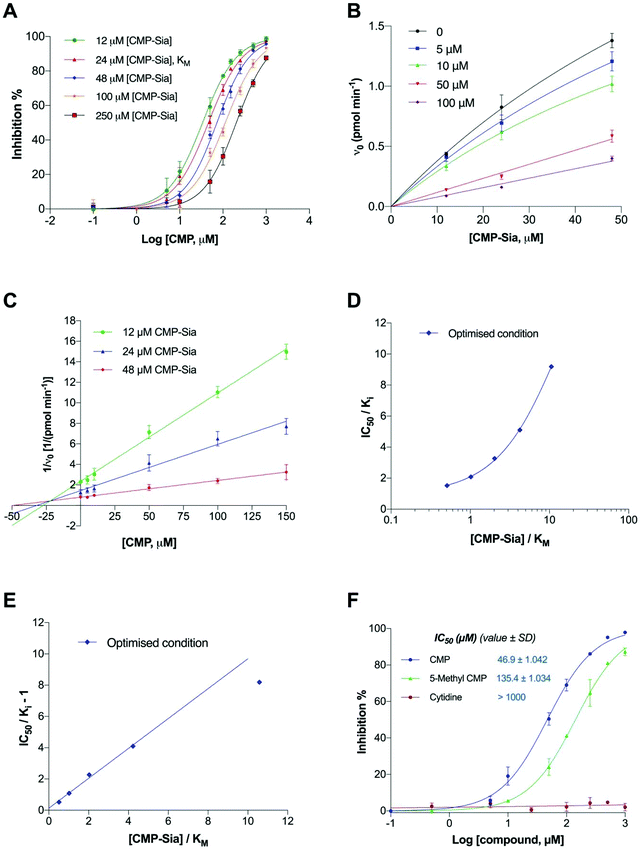
The inhibitory potency of CMP is shown in Fig. 9A. The inhibitory (IC50) dose–response curves shifting to the right with increasing concentrations of substrate (CMP-Sia), in the optimised assay conditions, is consistent with competitive inhibition. Enzyme kinetic parameters for CMP were thereby evaluated (Fig. 9B). In the classical Dixon plot (Fig. 9C), lines intersected in the second quadrant. In the Cornish-Bowden plot (Fig. S4†), the parallel lines and higher y-intercept ([S]/V0) values with increased substrate concentration are consistent with competitive inhibition.39 Taken together, these data provide further evidence for the competitive mode of inhibition for CMP.
To further evaluate the reliability of the assay in determining the potency of enzyme inhibitors, the intrinsic potency (Ki) of CMP was also determined from the Dixon plot, using the new assay conditions (Fig. 9C and Table 2). Subsequently, the ratio of the IC50 over the observed Ki was plotted as a function of the ratio of the substrate over KM. The ratio of IC50/Ki of CMP increased with increasing substrate concentration (Fig. 9D), demonstrating that CMP competed with the substrate in the optimised assay conditions. Furthermore, we also confirmed that CMP does not compete with the acceptor DMB-DP3 (Fig. S5†).
| CMP IC50 (μM) | K M (CMP-Sia, μM) | Predicted Ki (μM) | Observed Ki (μM) | AFE (Ki) | ||||
|---|---|---|---|---|---|---|---|---|
| CMP-Sia (μM) | 12 | 24 | 48 | 100 | ||||
| 0.5KM | K M | 2KM | 4KM | |||||
| Optimised assay | 33.76 | 46.16 | 72.45 | 112.9 | 23.64 ± 5.08 | 22.91 ± 0.521 | 22.12 ± 0.216 | 1.043 |
IC50 is not a direct indicator of enzyme binding affinity, although the two can be related for competitive inhibitors by the Cheng–Prusoff equation.40 According to the Cheng–Prusoff theory for competitive inhibition, the substrate concentration has distinct effects on the apparent potency (IC50) of inhibitors of different classes. When the substrate concentration is lower than its KM, it favours the screening and identification of competitive inhibitors, and disfavours screening uncompetitive inhibitors, which only bind to substrate-bound enzymes, whereas the substrate concentration has no effect on changing the apparent potency (IC50) for non-competitive inhibitors.40–42
The IC50 values of competitive inhibitors are close to their Ki values when the substrate concentration is significantly lower than the KM, while the IC50 values of uncompetitive inhibitors only reflect their Ki values when the substrate concentration is significantly higher than the KM. In contrast, the IC50 values of non-competitive inhibitors are independent from the concentration of enzyme substrates.40,43 Therefore, in general, to identify enzyme inhibitors from all modalities, the most appropriate substrate concentration is at the KM, which allows for balanced assay conditions, with minimum bias towards any of these important inhibitor classes.42
To directly determine if the relationship between measured IC50 and Ki for CMP fits well in the Cheng–Prusoff equation (IC50/Ki = 1 + [S]/KM), values of (IC50/Ki − 1) were plotted linearly against the ratios of [S]/KM, as shown in Fig. 9E. It is clear that the graph generated from the optimised assay conditions fits better to the Cheng–Prusoff equation, when the substrate concentration is five times lower than its KM, than that obtained from the initial assay conditions (Fig. S6†).
In addition, according to Cheng–Prusoff, the Ki value for a competitive inhibitor should ideally be 50% of the IC50 value in a given assay, when the substrate concentration equal to the KM. Therefore, using IC50/2, the predicted Ki value is reported alongside the observed Ki for CMP in Table 2. The observed Ki value correlates well to the predicted value [IC50/2([S] = KM)] in the optimised assay (average fold error, AFE = 1.043), when substrate concentrations are in the range of (0.5–4)KM, indicating feasibility for utilising IC50 values generated within these substrate concentrations for predicting Ki of CMP.
We next investigated assay sensitivity in terms of being able to distinguish compounds with potentially similar potencies, by determining the IC50 value of a CMP analogue (5-Me-CMP), in comparison to CMP. Cytidine was used as control.
As shown in Fig. 9F, CMP exhibited slightly higher enzymatic inhibition than 5-Me-CMP in the optimised assay, and these results are clearly distinguishable. These relative potencies are in agreement with findings reported for inhibition of polysialylation of the neural cell adhesion molecule (NCAM) catalysed by recombinant human polyST enzymes in vitro, albeit in an assay based on 14C-labelled sialic acid incorporation into polySia, and subsequent SDS-PAGE of the polymer produced.37 The negative control, cytidine, had no inhibitory effects even at 1 mM (as expected).
In summary, these data demonstrate the opportunity to predict intrinsic potencies (Ki) with confidence from the corresponding apparent potency values (IC50) at the KM, avoiding the need for extensive kinetic experiments normally required for such analysis.
![[thin space (1/6-em)]](https://www.rsc.org/images/entities/char_2009.gif) 000 rpm (20
000 rpm (20![[thin space (1/6-em)]](https://www.rsc.org/images/entities/char_2009.gif) 000g).
000g).
4. Conclusions
We report a sensitive, accurate, reproducible and robust enzyme assay for screening novel polyST enzyme inhibitors that has been optimised through a comprehensive assay development process. The optimised assay conditions allow quantitative measurements of polyST activity and compound inhibition, and the usefulness of the assay has been demonstrated in assessment of full competitive inhibition. These assay conditions additionally provide for the ability to confidently estimate Ki values from IC50 values for enzyme inhibitors. Given the significant interest in the polyST enzymes as important anti-metastatic targets in cancer drug discovery, this is a vital tool to enable identification and quantitative evaluation of novel polyST inhibitors, and to gain early insight into mode of inhibition. This work represents an essential step towards ultimately developing a novel clinically-useful therapeutic.Author contributions
Conceived and designed the experiments: XG & RAF. Performed the experiments: XG, JRM, MMA & GRM. Data analysis: XG, JRM, MMA, & GRM. Supervisory team: SDS, PML, RAF. Manuscript composition and editing: XG, LHP & RAF. Final proof-reading: All.Conflicts of interest
There are no conflicts to declare.Acknowledgements
Ms Amanda Race is thanked for HPLC technical expertise. This work was funded by Yorkshire Cancer Research (LHP, RAF) and the Wellcome Trust (RAF).References
- J. L. Bruses and U. Rutishauser, Biochimie, 2001, 83, 635–643 CrossRef CAS PubMed.
- J. Finne, J. Biol. Chem., 1982, 257, 11966–11970 CAS.
- K. Angata, J. Nakayama, B. Fredette, K. Chong, B. Ranscht and M. Fukuda, J. Biol. Chem., 1997, 272, 7182–7190 CrossRef CAS PubMed.
- K. Zlatina, M. Saftenberger, A. Kuhnle, C. E. Galuska, U. Gartner, A. Rebl, M. Oster, A. Vernunft and S. P. Galuska, Int. J. Mol. Sci., 2018, 19, 1679 CrossRef PubMed.
- U. Yabe, C. Sato, T. Matsuda and K. Kitajima, J. Biol. Chem., 2003, 278, 13875–13880 CrossRef CAS PubMed.
- P. Simon, S. Baumner, O. Busch, R. Rohrich, M. Kaese, P. Richterich, A. Wehrend, K. Muller, R. Gerardy-Schahn, M. Muhlenhoff, H. Geyer, R. Geyer, R. Middendorff and S. P. Galuska, J. Biol. Chem., 2013, 288, 18825–18833 CrossRef CAS PubMed.
- C. Ulm, M. Saffarzadeh, P. Mahavadi, S. Muller, G. Prem, F. Saboor, P. Simon, R. Middendorff, H. Geyer, I. Henneke, N. Bayer, S. Rinne, T. Lutteke, E. Bottcher-Friebertshauser, R. Gerardy-Schahn, D. Schwarzer, M. Muhlenhoff, K. T. Preissner, A. Gunther, R. Geyer and S. P. Galuska, Cell. Mol. Life Sci., 2013, 70, 3695–3708 CrossRef CAS PubMed.
- R. A. Falconer, R. J. Errington, S. D. Shnyder, P. J. Smith and L. H. Patterson, Curr. Cancer Drug Targets, 2012, 12, 925–939 CrossRef CAS PubMed.
- M. Suzuki, M. Suzuki, J. Nakayama, A. Suzuki, K. Angata, S. Chen, K. Sakai, K. Hagihara, Y. Yamaguchi and M. Fukuda, Glycobiology, 2005, 15, 887–894 CrossRef CAS PubMed.
- U. Valentiner, M. Muhlenhoff, U. Lehmann, H. Hildebrandt and U. Schumacher, Int. J. Oncol., 2011, 39, 417–424 CAS.
- S. C. Schreiber, K. Giehl, C. Kastilan, C. Hasel, M. Muhlenhoff, G. Adler, D. Wedlich and A. Menke, Gastroenterology, 2008, 134, 1555–1566 CrossRef CAS PubMed.
- S. M. Elkashef, S. J. Allison, M. Sadiq, H. A. Basheer, G. Ribeiro Morais, P. M. Loadman, K. Pors and R. A. Falconer, Sci. Rep., 2016, 6, 33026 CrossRef CAS PubMed.
- L. Gong, X. Zhou, J. Yang, Y. Jiang and H. Yang, Oncol. Rep., 2017, 37, 131–138 CrossRef PubMed.
- F. Tanaka, Y. Otake, T. Nakagawa, Y. Kawano, R. Miyahara, M. Li, K. Yanagihara, J. Nakayama, I. Fujimoto, K. Ikenaka and H. Wada, Cancer Res., 2000, 60, 3072–3080 CAS.
- K. Bork, D. Gagiannis, A. Orthmann, W. Weidemann, M. Kontou, W. Reutter and R. Horstkorte, J. Neurochem., 2007, 103(Suppl. 1), 65–71 CrossRef CAS PubMed.
- X. Guo, S. M. Elkashef, P. M. Loadman, L. H. Patterson and R. A. Falconer, Carbohydr. Polym., 2019, 224, 115145 CrossRef CAS PubMed.
- S. Inoue, S. L. Lin, Y. C. Lee and Y. Inoue, Glycobiology, 2001, 11, 759–767 CrossRef CAS PubMed.
- T. G. Keys, F. Freiberger, J. Ehrit, J. Krueger, K. Eggers, F. F. Buettner and R. Gerardy-Schahn, Anal. Biochem., 2012, 427, 107–115 CrossRef CAS PubMed.
- J. Ehrit, T. G. Keys, M. Sutherland, S. Wolf, C. Meier, R. A. Falconer and R. Gerardy-Schahn, ChemBioChem, 2017, 18, 1332–1337 CrossRef CAS PubMed.
- S. M. Elkashef, M. Sutherland, L. H. Patterson, P. M. Loadman and R. A. Falconer, Analyst, 2016, 141, 5849–5856 RSC.
- Y. M. Al-Saraireh, M. Sutherland, B. R. Springett, F. Freiberger, G. Ribeiro Morais, P. M. Loadman, R. J. Errington, P. J. Smith, M. Fukuda, R. Gerardy-Schahn, L. H. Patterson, S. D. Shnyder and R. A. Falconer, PLoS One, 2013, 8, e73366 CrossRef CAS PubMed.
- L. J. Haupt, F. Kazmi, B. W. Ogilvie, D. B. Buckley, B. D. Smith, S. Leatherman, B. Paris, O. Parkinson and A. Parkinson, Drug Metab. Dispos., 2015, 43, 1744–1750 CrossRef CAS PubMed.
- S. Kitazume-Kawaguchi, S. Kabata and M. Arita, J. Biol. Chem., 2001, 276, 15696–15703 CrossRef CAS PubMed.
- N. Kojima, M. Kono, Y. Yoshida, Y. Tachida, M. Nakafuku and S. Tsuji, J. Biol. Chem., 1996, 271, 22058–22062 CrossRef CAS PubMed.
- N. Kojima, Y. Tachida, Y. Yoshida and S. Tsuji, J. Biol. Chem., 1996, 271, 19457–19463 CrossRef CAS PubMed.
- M. B. Sevigny, J. Ye, S. Kitazume-Kawaguchi and F. A. Troy 2nd, Glycobiology, 1998, 8, 857–867 CrossRef CAS PubMed.
- J. Cheng, H. Yu, K. Lau, S. Huang, H. A. Chokhawala, Y. Li, V. K. Tiwari and X. Chen, Glycobiology, 2008, 18, 686–697 CrossRef CAS PubMed.
- D. Nakata, L. Zhang and F. A. Troy 2nd, Glycoconjugate J., 2006, 23, 423–436 CrossRef CAS PubMed.
- S. Oka, J. L. Bruses, R. W. Nelson and U. Rutishauser, J. Biol. Chem., 1995, 270, 19357–19363 CrossRef CAS PubMed.
- T. Lindhout, C. R. Bainbridge, W. J. Costain, M. Gilbert and W. W. Wakarchuk, PLoS One, 2013, 8, e69888 CrossRef CAS PubMed.
- M. H. Ross, J. O. Ely and J. G. Archer, J. Biol. Chem., 1951, 192, 561–568 CAS.
- V. Sancenon, W. H. Goh, A. Sundaram, K. S. Er, N. Johal, S. Mukhina, G. Carr and S. Dhakshinamoorthy, Biomol. Detect. Quantif., 2015, 4, 1–9 CrossRef CAS PubMed.
- A. Rivinoja, F. M. Pujol, A. Hassinen and S. Kellokumpu, Ann. Med., 2012, 44, 542–554 CrossRef CAS PubMed.
- A. Rivinoja, N. Kokkonen, I. Kellokumpu and S. Kellokumpu, J. Cell Physiol., 2006, 208, 167–174 CrossRef CAS PubMed.
- G. Wu, Y. Yuan and C. N. Hodge, J. Biomol. Screening, 2003, 8, 694–700 CrossRef CAS PubMed.
- R. A. Copeland, Methods Biochem. Anal., 2005, 46, 1–265 Search PubMed.
- T. Miyazaki, K. Angata, P. H. Seeberger, O. Hindsgaul and M. Fukuda, Glycobiology, 2008, 18, 187–194 CrossRef CAS PubMed.
- L. Wang, Y. Liu, L. Wu and X. L. Sun, Biochim. Biophys. Acta, 2016, 1864, 143–153 CrossRef CAS PubMed.
- A. Cornish-Bowden, Biochem. J., 1974, 137, 143–144 CrossRef CAS PubMed.
- Y. Cheng and W. H. Prusoff, Biochem. Pharmacol., 1973, 22, 3099–3108 CrossRef CAS PubMed.
- M. G. Acker and D. S. Auld, Perspect. Sci., 2014, 1, 56–73 CrossRef.
- J. Yang, R. A. Copeland and Z. Lai, J. Biomol. Screening, 2009, 14, 111–120 CrossRef CAS PubMed.
- R. A. Copeland, Anal. Biochem., 2003, 320, 1–12 CrossRef CAS PubMed.
Footnote |
| † Electronic supplementary information (ESI) available. See DOI: 10.1039/d0an00721h |
| This journal is © The Royal Society of Chemistry 2020 |

