
A high-throughput SAMDI-mass spectrometry assay for isocitrate dehydrogenase 1†
Sarah E.
Anderson
a,
Natalie S.
Fahey
b,
Jungsoo
Park
c,
Patrick T.
O'Kane
a,
Chad A.
Mirkin
 abc and
Milan
Mrksich
*abd
abc and
Milan
Mrksich
*abd
aDepartment of Chemistry, Northwestern University, Evanston, Illinois 60208, USA. E-mail: milan.mrksich@northwestern.edu
bDepartment of Biomedical Engineering, Northwestern University, Evanston, Illinois 60208, USA
cInterdisciplinary Biological Sciences (IBiS) Program, Northwestern University, Evanston, Illinois 60208, USA
dDepartment of Cell and Molecular Biology, Northwestern University, Evanston, Illinois 60208, USA
First published on 9th April 2020
Abstract
The enzyme isocitrate dehydrogenase 1 (IDH1) catalyzes the conversion of isocitrate to alpha-ketoglutarate (αKG) and has emerged as an important therapeutic target for glioblastoma multiforme (GBM). Current methods for assaying IDH1 remain poorly suited for high-throughput screening of IDH1 antagonists. This paper describes a high-throughput and quantitative assay for IDH1 that is based on the self-assembled monolayers for matrix-assisted laser desorption/ionization-mass spectrometry (SAMDI-MS) method. The assay uses a self-assembled monolayer presenting a hydrazide group that covalently captures the αKG product of IDH1, where it can then be detected by MALDI-TOF mass spectrometry. Co-capture of an isotopically-labeled αKG internal standard allows the αKG concentration to be quantitated. The assay was used to analyze a series of standard αKG solutions and produced minimal error in measured αKG concentration values. The suitability of the assay for high-throughput analysis was evaluated in a 384-sample biochemical IDH1 screen. Cells expressing IDH1 were lysed and the lysate was applied to the monolayer to capture αKG, which was then quantitated using the SAMDI-MS assay. Cells in which IDH1 expression was reduced by small-interfering RNA exhibited a corresponding decrease in αKG concentration as measured by the assay. Application of the assay toward the high-throughput screening of IDH1 inhibitors or knockdown agents may facilitate the discovery of treatments for GBM.
Introduction
Isocitrate dehydrogenase 1 (IDH1) is a cytosolic enzyme that catalyzes the oxidative decarboxylation of isocitrate to alpha-ketoglutarate (αKG) and the simultaneous reduction of NADP+ to NADPH (Fig. 1).1 While long established as a regulator of αKG-dependent dioxygenases and cellular redox state, IDH1 has recently been implicated in glioblastoma multiforme (GBM), an aggressive class of malignant brain tumors.1–3 A 2017 study revealed that wild-type IDH1 is consistently overexpressed in primary GBM cells relative to normal brain cells.3 IDH1 overexpression leads to an excess of cytosolic NADPH, which in turn increases the synthesis of fatty acids that serve as precursors to phospholipids, cholesterol and other macromolecules critical to cell division.1,3 Accordingly, IDH1 overexpression contributes to the unabated proliferation exhibited by GBM cells.3 | ||
| Fig. 1 IDH1 catalyzes the conversion of isocitrate to αKG. | ||
Because of its role in the oncogenic underpinning of GBM, IDH1 has emerged as a promising therapeutic target for the cancer. Yet, current assays for IDH1 lack the characteristics that are important for performing high-throughput screens in the early phases of drug development. Western blot, for example, does not measure enzyme activity and has relatively low throughput.4 Further, because the αKG product lacks aromatic chromophores and is a small molecule that cannot be modified with a fluorophore, it cannot be detected by fluorescence-based assays. Therefore, methods that aim to measure the substrates and products of IDH1 as a function of its activity or expression level are restricted to mass spectrometry-based methods and commercially-available colorimetric assays.5,6 With a maximum throughput of approximately twenty samples per hour, liquid chromatography-mass spectrometry (LC-MS) is better suited for secondary characterization than primary high-throughput screening.7 Laser desorption ionization-mass spectrometry (LDI-MS) has been used to detect diagnostic biomarkers from biofluids with superior throughput relative to LC-MS and could be applied toward quantitating IDH1's substrates and products.8–10 However, the lack of inherent selectivity of the nanostructures used in this method necessitates extensive optimization of surface roughness and crevice space (often coupled with preliminary sample enrichment and purification steps) to achieve detection of a single molecule, preventing wide-scale implementation of LDI-MS in enzyme assays for drug discovery.11 Assays that use colorimetric reporters for NADP+/NADPH ratio and αKG have high throughput, but are less reliable in that they are prone to false positives.12 Additionally, as NADP+ and NADPH are ubiquitous within the cell, the NADP+/NADPH ratio assay requires subsequent enzymatic conversion of αKG for IDH1-specific probing beyond preliminary biochemical screens, and the assay available for αKG itself requires the generation of the metabolite pyruvate for detection.13,14 These strategies rely on indirect sensing of IDH1's substrates and products via separate cellular analytes whose significant endogenous levels need to be subtracted in cell-based assays, making them extremely susceptible to interference and error.
Here, we report the development and validation of an assay based on self-assembled monolayers for matrix-assisted laser desorption/ionization-mass spectrometry (SAMDI-MS) that can directly quantitate αKG in high-throughput as a measure of IDH1 activity or expression level. In SAMDI-MS, alkanethiols self-assemble on a gold-coated plate to form a monolayer of alkanethiolates.15 A fraction of the alkanethiolates are functionalized with a chemical handle that allows immobilization of a specific analyte, and the remaining alkanethiolates are terminated in an ethylene glycol group and are effective as an inert background that minimizes nonspecific adsorption of proteins to the monolayer.15,16 When the monolayer is analyzed by MALDI-TOF mass spectrometry, the alkanethiolates are dissociated from the gold surface and detected to give molecular masses of the substituted alkanethiolates.16 Hence, the substrate and product of a reaction give distinct m/z peaks that can be quantitated to determine conversion yields.16
SAMDI-MS has traditionally been used to study enzyme activity by immobilizing a peptide substrate to the surface and detecting mass shifts in the alkanethiolate-peptide conjugate that correspond to enzymatic transformations.17–19 We have recently begun exploring the application of SAMDI-MS toward the characterization of enzymes that participate in metabolic reactions by developing chemical strategies to selectively immobilize specific molecular substrates and products. For example, we reported a SAMDI-MS assay that uses a trans-thioesterification reaction between the acyl moiety of CoA metabolites and a peptide to immobilize the metabolites to the surface.20 In the present work, we use an alternate chemistry to covalently capture and quantitate αKG, the product of the reaction catalyzed by IDH1, as a measure of the enzyme's expression or activity. Specifically, we employ a hydrazide group to immobilize αKG via a hydrazone formation reaction.
Because the SAMDI-MS assay detects αKG directly by capturing it to the surface rather than relying on indirect measurements through by-products, it is not susceptible to interference from non-target compounds. Additionally, the assay is well-suited for high-throughput screening of IDH1 inhibitors and knockdown agents. The design of the monolayer eliminates the need for sample purification prior to application to the surface, the standard 384-array format of the gold-coated plates enables integration of automated liquid handling instrumentation into sample preparation procedures and the MALDI-TOF mass spectrometer collects each spectrum in a matter of seconds.15,21,22 Collectively, these features give SAMDI-MS a throughput on the order of tens of thousands of samples per day.22
Materials and methods
Reagents
All reagents were purchased from Sigma-Aldrich (St Louis, MO) unless otherwise specified.Preparation of maleimide-presenting monolayer
Stainless steel plates 8 cm × 12.3 cm were soaked in hexanes, water and ethanol and dried under pressurized nitrogen gas. A mask containing an array of 2.8 mm circles arranged in a standard 384-well format was placed over the plate. An electron beam (Thermionics Laboratory Inc., Hayward, CA) was used to deposit titanium (5 nm at 0.02 nm s−1) and then gold (30 nm at 0.05 nm s−1) onto the area of the plates that remained exposed. Plates were stored under vacuum until use. Plates were soaked in a solution of two alkyl-disulfides (0.6 mM symmetric 11-carbon alkyl-disulfide terminated with tri(ethylene glycol) groups and 0.4 mM asymmetric alkyl-disulfide terminated with a maleimide group and a triethylene group) (Chemtos, Austin, TX) in ethanol at 4 °C for 48 hours. This treatment is expected to produce monolayers with 20% of the alkanethiolates terminated with maleimide. After the soaking period, plates were removed from solution, rinsed with ethanol and dried under pressurized nitrogen gas. If cell lysates were to be later applied to the plates, they were then soaked in a solution of 10 mM hexadecylphosphonic acid in ethanol for 10 minutes at 23 °C, rinsed with ethanol and dried under pressurized nitrogen gas.Synthesis of 4-sulfanylbutanehydrazide disulfide
4′-Dithiodibutyric acid was esterified by dissolving 0.5 g of the solid in 100 mL of methanol. Several drops of sulfuric acid were added to acidify the solution, and the reaction was refluxed for 3 hours while the reaction progress was monitored by thin-layer chromatography (TLC). After the reaction had gone to completion, the solvent was removed by rotovap. The white solid was dried under vacuum and used without further purification. The methyl ester was dissolved in neat hydrazine monohydrate and refluxed for 5 hours, at which time TLC indicated complete conversion of the ester reactant. The remaining hydrazine was removed under vacuum to reveal a pearl-white 4-sulfanylbutanehydrazide product, which was dried for 24 hours under vacuum and then used without further purification.Preparation of hydrazide-presenting monolayer
A 100 μM solution of 4-sulfanylbutanehydrazide disulfide was prepared in 100 mM TRIS buffer (pH 8.0). 240 μL Tris(2-carboxyethyl)phosphine (TCEP) reducing resin (ThermoFisher Scientific, Waltham, MA) was exchanged into 100 mM TRIS buffer (pH 8.0) twice and then combined with the hydrazide solution. The mixture was shaken vigorously for 1 hour and spun down. The supernatant was applied to the plate at 3 μL per gold spot and the plate was incubated at 37 °C for 2 hours. The plate was then rinsed with water and ethanol and dried under pressurized nitrogen gas.Cell culture
LN382 cells were provided by the Stegh lab (Feinberg School of Medicine, Northwestern University). Cells were cultured to confluency in T-75 flasks in DMEM media without sodium pyruvate (ThermoFisher Scientific) supplemented with 10% fetal bovine serum (Atlanta Biologicals, Atlanta, GA) and 1% penicillin/streptomycin cocktail (Life Technologies, Carlsbad, CA). Cells were maintained in an CO2 incubator (5% CO2, 37 °C).RNA synthesis
siRNA oligonucleotides were synthesized in-house using TOM-RNA reagents (Glen Research, Sterling, VA) with a MerMade 6 synthesizer system (Bioautomation, Irving, TX) according to manufacturer-recommended cleavage and deprotection protocols. All oligonucleotides were purified using reverse-phase high performance liquid chromatography (RP-HPLC) on a Microsorb C18 column (Varian, Palo Alto, CA) with a gradient from 95![[thin space (1/6-em)]](https://www.rsc.org/images/entities/char_2009.gif) :5 volume ratio of 0.1 M triethylammonium acetate (TEAA):acetonitrile (CH3CN) to 100% CH3CN in 45 minutes and a flow rate of 3 mL per minute. The product fractions were concentrated by lyophilization. The lyophilized RNAs were then re-suspended in RNase-free water and their concentrations were measured using ultraviolet-visible spectroscopy. The purity of the oligonucleotides was assessed using MALDI-TOF mass spectrometry. The siRNA sequences used for this study are as follows: IDH1-targeting sense strand = GCU UGU GAG UGG AUG GGU A dTdT, IDH1-targeting antisense strand = UAC CCA UCC ACU CAC AAG C dTdT, control sense strand = CUU ACG CUG AGU ACU UCG A dTdT, control antisense strand = UCG AAG UAC UCA GCG UAA G dTdT (Dharmacon, Lafayette, CO).
:5 volume ratio of 0.1 M triethylammonium acetate (TEAA):acetonitrile (CH3CN) to 100% CH3CN in 45 minutes and a flow rate of 3 mL per minute. The product fractions were concentrated by lyophilization. The lyophilized RNAs were then re-suspended in RNase-free water and their concentrations were measured using ultraviolet-visible spectroscopy. The purity of the oligonucleotides was assessed using MALDI-TOF mass spectrometry. The siRNA sequences used for this study are as follows: IDH1-targeting sense strand = GCU UGU GAG UGG AUG GGU A dTdT, IDH1-targeting antisense strand = UAC CCA UCC ACU CAC AAG C dTdT, control sense strand = CUU ACG CUG AGU ACU UCG A dTdT, control antisense strand = UCG AAG UAC UCA GCG UAA G dTdT (Dharmacon, Lafayette, CO).
siRNA duplex preparation
The siRNA duplex was prepared by hybridizing the sense oligonucleotide and antisense oligonucleotide in a nuclease-free duplex buffer composed of 100 mM potassium acetate and 30 mM HEPES (pH 7.5). The solution was heated to 95 °C for 10 minutes and then cooled to 37 °C for 60 minutes while shaking at 600 rpm in a thermomixer. The siRNA duplex was then stored in 4 °C for same-day use or in −80 °C for future use.siRNA treatment
When LN382 cells reached confluency in a T-75 flask, cells were seeded to 6-well plate at a density of 300000 cells and a total media volume of 2 mL per well. After overnight incubation, the media was aspirated and cells were treated with siRNA duplexes using Lipofectamine RNAiMAX (Invitrogen, Carlsbad, CA) as a transfection agent. 33 pmol of lipofectamine and siRNA duplex were mixed with 500 μL of Opti-MEM (ThermoFisher Scientific) for 5 minutes. The siRNA and lipofectamine complex was then combined with 1.5 mL of cell culture media and added to the cells. The final concentration of siRNA added to the cells was 50 nM. After 6 hours of siRNA treatment, the media was replaced by 2 mL of cell culture media. The cells were then cultured for an additional 42 hours for total of 48 hours of incubation.
Preparation of cell lysates
After the 48-hour incubation period, the media was aspirated and the cells were rinsed with phosphate buffered saline (PBS) twice. 50 μL Pierce RIPA lysis buffer (ThermoFisher Scientific) supplemented with 1% Halt Protease Inhibitor Cocktail (100×) (ThermoFisher Scientific) was then added to each well. The contents of each well were then scraped and collected into a microcentrifuge tube. The tubes were placed on ice for 30 minutes, during which time they were vortexed periodically. The tubes were then centrifuged at 14000 rpm for 15 minutes at 4 °C. The supernatant was collected and stored at −80 °C until use.
Western blot
Total protein concentration of cell lysates was determined by a BCA assay (ThermoFisher Scientific). 30 μg of total protein from each treatment group was separated by 4–12% gradient SDS PAGE gel (Life Technologies) in Bolt ™ MOPS SDS running buffer (Life Technologies) for 60 minutes at 100 V. The gel was then transferred to nitrocellulose membrane using iBlot™ nitrocellulose transfer stack and iBlot™ 2 dry blotting system (Life Technologies) according to manufacturer's protocol. The membrane was then blocked using Odyssey® TBS blocking buffer (LI-COR, Lincoln, NE) at room temperature for 1 hour and incubated overnight with rabbit IgG anti-IDH1 (Cell Signaling Technology, Danvers, MA) at a 1:1000 dilution and mouse IgG1 anti-HSP70 (BD Biosciences, Franklin Lanes, NJ) at a 1:2000 dilution at 4 °C. After incubation, the membrane was rinsed three times for 5 minutes with 1× PBS with 0.1% Tween-20. The membrane was then incubated with IRDye® 800CW-conjugated goat anti-rabbit IgG secondary antibody (LI-COR) at a 1:2000 dilution and IRDye® 800CW-conjugated goat anti-mouse IgG1 secondary antibody (LI-COR) at a 1:2000 dilution for 1 hour. The membrane was rinsed again 3 times for 5 minutes with 1× PBS with 0.1% Tween-20. The blot image was scanned with Odyssey® CLx Imager (LI-COR). IDH1 expression level was quantified using Image J (NIH, Bethesda, MD) by first normalizing the IDH1 band intensity of each sample to the band intensity of the corresponding HSP70 loading control and then enumerating the normalized IDH1 band intensity of the transfection agent-treated, control siRNA-treated and IDH1-targeting siRNA-treated samples relative to that of the untreated sample (baseline IDH1 expression level was set at 1.00).
Preparation of αKG-containing samples
Standard αKG solutions were prepared from 12C αKG and 13C αKG (Cambridge Isotope Laboratories, Tewksbury, MA) in water. The final concentration of 13C αKG was 250 μM for the 10–90 μM standard series and 1 mM for the 100 μM–1 mM standard series. For enzymatic samples, 7 μL of 450 nM human recombinant IDH1 (Cayman Chemical, Ann Arbor, MI) in IDH1 assay buffer (25 mM Tris HCl, 150 mM NaCl, 5 mM MgCl2, pH 7.5) (final concentration of 350 nM) was combined with 1 μL of 45 mM (+)-potassium Ds-threo-isocitrate monobasic in water (final concentration of 5 mM) and 1 μL of 9 mM NADP+ disodium salt (Roche Diagnostics, Mannheim, Germany) in water (final concentration of 1 mM). The mixture was vortexed, centrifuged for 1 minute at 14000 rpm and incubated at 37 °C for 4 hours. 1 μL of 40% formic acid was added to each lysate, followed by 1 μL of 11 mM 13C αKG in water (final concentration of 1 mM). The mixture was vortexed and centrifuged at 14000 rpm for 1 minute. For preparation of cell lysates, 7 μL of lysate was combined with 1 μL of 45 mM (+)-potassium Ds-threo-isocitrate monobasic in water (final concentration of 5 mM) and 1 μL of 9 mM NADP+ disodium salt in water (final concentration of 1 mM). The mixture was vortexed, centrifuged for 1 minute at 14000 rpm and incubated at 37 °C for 2 hours. 1 μL 40% formic acid was added to each lysate, followed by 1 μL of 11 mM 13C αKG in water (final concentration of 1 mM). The mixture was vortexed and centrifuged at 14000 rpm for 1 minute. Samples were applied to the hydrazide-presenting surface and allowed to evaporate for 20 minutes at 23 °C. The plate was then rinsed with a 1% alconox solution, water and ethanol and treated with 15 mg mL−1 2′,4′,6′-trihydroxyacetophenone (THAP) matrix in acetonitrile.
SAMDI-mass spectrometry
Mass spectra were acquired with a 5800 MALDI-mass spectrometer (Applied Biosystems, Foster City, CA) in positive reflector mode. A 349 nm Nd:YAG laser was used as a desorption/ionization source. The accelerating voltage was 15 kV and the extraction delay time was 400–550 ns. A total of 900 laser shots at a rate of 400 Hz was applied across the area of each spot. The concentration of αKG in each sample was calculated using the sum of the area under the peaks corresponding to 12C αKG capture (m/z = 1091, 1135, 1157 and 1179) and 13C αKG capture (m/z = 1095, 1140, 1162 and 1184) using custom software.Statistical analysis
P values were determined by one-way analysis of variance (ANOVA). A p value below 0.05 was considered to be statistically significant.Results and discussion
Covalent capture of αKG to monolayer
To selectively capture the αKG product, we used a monolayer presenting a hydrazide group. This functional group undergoes condensation with the ketone of αKG and should be reasonably selective for αKG as ketones are uncommon among cellular metabolites.23,24 The resulting hydrazone covalently immobilizes the analyte to the monolayer.25 We prepared the monolayer from a mixture of disulfides presenting maleimide and tri(ethylene glycol) groups as described previously. A SAMDI-MS spectrum reveals a peak at m/z = 873 for the maleimide-functionalized alkanethiolates (Fig. 2, left). We then introduced the hydrazide group by treating the monolayer with 4-sulfanylbutanehydrazide, allowing the thiol to nucleophilically add to the maleimide (as evidenced in the mass spectrum at m/z = 1007) and the hydrazide group to remain available to participate in hydrazone formation with αKG (Fig. 2, center).26 We then applied an αKG solution to the hydrazide-presenting monolayer to capture αKG by hydrazone formation. In order to improve the typically slow kinetics of the hydrazone formation reaction, we left the surface exposed to air to allow water to evaporate.27 As water is a by-product of hydrazone formation, its removal helps to drive the hydrazide's reaction with αKG according to LeChatlier's principle.28 Because αKG is susceptible to fragmentation and adduct formation upon ionization, its capture yields multiple peaks at m/z = 1091, 1135, 1157 and 1179 (Fig. 2, right).29 | ||
| Fig. 2 Scheme for the capture and detection of αKG. The composition of the monolayer and representative SAMDI-MS spectra upon self-assembly of maleimide- and tri(ethylene glycol)-functionalized alkanethiolates (left), after reaction of the hydrazide-thiol with the maleimide groups (center), and after immobilization of αKG by the hydrazide groups (right). The peak at m/z = 873 corresponds to the maleimide-terminated alkanethiolate (sodium adduct), the peak at m/z = 1007 corresponds to the hydrazide-presenting alkanethiolate (sodium adduct), the peak at m/z = 993 corresponds to the hydrolysis product of the hydrazide-presenting alkanethiolate that results from its exposure to aqueous solution (sodium adduct) and the peaks at m/z = 1091, 1135, 1157 and 1179 correspond to the alkanethiolate-αKG capture product (see Fig. 3 for individual peak assignments). | ||
αKG quantitation and validation
We used 13C isotopically-labeled αKG as an internal standard to permit quantitation of αKG concentration. The use of an isotopomer ensures that the standard and the analyte immobilize with the same rate and that the analytes undergo ionization to the same extent in the mass spectrometry experiment; hence, a direct comparison of the peaks for each species provides a quantitative measure of the analyte concentration.30 We prepared an equimolar solution of 12C and 13C αKG, applied it to the hydrazide-presenting monolayer to immobilize the analytes and analyzed the surface with MALDI-TOF mass spectrometry. Again, the mass spectrum reveals multiple sets of peaks resulting from various cleavage products and ion adducts of the alkanethiolate-αKG complex, with peaks denoting 13C αKG capture either 4 or 5 mass units removed from peaks denoting 12C αKG capture depending on fragmentation (Fig. 3a). The sum of the area under the peaks (∑AUP) corresponding to 12C and 13C αKG capture and the known concentration of 13C αKG can be used to calculate an endogenous αKG concentration value by eqn (1):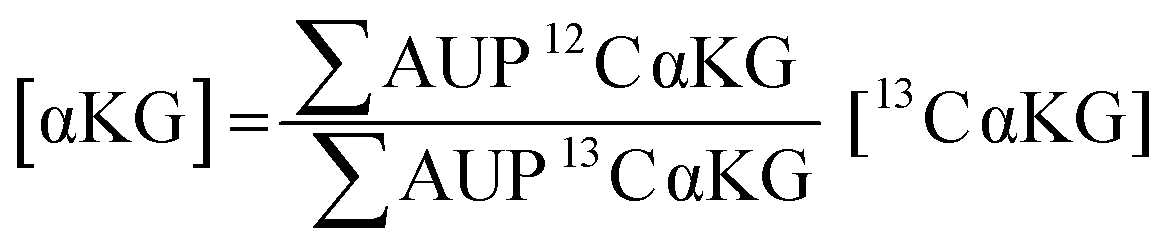 | (1) |
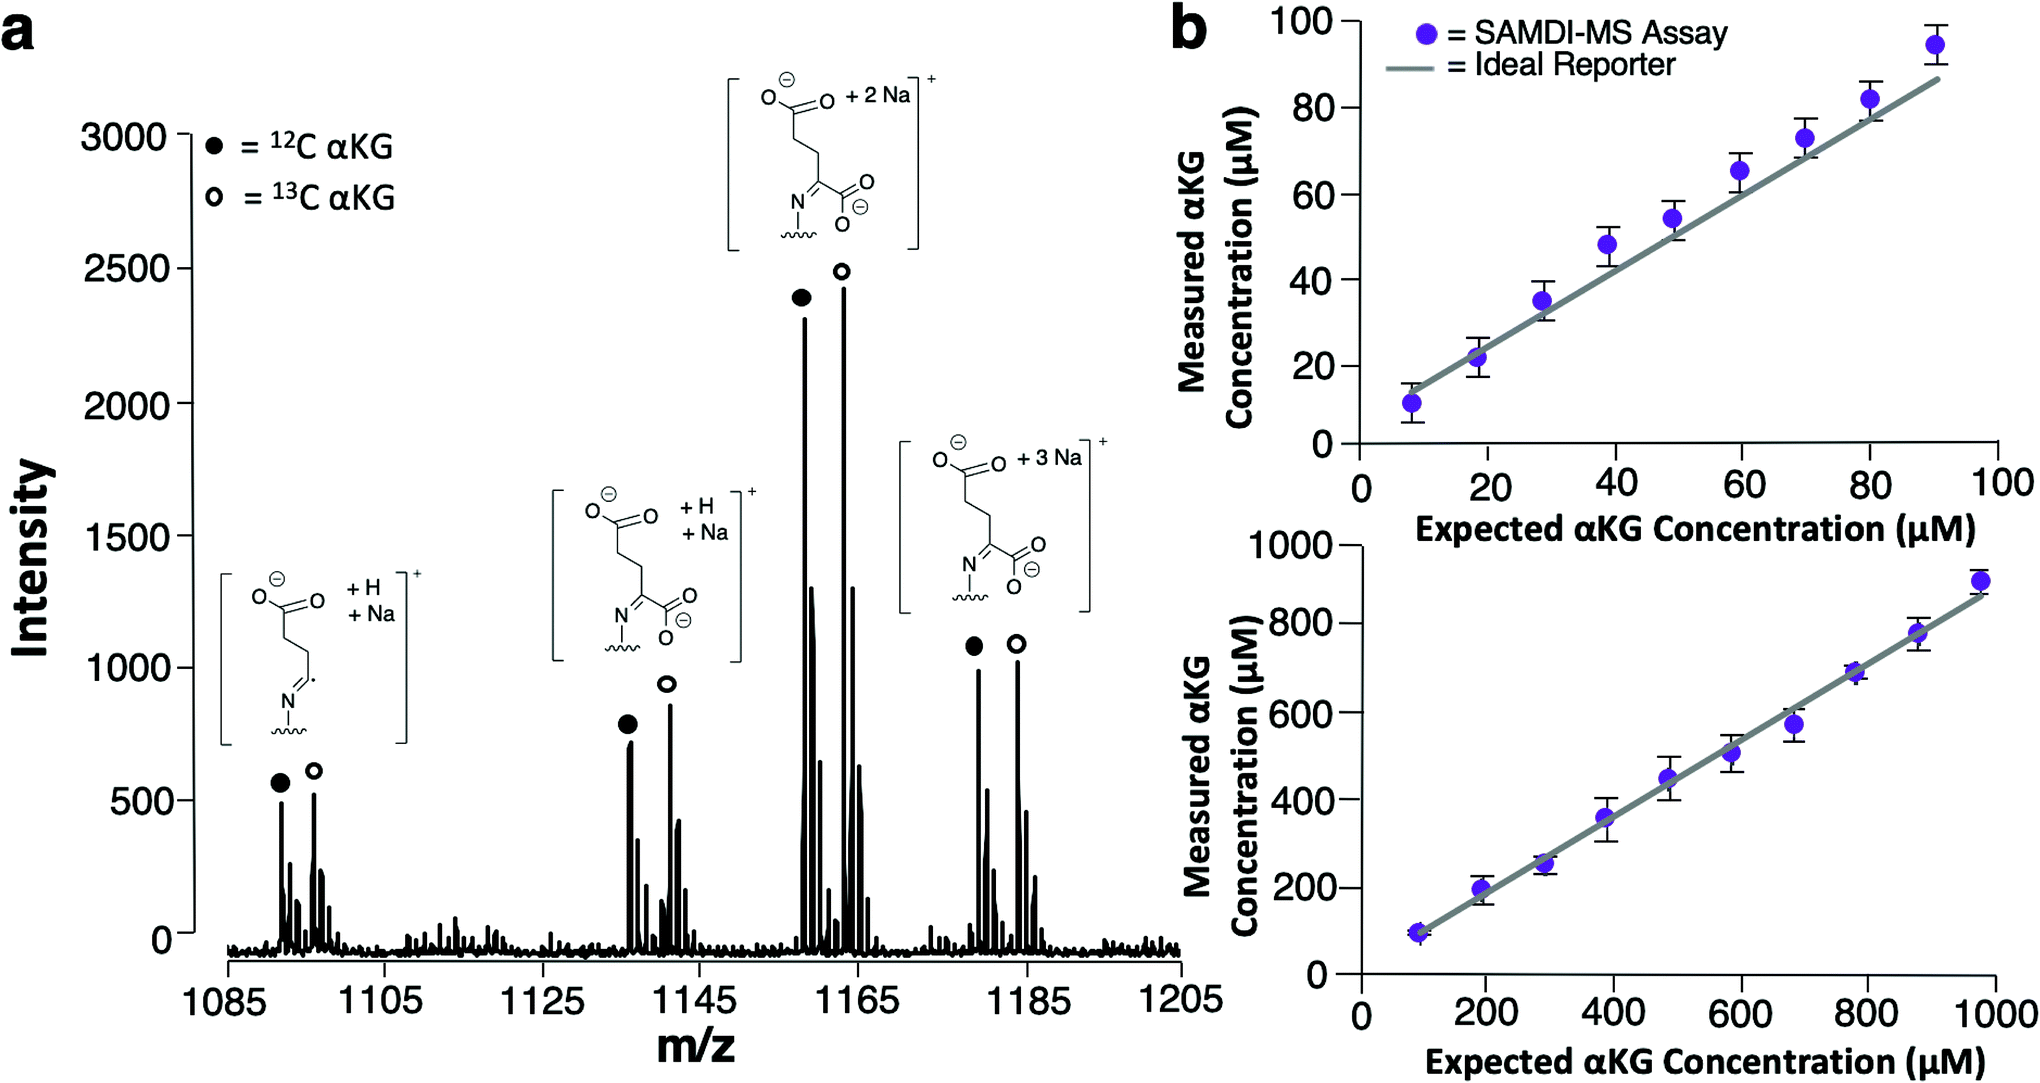 | ||
| Fig. 3 (a) Representative SAMDI-MS spectrum of a 1 mM 12C and 1 mM 13C αKG solution displaying the sodium adduct of the α-cleavage product at m/z = 1091 (12C) and m/z = 1095 (13C), the sodium adduct at m/z = 1135 (12C) and m/z = 1140 (13C), the double sodium adduct at m/z = 1157 (12C) and m/z = 1162 (13C) and the triple sodium adduct at m/z = 1179 (12C) and m/z = 1184 (13C). (b) Sensitivity plots comparing measured αKG concentration to known αKG concentration for solutions ranging from 10 to 90 μM (top) and from 100 μM to 1 mM (bottom). Data are expressed as mean ± standard deviation, with n = 8–10 technical replicates per solution. | ||
In order to evaluate the sensitivity of the SAMDI-MS assay and assess its ability to accurately quantitate αKG, we prepared two series of solutions having defined concentrations of αKG ranging from 10–90 μM and from 100 μM–1 mM and analyzed them using the SAMDI-MS assay as described above. The data are shown in Fig. 3b and reveal that αKG could be detected at concentrations as low as 10 μM. Plots of measured αKG concentration against known αKG concentration displayed strong positive correlations (R2 = 0.99) for both sets of solutions, revealing that the assay is quantitative in measuring αKG across a wide range of concentrations. In comparing the αKG concentration values calculated by the assay to the known αKG concentration value of each solution, the set ranging from 10–90 μM showed a 12% average relative error while the set ranging from 100 μM–1 mM showed a 3% average relative error. While both error margins indicate adequate accuracy, these results suggest that the assay is best suited for measuring αKG in the hundreds of micromolar range, which is typical of intracellular αKG concentrations.31
High-throughput biochemical screening
We next demonstrate that the assay has the characteristics required to be useful in high-throughput screening. We assembled reactions in the wells of a 384-well plate by combining recombinant IDH1 with isocitrate and NADP+ (its substrate and cofactor, respectively) and incubated the reactions at 37 °C for 4 hours. We then quenched enzymatic activity by adding formic acid (1 μL) and the 13C αKG internal standard (1 μL, 1 mM final concentration) to each well and then used a liquid handler to transfer the reaction mixtures to a metal plate featuring an array of 384 gold spots, with each spot presenting a monolayer for capture of αKG (Fig. 4a). The samples displayed a mean αKG concentration of 600 μM ± 130 μM standard deviation, yielding a 22% average percent standard deviation (Fig. 4b). The average percent standard deviation between αKG concentration values measured in 4 technical replicates of 6 randomly-selected samples was only 6.5%, revealing good reproducibility in the assay's measurements. Therefore, the majority of the distribution in αKG concentration measured across the samples can be attributed to sample preparation procedures (imprecision in the volume of enzyme, substrate, cofactor or internal standard added to each sample). | ||
| Fig. 4 (a) Scheme for the preparation and analysis of recombinant IDH1 samples. (b) αKG concentrations measured in the 384-sample biochemical screen (7 samples did not produce either 12C or 13C αKG capture). | ||
Because multiple well plates can be processed and incubated in parallel, the throughput of this assay as defined by the data collection period is two 384-plates, or approximately 770 samples, per hour. The ease of performing a 384-sample biochemical screen and the high proportion (98%) of samples that yielded quantifiable αKG demonstrate the assay's capacity for high-throughput analysis in a variety of contexts. The obviation of sample purification steps and the compatibility of the gold-coated plates with standard array-format liquid handling instrumentation allow SAMDI-MS to outpace methods whose processing times scale proportionately with the number of samples, and the fast readout of MALDI-TOF mass spectrometry maintains short analysis times even for large-scale experiments. The assay is therefore well-suited for application toward high-throughput screening of IDH1 inhibitors and knockdown agents.
Adaptation for cell lysate testing
In applying this assay format to measuring αKG in cell lysates, it is necessary to maximize selective immobilization of αKG among other ketone- and aldehyde-containing cellular metabolites that can undergo hydrazone formation.32 We emphasize, however, that because competing analytes each have their own distinct molecular weight and produce a unique peak in the mass spectrum upon capture to the surface, they will not contribute to false positive measurements of the analyte. We prepared lysates from LN382 cells, which are primary GBM cells that constitutively overexpress IDH1.3 We treated the lysates with formic acid to denature enzymes and terminate metabolism and we added 13C αKG (to a final concentration of 1 mM) to the lysates prior to application to the monolayer for capture of the analyte and standard. We did observe the expected peaks for capture of αKG; however, we also observed a peak that was consistent with significant immobilization of pyruvate, an abundant, ketone-containing metabolite (at m/z = 1099).Because of this competition, we incubated the lysates with isocitrate and NADP+ to produce higher levels of αKG prior to the immobilization reaction. We then again quenched the reaction with formic acid, added 13C αKG to the lysates and analyzed the samples using the SAMDI-MS assay (Fig. 5a). Untreated lysates yielded a mean αKG concentration of 156 μM ± 13 μM standard deviation, while the same lysates treated with isocitrate and NADP+ yielded a mean αKG concentration of 2015 μM ± 237 μM standard deviation with n = 3 biological replicates per condition. The dramatic increase in αKG concentration measured upon addition of isocitrate and NADP+ to the lysate reveals that this treatment step gave higher levels of product and could be used to assess IDH1 activity or expression in the original lysate. A substantial decrease in the amount of pyruvate immobilized to the surface accompanied the increase in αKG concentration measured in the isocitrate/NADP+-treated lysates compared to the untreated lysates (Fig. 5b). As a decrease in captured pyruvate was also observed in the spectra of lysates incubated with isocitrate and NADP+ separately, this phenomenon can be attributed to a shift in pyruvate metabolism in response to the addition of isocitrate and NADP+ (see Fig. S1† for spectra and further discussion).
 | ||
| Fig. 5 (a) Scheme for the preparation of cell lysate samples. (b) Representative SAMDI-MS spectra of untreated (left) and isocitrate/NADP+-treated (right) lysates displaying 12C αKG capture at m/z = 1091 (sodium adduct of α-cleavage product), 13C αKG capture at m/z = 1095 (sodium adduct of α-cleavage product) and pyruvate capture at m/z = 1099 (sodium adduct). | ||
While this treatment step yields a higher baseline αKG concentration in cell lysates, it also imparts another distinct advantage. This experiment demonstrates that the majority of the αKG that is captured from the lysate is produced upon addition of isocitrate and NADP+, a substrate/cofactor combination specific to IDH1 and IDH2.33 The αKG concentration values measured therefore largely represent an average response from these two enzymes. Accordingly, αKG concentration can be more directly attributed to IDH1 and to its potential inhibition or knockdown as opposed to other sources of αKG in the cell.34
Validation of intracellular αKG measurement
As a final experiment, we validated the ability of the SAMDI-MS assay to measure decreases in αKG in lysates derived from cells that were treated to knock down the enzyme expression. Several studies have demonstrated a decrease in intracellular αKG levels upon reduced expression of IDH1.3,35,36 We again used LN382 cells and treated them with either an IDH1-targeting small-interfering RNA (siRNA) sequence or a non-targeting control siRNA sequence in conjunction with a cationic lipid transfection agent. In another control group, we also treated cells with the transfection agent only to control for potential off-target effects. In order to confirm knockdown of IDH1 by the IDH1-targeting siRNA, we divided the sample volume into two fractions and performed a western blot for IDH1 expression level in parallel (see Fig. S2† for western blot gel images and Experimental section for details regarding quantitation of IDH1 expression level). Lysates were processed prior to analysis by SAMDI-MS in the manner previously described. The αKG concentration values obtained were divided by the total protein concentration of each sample to normalize for differences in cell count between lysates.We observed good agreement between the protein levels as determined with western blot and the intracellular αKG concentration as measured with the SAMDI-MS assay, as treatment with the IDH1-targeting siRNA produced a statistically significant (p < 0.05) decrease in both IDH1 expression level and normalized αKG concentration relative to untreated, transfection agent-treated and control siRNA-treated samples (Fig. 6). Comparison of the untreated group to the IDH1-targeting siRNA-treated group yielded a 70% mean decrease in IDH1 expression level and a 55% mean decrease in normalized αKG concentration. We note that the decrease in IDH1 expression level does not correlate linearly with changes in αKG concentration and believe this is because αKG is part of a dynamic metabolic network within the cell and because numerical expression levels are only approximations given the semi-quantitative nature of western blot.34,37 While we do not know the exact factor of decrease in αKG concentration expected in response to a certain degree of IDH1 knockdown, a previous study reported that a 75% decrease in IDH1 expression level corresponded to a 50% decrease in intracellular αKG concentration.36 The ratio of IDH1 knockdown-to-decrease in αKG concentration is closer to one-to-one in our experiment than in this previous report. We believe this observation is a result of the fact that the previous study measured total intracellular αKG without driving αKG production by IDH1 and therefore did not probe IDH1 as directly as the SAMDI-MS assay. The decrease in αKG concentration measured by the SAMDI-MS assay is consistent with the degree of IDH1 knockdown achieved, demonstrating that the assay can measure αKG concentration in a lysate as an indicator of IDH1 in the cell.
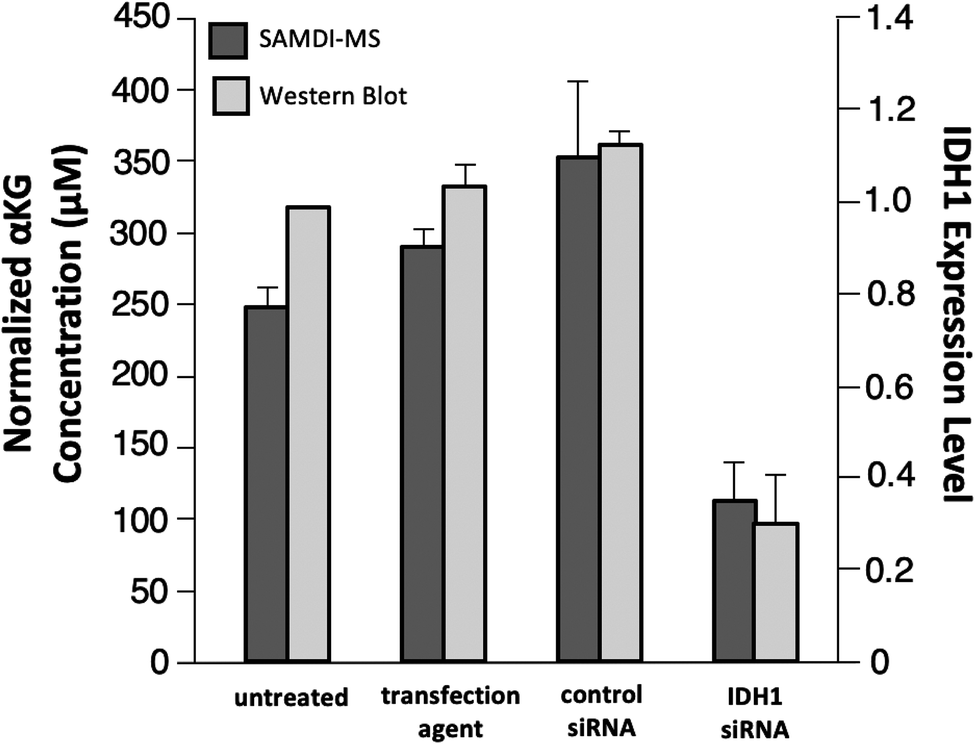 | ||
| Fig. 6 IDH1 expression level as determined with western blot and αKG concentration as measured with SAMDI-MS for untreated cells and cells treated with transfection agent, control sequence siRNA and IDH1-targeting siRNA. All data are expressed as mean ± standard deviation with n = 2 experimental replicates. | ||
Conclusions
We demonstrate a high-throughput, label-free assay based on SAMDI-MS that covalently captures αKG to a monolayer and then uses mass spectrometry to quantitate the product relative to an isotopic standard. This work significantly advances the SAMDI-MS platform for analysis of small molecule metabolites. While SAMDI-MS has been used to measure the activity of broad enzyme families—including phosphatases, kinases, proteases, deacetylases and others—the substrates for these enzymes are typically peptides, which can be easily immobilized to a maleimide-functionalized monolayer through the thiol of a terminal cysteine residue.16,22,38 Immobilizing small molecule analytes, however, has been challenging because they often lack specific functional groups for capture and the introduction of those groups can alter the activity of the molecule for the enzyme. Here, to measure αKG, we prepared a monolayer that presents a hydrazide functional group that can react with the product and we show that the condensation reaction has sufficient selectivity to capture the product from a cell lysate. By expanding the classes of enzymes SAMDI-MS can characterize to include those with non-peptide substrates, this work widens the potential applications of the platform in studies of cellular reaction pathways, directed evolution, synthetic biology and drug metabolism.An important aspect of the assay is its use of self-assembled monolayers (SAMs), which are structurally well-defined and straightforward to modify using synthetic chemistry. The SAMs are compatible with MALDI-TOF mass spectrometry because irradiation of the surface with the laser results in cleavage of the bond between the gold surface and the thiolate, producing clean spectra that can be quantitatively analyzed to determine reaction yields. The combined use of SAMs and mass spectrometry to quantitate the analyte also minimizes false positive results: for example, when the immobilization reaction is not specific, other immobilized molecules will give peaks at different m/z values and do not interfere with detection of the analyte of interest. Finally, the SAMs can be designed to present a broad range of functional groups, which will allow assays for many other metabolic activities.
In identifying functional groups that can be used to isolate a specific analyte from a complex mixture of molecules, we note that extensive work has developed highly-selective biorthogonal chemistries and provides many chemical reactions that can be harnessed in cell-based assays. Indeed, hydrazone and oxime formation have been previously used to modify ketone- and aldehyde-labeled proteins with chemical probes in a residue- or site-specific manner.39–42 Other biorthogonal immobilization chemistries, including Staudinger ligation and copper-free click reactions, may be explored in order to selectively capture new classes of molecules that contain different reactive functional groups.43–45 If the desired analyte does not have a reactive functional group, new traceless methods might be useful. For example, we developed an assay that captures molecules through non-selective bond insertion by a highly reactive carbene.46 This approach—which we refer to as traceless immobilization (TI-SAMDI-MS) – is likely too promiscuous for application with cell lysates, as the number of analytes captured cannot be so great as to produce so many peaks in the mass spectrum that the intensity of each is too low to be detected. However, this assay could be used to immobilize analytes from semi-pure solutions (such as enzymatic reactions) for which more selective covalent capture chemistries are not available. TI-SAMDI-MS has previously been used to measure the activity of cytochrome P450 on tolbutamide and can be applied toward further characterization of drug metabolism.46
By selectively capturing and quantifying αKG, the SAMDI-MS assay can measure the activity and expression level of IDH1 as recombinant enzyme and in a cell lysate and can therefore be used to screen IDH1 antagonist candidates. The lengthy development periods of treatments for different subclasses of GBM (including an inhibitor of IDH1's R132H mutant, which is implicated in secondary glioblastoma) has revealed how the limitations of traditional IDH1 assays manifest in a practical setting and demonstrates the need for direct and high-throughput assays, such as the one we describe here.47,48 The assay could replace the colorimetric αKG and NADP+/NADPH ratio assays as a more direct and reliable method of measuring wild-type IDH1 activity in a biochemical screen to identify hit compounds. The assay could also serve as a high-throughput alternative to LC-MS quantitation of intracellular αKG to evaluate the cellular uptake of each hit, thereby accelerating the discovery of a viable drug lead for primary GBM.
The SAMDI-MS platform is well-established as a powerful drug screening tool and has been used to discover enzyme inhibitors and immune-activating agents as therapeutics for several diseases by monitoring peptide-based modifications.49,50 The IDH1 assay presents yet another example of the important contribution of SAMDI-MS toward drug development. More broadly, by using selective chemistries to isolate analytes from complex mixtures, the assay permits the direct analysis of metabolites. We believe that the combination of monolayers with other chemistries will permit the analysis of a broad range of enzymatic activities.
Conflicts of interest
The authors declare the following competing financial interest(s): M. M. is Founder and Chairman of SAMDI Tech Inc., which uses SAMDI-MS to perform high-throughput screening and assay chemistry to clients in the pharmaceutical industry.Acknowledgements
Research reported in this publication was supported by the National Cancer Institute of the National Institutes of Health under award numbers U54CA199091, R01CA208783, and P50CA221747. The content is solely the responsibility of the authors and does not necessarily represent the officials views of the National Institutes of Health. J. P. was supported in part by the Chicago Cancer Baseball Charities at the Lurie Cancer Center of Northwestern University. The authors acknowledge the Stegh lab (Feinberg School of Medicine, Northwestern University) for providing LN382 cells.References
- R. J. Molenaar, T. Radivoyevitch, J. P. Maciejewski, C. J. F. van Noorden and F. E. Bleeker, Biochim. Biophys. Acta, 2014, 1846, 326–341 CAS.
- R. P. Hausinger, Crit. Rev. Biochem. Mol. Biol., 2004, 39, 21–68 CrossRef CAS PubMed.
- A. E. Calvert, A. Chalastanis, Y. Wu, L. A. Hurley, F. M. Kouri, Y. Bi, M. Kachman, J. L. May, E. Bartom, Y. Hua, R. K. Mishra, G. E. Schiltz, O. Dubrovskyi, A. P. Mazar, M. E. Peter, H. Zheng, C. D. James, C. F. Burant, N. S. Chandel, R. V. Davuluri, C. Horbinski and A. H. Stegh, Cell Rep., 2017, 19, 1858–1873 CrossRef CAS PubMed.
- J. J. Bass, D. J. Wilkinson, D. Rankin, B. E. Phillips, N. J. Szewczyk, K. Smith and P. J. Atherton, Scand. Med. J. Sci. Sports, 2017, 27, 4–25 CrossRef CAS PubMed.
- L. Dang, D. W. White, S. Gross, B. D. Bennett, M. A. Bittinger, E. M. Driggers, V. R. Fantin, H.-G. Jang, S. Jin, M. C. Keenan, K. M. Marks, R. M. Prins, P. S. Ward, K. E. Yen, L. M. Liau, J. D. Rabinowitz, L. C. Cantley, C. B. Thompson, M. G. Vander Heiden and S. M. Su, Nature, 2009, 462, 739–744 CrossRef CAS PubMed.
- G. Jin, Z. J. Reitman, C. G. Duncan, I. Spasojevic, D. M. Gooden, B. A. Rasheed, R. Yang, G. Y. Lopez, Y. He, R. E. McLendon, D. D. Bigner and H. Yan, Cancer Res., 2013, 73, 496–501 CrossRef CAS PubMed.
- S. K. Grebe and R. J. Singh, Clin. Biochem. Rev., 2011, 32, 5–31 Search PubMed.
- V. Vedarethinam, L. Huang, W. Xu, R. Zhang, D. D. Gurav, X. Sun, J. Yang, R. Chen and K. Qian, Small, 2019, 15, 1803051 CrossRef PubMed.
- L. Huang, D. D. Gurav, S. Wu, W. Xu, V. Vedarethinam, J. Yang, H. Su, X. Wan, Y. Fang, B. Shen, C.-A. H. Price, E. Velliou, J. Liu and K. Qian, Matter, 2019, 1, 1669–1680 CrossRef.
- X. Sun, L. Huang, R. Zhang, W. Xu, J. Huang, D. D. Gurav, V. Vedarethinam, R. Chen, J. Lou, Q. Wang, J. Wan and K. Qian, ACS Cent. Sci., 2018, 4, 223–229 CrossRef CAS PubMed.
- H.-W. Chu, B. Unnikrishnan, A. Anand, J.-Y. Mao and C.-C. Huang, J. Food Drug Anal., 2018, 26, 1215–1228 CrossRef CAS PubMed.
- A. Gilchrist and J. H. Nobbs, in Encyclopedia of Spectroscopy and Spectrometry, ed. J. C. Lindon, Elsevier, Amsterdam, 2000, pp. 337–343 Search PubMed.
- E. D. MacKenzie, M. A. Selak, D. A. Tennant, L. J. Payne, S. Crosby, C. M. Frederiksen, D. G. Watson and E. Gottlieb, Mol. Cell. Biol., 2007, 27, 3282–3289 CrossRef CAS PubMed.
- Alpha ketoglutarate (alpha KG) assay kit, https://www.abcam.com/alpha-ketoglutarate-alpha-kg-assay-kit-ab83431.html, (accessed 15 Nov 2019).
- K. L. Prime and G. M. Whitesides, Science, 1991, 252, 1164–1167 CrossRef CAS PubMed.
- Z. A. Gurard-Levin and M. Mrksich, Annu. Rev. Anal. Chem., 2008, 1, 767–800 CrossRef CAS PubMed.
- L. C. Szymczak and M. Mrksich, Biochemistry, 2019, 58, 1810–1817 CrossRef CAS PubMed.
- L. C. Szymczak, C. F. Huang, E. J. Berns and M. Mrksich, Methods Enzymol., 2018, 607, 389–403 Search PubMed.
- J. Kim and M. Mrksich, Nucleic Acids Res., 2010, 38, 1–10 CrossRef PubMed.
- P. T. O'Kane, Q. M. Dudley, A. K. McMillan, M. C. Jewett and M. Mrksich, Sci. Adv., 2019, 5, 1–10 Search PubMed.
- Z. A. Gurard-Levin, M. D. Scholle, A. H. Eisenberg and M. Mrksich, ACS Comb. Sci., 2011, 13, 347–350 CrossRef CAS PubMed.
- P. T. O'Kane and M. Mrksich, J. Am. Chem. Soc., 2017, 139, 10320–10327 CrossRef PubMed.
- J. A. Prescher and C. R. Bertozzi, Nat. Chem. Biol., 2005, 1, 13–21 CrossRef CAS PubMed.
- E. M. Sletten and C. R. Bertozzi, Angew. Chem., Int. Ed., 2009, 48, 6974–6998 CrossRef CAS PubMed.
- S. J. Mattingly, T. Xu, T. M. H. Nantz, R. M. Higashi and T. W.-M. Fan, Metabolomics, 2012, 8, 989–996 CrossRef CAS PubMed.
- B. T. Houseman, E. S. Gawalt and M. Mrksich, Langmuir, 2003, 19, 1522–1531 CrossRef CAS.
- A. Dirksen, S. Dirksen, T. M. Hackeng and P. E. Dawson, J. Am. Chem. Soc., 2006, 128, 15602–15603 CrossRef CAS PubMed.
- D. K. Kolmel and E. T. Kool, Chem. Rev., 2017, 117, 10358–10376 CrossRef CAS PubMed.
- R. Zenobi and R. Knochenmuss, Mass Spectrom. Rev., 1998, 17, 337–366 CrossRef CAS.
- A. Tan, N. Boudreau and A. Levesque, in LC-MS in Drug Bioanalysis, ed. Q. A. Xu and T. L. Madden, Springer, New York, 2012, pp. 1–32 Search PubMed.
- K. R. Albe, M. H. Butler and B. E. Wright, J. Theor. Biol., 1990, 143, 163–195 CrossRef CAS PubMed.
- G. R. Newkome and D. L. Fishel, J. Org. Chem., 1966, 31, 677–681 CrossRef CAS.
- H. Yang, D. Ye, K.-L. Guan and Y. Xiong, Clin. Cancer Res., 2012, 18, 5562–5571 CrossRef CAS PubMed.
- D. Xiao, L. Zeng, K. Yao, X. Kong, G. Wu and Y. Yin, Amino Acids, 2016, 48, 2067–2080 CrossRef CAS PubMed.
- W. Xu, H. Yang, Y. Liu, Y. Yang, P. Wang, S.-H. Kim, S. Ito, C. Yang, P. Wang, M.-T. Xiao, L.-X. Liu, W.-Q. Jiang, J. Liu, J.-Y. Zhang, B. Wang, S. Frye, Y. Zhang, Y.-H. Xu, Q.-Y. Lei, K.-L. Guan, S.-M. Zhao and Y. Xiong, Cancer Cell, 2011, 19, 17–30 CrossRef CAS PubMed.
- S. Zhao, Y. Lin, W. Xu, W. Jiang, Z. Zha, P. Wang, W. Yu, Z. Li, L. Gong, Y. Peng, J. Ding, Q. Lei, K.-L. Guan and Y. Xiong, Science, 2009, 324, 261–265 CrossRef CAS PubMed.
- R. Ghosh, J. E. Gilda and A. V. Gomes, Expert Rev. Proteomics, 2014, 11, 549–560 CrossRef CAS PubMed.
- E. Hakim Moully, E. J. Berns and M. Mrksich, Anal. Chem., 2019, 91, 13206–13212 CrossRef PubMed.
- P. Wu, W. Shui, B. L. Carlson, N. Hu, D. Rabuka, J. Lee and C. R. Bertozzi, Proc. Natl. Acad. Sci. U. S. A., 2009, 106, 3000–3005 CrossRef CAS PubMed.
- Z. Zhang, B. A. C. Smith, L. Wang, A. Brock, C. Cho and P. G. Schultz, Biochemistry, 2003, 42, 6735–6746 CrossRef CAS PubMed.
- A. J. Link, M. L. Mock and D. A. Tirrell, Curr. Opin. Biotechnol., 2003, 14, 603–609 CrossRef CAS PubMed.
- L. Wang and P. G. Schultz, Angew. Chem., Int. Ed., 2004, 44, 34–66 CrossRef PubMed.
- M. Kohn and R. Breinbauer, Angew. Chem., Int. Ed., 2004, 43, 3106–3116 CrossRef PubMed.
- J. C. Jewett and C. R. Bertozzi, Chem. Soc. Rev., 2010, 39, 1272–1279 RSC.
- Kenry and B. Liu, Trends Chem., 2019, 1, 763–778 CrossRef.
- K. Y. Helal, A. Alamgir, E. J. Berns and M. Mrksich, J. Am. Chem. Soc., 2018, 140, 8060–8063 CrossRef CAS PubMed.
- J. Popovici-Muller, R. M. Lemieux, E. Artin, J. O. Saunders, F. G. Salituro, J. Travins, G. Cianchetta, Z. Cai, D. Zhou, D. Cui, P. Chen, K. Straley, E. Tobin, F. Wang, M. D. David, V. Penard-Lacronique, C. Quivoron, V. Saada, S. de Botton, S. Gross, L. Dang, H. Yang, L. Utley, Y. Chen, H. Kim, S. Jin, Z. Gu, G. Yao, Z. Luo, X. Lv, C. Fang, L. Yan, A. Olaharski, L. Silverman, S. Biller, S.-S. M. Su and K. Yen, ACS Med. Chem. Lett., 2018, 9, 300–305 CrossRef CAS PubMed.
- J. Popovici-Muller, J. O. Saunders, F. G. Salituro, J. M. Travins, S. Yan, F. Zhao, S. Gross, L. Dang, K. E. Yen, H. Yang, K. S. Straley, S. Jin, K. Kunii, V. R. Fantin, S. Zhang, Q. Pan, D. Shi, S. A. Biller and S. M. Su, ACS Med. Chem. Lett., 2012, 3, 850–855 CrossRef CAS PubMed.
- K. Patel, J. Sherrill, M. Mrksich and M. D. Scholle, J. Biomol. Screening, 2015, 20, 842–848 CrossRef CAS PubMed.
- G. Yamankurt, E. J. Berns, A. Xue, A. Lee, N. Bagheri, M. Mrksich and C. A. Mirkin, Nat. Biomed. Eng., 2019, 3, 318–327 CrossRef CAS PubMed.
Footnote |
| † Electronic supplementary information (ESI) available: SAMDI-MS spectra of lysates treated with isocitrate and NADP+ separately and western blot gel images. See DOI: 10.1039/d0an00174k |
| This journal is © The Royal Society of Chemistry 2020 |