 Open Access Article
Proton spin relaxation study with pulsed NMR on the plasticization of Na+ ion-selective electrode membranes prepared from PVCs with different degrees of polymerization†
Takayo
Moriuchi-Kawakami
 *a,
Yuria
Sekiguchi
a,
Shintaro
Hattori
a,
Takahiro
Otsuki
a,
Keiichi
Fujimori
a,
Toshiyuki
Moriuchi
 b and
Yoshiaki
Urahama
c
aDepartment of Applied Chemistry, Faculty of Engineering, Osaka Institute of Technology, 5-16-1 Omiya, Asahi, Osaka 535-8585, Japan. E-mail: takayo.moriuchi@oit.ac.jp; Fax: +81 (6)69572135; Tel: +81 (6)6954 4279
bDivision of Molecular Materials Science, Graduate School of Science, Osaka City University, 3-3-138 Sugimoto, Sumiyoshi-ku, Osaka 558-8585, Japan
cGraduate School of Engineering, University of Hyogo, 2167 Shosha, Himeji, Hyogo 671-2201, Japan
First published on 22nd May 2020
Abstract
The proton spin–spin relaxation times (T2) of ion-selective electrode membranes with differences in the polymerization degree of the incorporated poly(vinyl chloride) (PVC) polymers were investigated. T2 measurements were performed using Hahn-Echo, Solid-Echo and Carr–Purcell-Meiboom-Gill (CPMG) pulse sequences. Analyses of the T2 measurements by Hahn-Echo pulse sequences could realize the estimation of the homogeneity and compatibility for a series of ion-selective electrode membranes and reveal a relationship with the electromotive force (EMF) response in the low-concentration region of the Na+ ions. On the other hand, the normalized derivative spectra from T2 measurements by Solid-Echo and CPMG pulse sequences could approximately visualize the degree of plasticization for such potentiometric polymeric membranes. Moreover, differences in the polymerization degrees of the incorporated PVCs were scarcely found to affect the selectivity coefficients of the Na+-ISEs based on bis(12-crown-4).
Introduction
The ion-selective electrode (ISE) method1–3 for the determination of ions in human body fluids is one of the most important tools in clinical analysis. Particularly, Na+-ISEs based on bis(12-crown-4) as an ionophore4–6 are well established measurement tools for human urine and blood analyses. Human body fluids are high in Na+ ion concentration which plays a role in many important physiological functions. However, an excess of Na+ ions can lead to the retention of water in the body, causing edema and high blood pressure. Therefore, determination of the Na+ ions in human body fluids is considered vital in medical screening, requiring the widespread and routine use of Na+-ISEs. Thus, the high discrimination ability of Na+ ions against K+ ions is strongly desired due to the relatively high K+ ion concentration in human body fluids.Na+-ISEs based on bis(12-crown-4) are solvent polymeric membrane electrodes and the plasticized potentiometric PVC membranes are generally prepared by the dissolving of an appropriate amount of bis(12-crown-4), 2-nitrophenyl octyl ether (o-NPOE) as the membrane plasticizer, PVC as the polymer, and sodium borate as a salt additive.4–6 The prepared potentiometric PVC membranes are homogeneous and flexible. In potentiometric polymeric membranes, bis(12-crown-4) as an ionophore mainly discriminates ions. Various bis(12-crown-3) derivatives were thus designed as an alternative ionophore to bis(12-crown-4), and the Na+-ISE based on bis(12-crown-3) showed a four-fold higher discrimination of the Na+ ions against K+ ions than that based on bis(12-crown-4).7 The ionophores of the Na+-ISEs are immobilized into the plasticized PVC membranes. Although the incorporated PVC polymers of Na+-ISEs may also influence their ion-sensing behavior, investigations into the ion-sensing behavior of the potentiometric membranes prepared from PVCs with different degrees of polymerization have yet to be carried out. Furthermore, a suitable and valid analysis method to evaluate the differences of such potentiometric polymeric membranes has yet to be developed.
In this study, five potentiometric PVC membranes of Na+-ISEs were prepared from PVCs with different degrees of polymerization and their ion-sensing behaviors were investigated by potentiometric measurements. Due to its extensive utilization to commercial Na+-ISEs for clinical examinations, bis(12-crown-4) was chosen as the model ionophore. We have developed an evaluating method for the plasticization of such potentiometric PVC membranes and elucidated its correlation with the ion-sensing properties. 1H nuclear magnetic resonance (NMR) relaxation measurements have been applied to studies on the morphology, structures and dynamics of polymers.8–11 Pulsed NMR experiments are very convenient to quickly determine the proton longitudinal (or spin–lattice) (T1) and transverse (of spin–spin) (T2) magnetization relaxation times.12 In particular, the proton transverse relaxation times T2 are the most suitable tools to demonstrate differences in the physical properties such as molecular mobility.13–16 We have previously demonstrated that the degree of plasticization in potentiometric polymeric membranes of Ag+-ISEs based on 5,10,15,20-tetraphenyl porphyrin with differences in the type and weight of the membrane plasticizer is quantitatively exhibited in the T2 values of the major fractions F.17,18 Here, the plasticization of the potentiometric PVC membranes of Na+-ISEs based on bis(12-crown-4) prepared from PVCs with different degrees of polymerization is investigated with T2 measurements by applying three pulse sequences (Hahn-Echo,19 Solid-Echo20 and CPMG12). To the best of our knowledge, this is the first report elucidating the correlation between the ion-sensing properties and the proton transverse relaxation times T2 data for a series of ion-selective electrode membranes prepared from PVCs with different degrees of polymerization.
Experimental
Reagents and materials
All reagents are of best quality commercially available (higher than special grade) and used as received unless otherwise specified. The PVCs used as polymers of the potentiometric polymeric membranes for the Na+-ISEs were the ZEST series-PVCs by Shin Dai-ichi Vinyl Corporation (Tokyo, Japan). Their degrees of polymerization (n) were 800, 1000, 1300, 1700 and 2500 (ZEST-800Z, ZEST-1000Z, ZEST-1300Z, ZEST-1700Z and ZEST-2500Z, respectively). They are actually applied to commercial Na+-ISEs membranes for plasma, serum and urine. The bis[(12-crown-4)methyl]-2-dodecyl-2-methylmalonate (bis(12-crown-4)) used as an ionophore, 2-nitrophenyl octyl ether (o-NPOE) as a membrane plasticizer and tetrakis[3,5-bis(trifluoromethyl)phenyl]borate sodium salt (NaTFPB) as an anion excluder were obtained from Dojindo Laboratories Co., Ltd. (Kumamoto, Japan). Tetrahydrofuran (THF) was dried over sodium and distilled.Preparation of potentiometric PVC membranes for the Na+-ISEs based on bis(12-crown-4)
All of the prepared potentiometric PVC membranes were composed of PVC (28.1 wt%) as a polymer, o-NPOE (68.9 wt%) as a membrane plasticizer, bis(12-crown-4) (2.5 wt%) as an ionophore, and NaTFPB (0.5 wt%) as an anion excluder.21 The components (282.17 mg) of a potentiometric PVC membrane were placed into a 5 mL glass tube and dissolved in ca. 3 mL THF. One sheet for each potentiometric polymeric membrane was obtained after evaporation of the THF for a few days. The PVCs used were ZEST-800Z (for membrane 1), ZEST-1000Z (for membrane 2), ZEST-1300Z (for membrane 3), ZEST-1700Z (for membrane 4) and ZEST-2500Z (for membrane 5). Five kinds of potentiometric polymeric membranes incorporating PVCs in different degrees of polymerization (membranes 1–5) were prepared and these were all viscoelastic sheets. Digital images of these five types of membranes are shown in Fig. S1.† One sheet for each membrane was arranged in a 10 mm diameter NMR tube (10 mmϕ) for pulse irradiation to its center. Digital image of the NMR samples are also provided in Fig. S1.†T 2 measurements with pulsed NMR
The proton transverse magnetization relaxation time T2 measurements were carried out with a JEOL JNM-MU-25 spectrometer operating at a frequency of 25 MHz. The free induction decay (FID) signals were recorded at a probe temperature of 25 °C by applying Hahn-Echo (90°−τ−180°), Solid-Echo (90°−τ−90°) and CPMG (90°−τ−{[180°−2τ−]M 180°−τ−measurement−τ}N) pulse sequences. By fitting the FID signals with the Hahn-Echo pulse sequence to the Weibull function,22 the T2 values and their fractions were computed. The average T2 value of the whole potentiometric polymeric membrane is calculated from the weighted sum of the T2 values (Table 1). Namely, the T2M × FM + T2L × FL value expresses the average T2 value of the whole potentiometric polymeric membrane. The FID signals with the Solid-Echo and CPMG pulse sequences for different relaxation time ranges were analyzed to obtain high-precision transverse magnetization M(t) data from the short-time region to the long-time region.18 High-precision transverse magnetization M(t) data were changed to one normalized derivative spectrum by derivative calculations with respect to the logarithmic time.23,24 The FID signals of each of the PVC polymers were also measured by Solid-Echo and CPMG pulse sequences, and the normalized derivative spectra were obtained (Fig. S2 and S3†).| Potentiometric PVC membrane | Degree of polymerization n | FID analysesa | Average T2 (ms) | |||
|---|---|---|---|---|---|---|
| T 2M (μs) | F M (%) | T 2L (ms) | F L (%) | |||
| a Estimated from FID signals obtained by the Hahn-Echo pulse sequence. | ||||||
| Membrane 1 | 800 | 742.88 | 26.2 | 7.25 | 73.8 | 5.55 |
| Membrane 2 | 1000 | 204.03 | 9.6 | 4.57 | 90.4 | 4.15 |
| Membrane 3 | 1300 | 170.54 | 6.5 | 5.07 | 93.5 | 4.75 |
| Membrane 4 | 1700 | 356.74 | 27.1 | 8.57 | 72.9 | 6.34 |
| Membrane 5 | 2500 | 317.18 | 32.4 | 26.77 | 67.6 | 18.2 |
EMF measurements
The potentiometric PVC membranes for the ISEs were formed on the tip of the ISE body assembly with an electrode kit (DKK Co., Ltd., Tokyo) by a casting method. The obtained Na+-ISEs were then conditioned overnight in an aqueous 0.01 M NaCl solution. An aqueous solution of 0.01 M NaCl was employed as the internal filling solution. All test solutions were made from chloride salts without any pH-adjusting buffer reagent. EMF measurements were performed on cells of type Ag–AgCl|3.3 M KCl||0.1 M CH3COOLi|sample solution||membrane||0.01 M NaCl|AgCl–Ag using a pH/mV meter equipped with a double junction type Ag–AgCl reference electrode. The activity coefficients were calculated according to the Davies equation.25 All EMF measurements of the examined Na+-ISEs were performed at 25 °C. The EMF measurements in this work were performed by the modified classical IUPAC protocol26 since this work is modelled on commercial Na+-ISEs based on bis(12-crown-4) which generally work for serum in higher ranges. EMF measurements for the calibration curves were carried out in increasing NaCl concentrations without additional background electrolytes.26 During EMF measurements for the selectivity coefficients, incremental amounts of NaCl were added to the solutions containing a constant concentration of the interfering ions as background electrolytes. The selectivity coefficients of the five Na+-ISEs, Kijpot, where i is the primary ion (Na+) and j is the interfering ion, were determined by the fixed interference method (FIM).1,2,26Results and discussion
T 2 measurements by applying the Hahn-Echo pulse sequence
The plasticization of a polymer by a membrane plasticizer varies as the weight ratio or the kind of membrane plasticizer employed and the polymerization degree or the kind of polymers are changed.27,28 Therefore, the T2 values of the proton transverse relaxation time of the potentiometric PVC membranes are dramatically affected by the degree of polymerization for the employed PVCs since constraints on the molecular motions in the potentiometric polymeric membrane are directly influenced by their plasticization degrees. To estimate quantitatively the plasticization degree of the potentiometric PVC membranes incorporating o-NPOE as the membrane plasticizer, here, five kinds of potentiometric polymeric membranes made from PVCs with different degrees of polymerization were prepared (membranes 1–5). The degrees of polymerization (n) of the PVCs for membranes 1–5 were 800, 1000, 1300, 1700 and 2500, respectively. Membranes 1–5 strongly resembled each other and no differences in their digital images were observed (Fig. S1†). T2 measurements were performed using a 25 MHz pulsed NMR spectrometer. The FID signals of membranes 1–5 for calculation of the T2 values were obtained by Hahn-Echo pulse sequences (Fig. 1). Generally, Hahn-Echo pulse sequences are suitable for T2 measurements of viscoelastic samples.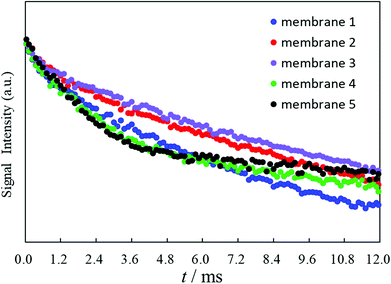 | ||
| Fig. 1 FID signals with the Hahn-Echo pulse sequence of the five potentiometric polymeric membranes 1–5. | ||
The T2 values and their respective fractions F, calculated by fitting the FID signal to the Weibull function,22 are summarized in Table 1. Each FID signal of the examined membranes was found to reflect two kinds of components having relaxation times T2L (long) and T2M (intermediate).29 The longer T2L and the shorter T2M are attributed to mobile species such as o-NPOE and sluggish species such as PVCs, respectively.
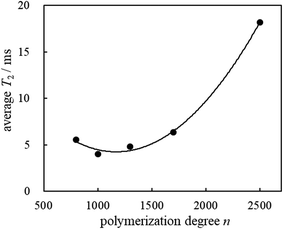
The PVCs used consist of an immobile component with an extremely short T2 value29 (T2S) (ca. 15 μs by applying the Solid-Echo pulse sequence), however, precise T2 measurements could not be carried out by the Hahn-Echo pulse sequence due to their significant time consumption. The prepared potentiometric polymeric membranes incorporated 28.1 wt% PVC. In membrane 5, the incorporated polymer had the highest PVC molecular weight PVC (n = 2500). Membrane 5 showed an incomparably long T2L value (26.77 ms) with the major fraction FL (67.6%) and a moderate T2M value (317.18 μs) with the fraction FM (32.4%). This means that membrane 5 consists of a highly mobile component of 67.7% and relatively immobile component of 32.4%. Since membrane 5 possessed the longest T2L value and comparable amounts of the major fraction FL, it also provided the largest average T2 value (18.2 ms). In our previous paper, the average T2 values exhibited the degree of plasticization for the potentiometric polymeric membranes.18 The degree of plasticization is potentially displayed as the position, area and breadth of the normalized derivative spectra peaks. In the case of similar membranes, the average T2 values will indicate the degree of plasticization for the whole membranes since they will adapt closely with changes in the position, area and breadth of the normalized derivative spectra peaks. In the case of membrane 5, its large average T2 value indicates a large degree of plasticization. Considering the fraction FL value in Table 1, however, it seems that o-NPOE as a membrane plasticizer could not very well permeate the polymer chains of the incorporated PVC, leading to a worsening of the compatibility of PVC with the o-NPOE in membrane 5. On the other hand, membranes 2 and 3 incorporating PVCs with polymerization degrees n = 1000 and 1300 consisted of almost all mobile components accompanied by the major fractions FL (90.4 and 93.5%) and providing the relatively longer T2L values (4.57 and 5.07 ms), respectively. These results indicate that o-NPOE as a membrane plasticizer could permeate the polymer chains of the incorporated PVCs well, leading to excellent homogeneity and compatibility.
Membranes 1 and 4 incorporating PVCs with polymerization degrees n = 800 and 1700 exhibited relatively longer T2L values (7.25 and 8.57 ms) with major FL fractions (73.8 and 72.9%), respectively. Membranes 1 and 4 also possess relatively immobile components, which showed relatively shorter T2M values (742.88 and 356.74 μs) accompanied by moderate fractions FM (26.2 and 27.1%), respectively. The average T2 value of membrane 4 (6.34 ms) was higher than that of membrane 1 (5.55 ms), while it is noteworthy that membrane 1 had the largest T2M value (742.88 μs) among the membranes 1–5. Therefore, it is presumed that the homogeneity and compatibility of membrane 1 are superior to those of membrane 4.
The plots for the polymerization degrees of the incorporated PVCs vs the average T2 values are given in Fig. 2. T2 measurements by applying the Hahn-Echo pulse sequences demonstrated that the membrane which exhibits the minimum average T2 value would be the most suitable membrane with excellent homogeneity and compatibility.
T 2 measurements by applying the Solid-Echo and CPMG pulse sequences
Generally, the Solid-Echo and CPMG pulse sequences are used to obtain the FID signals for the T2 values of the solid and liquid samples, respectively. We previously demonstrated that the normalized derivative spectra acquired from T2 measurements by the Solid-Echo and CPMG pulse sequences could visualize the degree of plasticization for the potentiometric PVC membranes with differences in the membrane plasticizer weight.18 In order to visualize the plasticization of the potentiometric polymeric membranes 1–5 with differences in the polymerization degree of the incorporated PVC polymers, here, the normalized derivative spectra in a time range of 2.5 μs to 20![[thin space (1/6-em)]](https://www.rsc.org/images/entities/char_2009.gif) 000
000![[thin space (1/6-em)]](https://www.rsc.org/images/entities/char_2009.gif) 000 μs acquired by applying the Solid-Echo (2.5–140 μs) and CPMG (140–2
000 μs acquired by applying the Solid-Echo (2.5–140 μs) and CPMG (140–2![[thin space (1/6-em)]](https://www.rsc.org/images/entities/char_2009.gif) 000
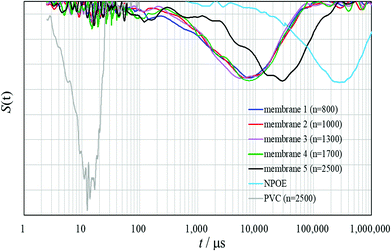
000![[thin space (1/6-em)]](https://www.rsc.org/images/entities/char_2009.gif) 000 μs) pulse sequences were obtained from high-precision transverse magnetization M(t) data (Fig. 3).18 Moreover, the normalized derivative spectra of the membrane plasticizer o-NPOE and PVC (n = 2500) are also illustrated in Fig. 3. The scale of the horizontal axis is logarithmic.
000 μs) pulse sequences were obtained from high-precision transverse magnetization M(t) data (Fig. 3).18 Moreover, the normalized derivative spectra of the membrane plasticizer o-NPOE and PVC (n = 2500) are also illustrated in Fig. 3. The scale of the horizontal axis is logarithmic.
Since the relaxation peaks of all the PVCs (n = 800, 1000, 1300, 1700 and 2500) appeared only in short-time regions up to 30 μs, the normalized derivative spectra of the PVCs themselves were very similar (Fig. S3†). Therefore, no difference in the degree of plasticization for the PVCs was observed in the normalized derivative spectra of the PVCs themselves. On the other hand, a remarkable difference between the potentiometric polymeric membranes 1–5, PVCs and o-NPOE was clearly observed in the normalized derivative spectra (Fig. 3). These results establish that the membrane plasticizer o-NPOE permeates the PVC polymer chains and the constraints on the molecular motions of PVC are dramatically reduced, while constraint on the molecular motions of o-NPOE are, in contrast, markedly increased.
In the normalized derivative spectra of membranes 1–5, the relaxation peaks of PVC originally in the short-time region were significantly diminished but most shifted to the wider field of the long-time regions by plasticization. The T2 relaxations of membranes 1–5 were found in a wide field of the long-time regions of 200 μs to 250![[thin space (1/6-em)]](https://www.rsc.org/images/entities/char_2009.gif) 000 μs. The bottoms of large relaxation peaks for the investigated potentiometric polymeric membranes (excluding membrane 5) appeared at around 10
000 μs. The bottoms of large relaxation peaks for the investigated potentiometric polymeric membranes (excluding membrane 5) appeared at around 10![[thin space (1/6-em)]](https://www.rsc.org/images/entities/char_2009.gif) 000 μs. Although the differences between membranes 1–4 could be visualized (Fig. 3 and S4†), they were in large part in accordance with results by the Hahn-Echo pulse sequence, as illustrated in Fig. 2. Membrane 5 exhibited a relaxation peak in the relatively longer time region than membranes 1–4 due to its largest average T2 value and this was in good accordance with results by the Hahn-Echo pulse sequences. Thus, T2 measurements by applying the Solid-Echo and CPMG pulse sequences proved that the normalized derivative spectra could approximately visualize the degree of plasticization for the potentiometric polymeric membranes with differences in the polymerization degrees of the incorporated PVC polymers. Unlike the Hahn-Echo pulse sequence, however, the small differences between membranes 1–4 could not be characterized precisely in the normalized derivative spectra (Fig. 4S†). That is, it was not possible to elucidate detailed differences between the potentiometric polymeric membranes resulting from the polymerization degree of the incorporated polymers by T2 measurements with the Solid-Echo and CPMG pulse sequences.
000 μs. Although the differences between membranes 1–4 could be visualized (Fig. 3 and S4†), they were in large part in accordance with results by the Hahn-Echo pulse sequence, as illustrated in Fig. 2. Membrane 5 exhibited a relaxation peak in the relatively longer time region than membranes 1–4 due to its largest average T2 value and this was in good accordance with results by the Hahn-Echo pulse sequences. Thus, T2 measurements by applying the Solid-Echo and CPMG pulse sequences proved that the normalized derivative spectra could approximately visualize the degree of plasticization for the potentiometric polymeric membranes with differences in the polymerization degrees of the incorporated PVC polymers. Unlike the Hahn-Echo pulse sequence, however, the small differences between membranes 1–4 could not be characterized precisely in the normalized derivative spectra (Fig. 4S†). That is, it was not possible to elucidate detailed differences between the potentiometric polymeric membranes resulting from the polymerization degree of the incorporated polymers by T2 measurements with the Solid-Echo and CPMG pulse sequences.
Potentiometric responses
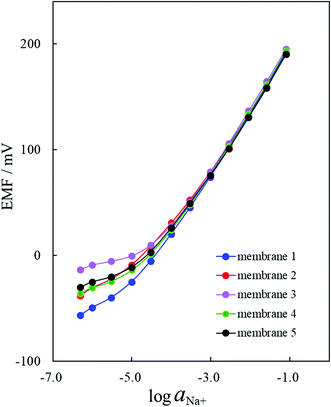
The potentiometric responses of the ion-sensing polymeric membranes were assumed to be influenced by the polymerization degree of the incorporated polymers since the T2 relaxations of the potentiometric polymeric membranes were somewhat dependent on the polymerization degree. Thus, the potentiometric responses of the Na+-ISEs of membranes 1–5 were investigated. EMF measurements of the Na+-ISEs based on bis(12-crown-4) as an ionophore were carried out in increasing NaCl concentrations. The activity coefficients were calculated according to the Davies equation.25 The examined Na+-ISEs based on bis(12-crown-4) as an ionophore displayed high sensitivity and fast potential response to the Na+ ion. Furthermore, all of the examined Na+-ISEs exhibited good Nernstian responses to Na+-activity changes, as shown in Fig. 4. The slopes and linear ranges of the calibration graph are summarized in Table 2.| Potentiometric PVC membrane contained in Na+-ISE | Degree of polymerization n | Calibration graphs | |
|---|---|---|---|
| Slope/mV per decade | Linear range/log![[thin space (1/6-em)]](https://www.rsc.org/images/entities/char_2009.gif) aNa+ aNa+ |
||
| Membrane 1 | 800 | 59.86 | −3.71 to −1.10 |
| Membrane 2 | 1000 | 59.15 | −3.13 to −1.10 |
| Membrane 3 | 1300 | 59.17 | −3.61 to −1.10 |
| Membrane 4 | 1700 | 59.51 | −3.61 to −1.10 |
| Membrane 5 | 2500 | 59.11 | −3.13 to −1.10 |
The Na+-ISE of membrane 3 responded to the Na+−activity changes with slopes of 59.17 mV decade−1 over an activity range of 10−3.6 to 10−1.1 M (Table 1). Fig. 4 clearly shows that the Na+-ISE of membrane 1 showed the best EMF response under 10−3.6 M of the Na+ ions. The Na+-ISE of membrane 3 provided the best Nernstian response from 10−3.6 M to 10−1.1 M and the worst EMF response under 10−3.6 M of the Na+ ions. As for the Na+-ISEs of membranes 1–5, the differences resulting from the polymerization degrees of the incorporated PVCs were observed for the potential responses in the low-concentration region under 10−3.6 M of the Na+ ions. These results, as shown in Fig. 4, agreed to some extent with the FID signals illustrated in Fig. 1: the FID signal intensity at 12.0 ms becomes lower and the EMF response under 10−3.6 M of the Na+ ions is enhanced. Generally, the transverse relaxation of the proton magnetization occurs, then the FID signal intensity decreases. When the FID signal intensity at 12.0 ms is lower, the proton transverse magnetization relaxation occurs more quickly. Therefore, it was demonstrated by applying the Hahn-Echo pulse sequence that the EMF response under 10−3.6 M of the Na+ ions was enhanced when the proton transverse magnetization relaxation at 12.0 ms in the T2 measurement proceeded more greatly.
The selectivity coefficients of the Na+-ISEs of membranes 1–5 were obtained from EMF measurements under the presence of various interfering cations. Fig. 5 illustrates the selectivity coefficients of five ISEs determined by the fixed interference method (FIM).1,2,26 All of the examined ISEs exhibited good ion-selectivity for the Na+ ion, and the differences resulting from the polymerization degrees of the incorporated PVCs were negligible, as observed by their selectivity coefficients for the Na+ ions. These results are similar to those obtained showing that differences in the polymerization degrees of the incorporated PVCs were scarcely found in the Nernstian responses of the examined Na+-ISEs. This is probably because the acquired selectivity coefficients are determined under the Nernstian responses for the Na+ ions.
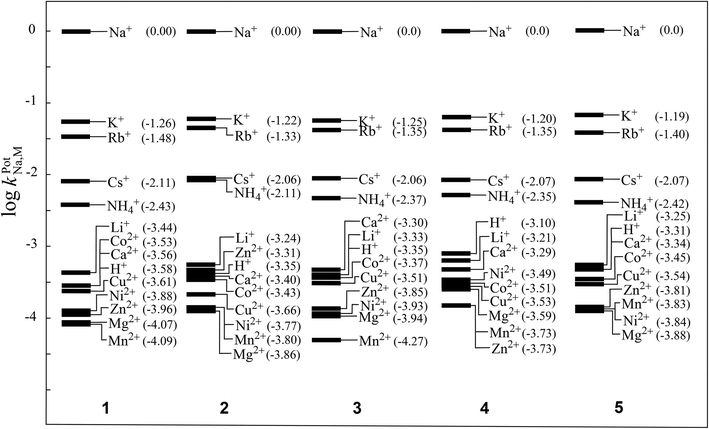 | ||
| Fig. 5 Selectivity coefficients of Na+-ISEs of membranes 1–5 determined by the fixed interference method (FIM). | ||
Conclusions
In summary, the proton spin–spin relaxation times (T2) of ion-selective electrode membranes with differences in the polymerization degrees of the incorporated PVC polymers were measured using a pulsed NMR spectrometer with Hahn-Echo, Solid-Echo and CPMG pulse sequences to acquire previously unknown information on the physical properties of ion-selective electrode membranes incorporating bis(12-crown-4) as an ionophore. T2 measurements by Hahn-Echo pulse sequence could realize the estimation of the homogeneity and compatibility of a series of ion-selective electrode membranes prepared from PVCs with different degrees of polymerization. The average T2 values calculated from T2 measurements by Hahn-Echo pulse sequence could quantify the degree of plasticization of such potentiometric polymeric membranes. Furthermore, the FID signal intensities of the T2 measurements revealed a relationship with the EMF response in the low-concentration region of the Na+ ions. Since validation checks before potentiometric measurements are a time-consuming process, data easily obtained from T2 measurements using the Hahn-Echo pulse sequence provides valuable information for the development of Na+-ISEs. On the other hand, the normalized derivative spectra from T2 measurements by applying Solid-Echo and CPMG pulse sequences could approximately visualize the degree of plasticization for the potentiometric polymeric membranes prepared from PVCs having different degrees of polymerization. In this study, it was also found that the differences in the polymerization degrees of the incorporated PVCs scarcely affected the selectivity coefficients of the Na+-ISEs based on bis(12-crown-4).Conflicts of interest
There are no conflicts to declare.Acknowledgements
This study was supported in part by a Grant-in-Aid for Scientific Research (C) (Grant No. 19K05533 to T. M-K.) from the Ministry of Education, Culture, Sports, Science and Technology of Japan.References
- E. Bakker and M. T. Diaz, Anal. Chem., 2002, 74, 2781–2800 CrossRef CAS PubMed.
- E. Bakker, P. Bühlmann and E. Pretsch, Chem. Rev., 1997, 97, 3083–3132 CrossRef CAS PubMed.
- E. Bakker and E. Pretsch, Angew. Chem., Int. Ed., 2007, 46, 5660–5668 CrossRef CAS PubMed.
- Y. Umezawa, P. Bühlmann, K. Umezawa, K. Tohda and S. Amemiya, Pure Appl. Chem., 2000, 72, 1851–2082 CAS.
- Y. Umezawa, CRC Handbook of Ion-Selective Electrodes: Selectivity Coefficients, ed. B. Raton and A. Arbor, CRC Press, Boston, 1990 Search PubMed.
- T. Shono, M. Okahara, I. Ikeda and K. Kimura, J. Electroanal. Chem., 1982, 132, 99–105 CrossRef CAS.
- T. Moriuchi-Kawakami, R. Aoki, K. Morita, H. Tsujioka, K. Fujimori and Y. Shibutani, Anal. Chim. Acta, 2003, 480, 291–298 CrossRef CAS.
- V. J. Mcbrierty and D. C. Douglass, Phys. Rep., 1980, 63, 61–147 CrossRef CAS.
- H. Kimoto, C. Tanaka, M. Yaginuma, E. Shinohara, A. Asano and T. Kurotsu, Anal. Sci., 2008, 24, 915–920 CrossRef CAS PubMed.
- T. Fukuda, S. Fujii, Y. Nakamura and M. Sasaki, J. Appl. Polym. Sci., 2013, 130, 322–329 CrossRef CAS.
- E. V. Silletta, M. I. Velasco, C. G. Gómez, R. H. Acosta, M. C. Strumia and G. A. Monti, Langmuir, 2014, 30, 4129–4136 CrossRef CAS PubMed.
- T. D. W. Claridge, High-Resolution NMR Techniques in Organic Chemistry: Third Edition, Elsevier Science Ltd., Oxford, 2016, ch. 2, pp. 11–59 Search PubMed.
- H. Tanaka and T. Nishi, J. Chem. Phys., 1985, 82, 4326–4331 CrossRef CAS.
- G. M. Bosmans, B. Lagrain, L. J. Deleu, E. Fierens, B. P. Hills and J. A. Delcour, J. Agric. Food Chem., 2012, 60, 5461–5470 CrossRef CAS PubMed.
- C. I. Harvat, X. Zhu, D. Türp, R. A. Vinokur, D. E. Demco, R. Fechete, O. Conradi, A. Graichen, D. Anokhin, D. A. Ivanov and M. Möller, Int. J. Hydrogen Energy, 2012, 37, 14454–14462 CrossRef.
- C. D'Agostino, T. Kotionova, J. Mitchell, P. J. Miedziak, D. W. Knight, S. H. Taylor, G. J. Hutchings, L. F. Gladden and M. D. Mantle, Chem. – Eur. J., 2013, 19, 11725–11732 CrossRef PubMed.
- T. Moriuchi-Kawakami, M. Kizuki, H. Takeuchi and Y. Shibutani, Analyst, 2011, 136, 897–900 RSC.
- T. Moriuchi-Kawakami, Y. Kanaya and Y. Urahama, Talanta, 2014, 127, 146–151 CrossRef CAS PubMed.
- E. L. Hahn, Phys. Rev., 1950, 80, 580–594 CrossRef.
- J. G. Powles and J. H. Strange, Proc. Phys. Soc., 1963, 82, 6–15 CrossRef CAS.
- S. Yajima, K. Tohda, P. Bühlmann and Y. Umezawa, Anal. Chem., 1997, 69, 1919–1924 CrossRef CAS.
- H. Serizawa, M. Ito, T. Kanamoto, K. Tanaka and A. Nomura, Polym. J., 1982, 14, 149–154 CrossRef CAS.
- Y. Nakamura, Y. Nishida, T. Fukuda, S. Fujii and M. Sasaki, Compos. Interfaces, 2012, 19, 353–364 CrossRef CAS.
- K. Yamamura, K. Shitajima, S. Fujii, Y. Nakamura, Y. Hamada, S. Hagiwara, H. Kishi, Y. Urahama and M. Sasaki, J. Adhes. Sci. Technol., 2013, 27, 2727–2740 CrossRef CAS.
- C. W. Davies, J. Chem. Soc., 1938, 2093–2098 RSC.
- E. Bakker, E. pretsch and P. Bühlmann, Anal. Chem., 2000, 72, 1127–1133 CrossRef CAS PubMed.
- L. G. Krauskopf, Plastics Additives Handbook, ed. H. Zweifel, R. D. Maier and M. Schiller, Hanser Publishers, Munich, 6th edn, 2009, ch. 3.13, pp. 485 Search PubMed.
- E. H. Immergut and H. F. Marky, Adv. Chem., 1965, 48, 1–26 Search PubMed , ch. 1.
- H. Kimoto, A. Fukuda, A. Asano and T. Kurotsu, Anal. Sci., 2005, 21, 315–319 CrossRef CAS PubMed.
Footnote |
| † Electronic supplementary information (ESI) available: Digital images, high-precision transverse magnetization data and expanded normalized derivative spectra. See DOI: 10.1039/c9an02355k |
| This journal is © The Royal Society of Chemistry 2020 |

