Spectroelectrochemical and computational studies of tetrahydrocannabinol (THC) and carboxy-tetrahydrocannabinol (THC-COOH)†
Shruti D.
Bindesri
,
Ricardo
Jebailey
,
Najwan
Albarghouthi
,
Cory C.
Pye
 and
Christa L.
Brosseau
 *
*
Department of Chemistry, Saint Mary's University, Halifax, Nova Scotia, Canada B3H 3C3. E-mail: christa.brosseau@smu.ca; Fax: +(902) 496-8104; Tel: +(902) 496-8175
First published on 10th January 2020
Abstract
Rapid and accurate detection of tetrahydrocannabinol (THC) and its main secondary metabolite carboxy-tetrahydrocannabinol (THC-COOH) is important to ensure safe roadways and workplaces, particularly in regions of the world where cannabis use is legal. In this work, we seek to demonstrate the usefulness of electrochemical SERS (EC-SERS) for the rapid detection of both THC and THC-COOH, complemented by thorough ab initio calculations for both molecules. These results indicate that application of a voltage is essential for efficient SERS detection of cannabinoids at low concentrations in bodily fluids, allowing for the eventual development of sensitive and quantitative screening tools. To the best of our knowledge, this work represents the first EC-SERS study of both THC and THC-COOH.
Introduction
Cannabis is by far one of the most common medically and recreationally consumed drugs, with an estimated 183 million users annually.1 Cannabis is sourced from the flowering plant cannabaceae, which includes several species, most notably Cannabis sativa and Cannabis indica. The cannabis plant contains more than 500 cannabinoids, of which only ∼100 have so far been identified.2 Exogenous cannabinoids, such as those produced by the cannabis plant, are terpenophenolic compounds that act on endogenous cannabinoid receptors in the central nervous system, affecting everything from appetite to sleep patterns to mood.2 The most well studied psychoactive cannabinoid is delta-9-tetrahydrocannabinol (Δ9-THC, or simply THC). In the human body THC is metabolized to form the secondary metabolite 11-nor-9-carboxy-tetrahydrocannabinol (THC-COOH), which is non-psychoactive. The presence of THC-COOH in urine is used as an indicator of cannabis use over time, while the presence of THC in saliva is an indicator of recent use. THC is used recreationally for its euphoric effects which are often accompanied by undesirable side-effects such as anxiety, dry-mouth and dizziness.3 Despite potential health risks, many countries have legalised the use of medical and recreational cannabis. In October 2018, the Government of Canada formalized the Cannabis Act for the legalisation of cannabis consumption and retail sale nationwide.4 With cannabis now legal for recreational use across Canada, and with the cannabis edibles market having recently opened in October 2019, it remains essential to develop effective analytical tools to monitor for cannabis impairment in situations where its use poses a threat to public safety.5Drug-impaired driving has been an offence in Canada since 1925 and remains a leading cause of death in this country. For decades, research has been carried out in an effort to understand the impact of cannabis consumption on motor vehicle operation. Several studies have shown that cannabis alters specific psychomotor and cognitive functions necessary for safe driving, including coordination, tracking and perception.6–9 More recently, PET brain imaging is being used to monitor the impacts of cannabis on brain metabolism, noting that effects of cannabis use may impact coordinated movement and driving.10 While cannabis-impaired drivers tend to have slower reaction times and impaired memory function compared to non-impaired drivers there is currently no specific guidance for cannabis consumers with respect to driving since the effects of cannabis can vary greatly among individuals, depending on the method of intake, the dosage and the variety of cannabis consumed.7–9 Maximum blood levels of THC can occur between one and six hours after intake and may last for up to 20 hours, and the content of THC in circulating blood varies with method of intake.11–13 Furthermore, THC is one of the most challenging drugs to monitor because of unpredictable behaviour and degradation into several metabolites, coupled with a high fat solubility and sustained re-release into the bloodstream over time.12,13
Following the legalization of cannabis in several countries, there has been an expansion of cannabis-related research aimed at developing an ideal screening method for the monitoring of cannabis-impaired driving at the point-of-need (PON). Several studies have explored gas chromatography-mass spectroscopy techniques as a method for routine detection and quantification of cannabinoids.14–17 Andrenyak et al. reported the development of gas chromatography-tandem mass spectrometry (GC-MS/MS) for cannabinoid detection.14 In another work published by Cho et al. 11-nor-9-carboxy-tetrahydrocannabinol was detected in the hair of drug consumers by LC-MS/MS analysis.15 Quantitative cannabinoid detection can also be achieved using high performance liquid chromatography (HPLC).16–18 Such sophisticated methodologies require a significant level of expertise and are mostly restricted to a laboratory setting and are not amenable to in-field use. Currently, lateral flow immunoassay (LFIA) technology is one of the few analytical methods appropriate for roadside detection of THC in saliva. With growing concern for public safety following the legalisation of cannabis, the Government of Canada passed legislation that has implemented the use of oral fluid drug screening devices based on LFIA technology to test for the presence of tetrahydrocannabinol (THC) at clinically relevant concentrations in saliva. While these platforms have been rolled out with initial success, challenges remain, including relatively high false negative rates and an inability to provide robust quantitative data at the point-of-need.17,19 A recent study by Arkell et al. noted that for two common point-of-need test platforms which monitor for THC in oral fluid (Securetec DrugWipe® 5 s and the Dräger Drugtest® 5000), the false positive and negative rates ranged from 5–16%, with neither platform demonstrating the recommended >80% sensitivity, specificity and accuracy.20 There is therefore an increased demand for a cannabinoid screening method that would be simple, non-invasive, fast and which would provide quantitative metrics regarding the target drug and/or its metabolites.
In this work, the detection of THC and its main secondary metabolite THC-COOH using electrochemical surface-enhanced Raman spectroscopy (EC-SERS) is explored as a rapid and highly sensitive method for drug monitoring. SERS is particularly attractive for this application as it allows for the selective and sensitive detection of analytes based on the inelastic scattering (Raman scattering) of the sample, providing a unique molecular fingerprint which corresponds to vibrational transitions that are characteristic for the molecule(s) present.21–24 The widespread availability of small, field-portable Raman spectrometers and fast analysis time (seconds to minutes), coupled with the signal enhancing properties of SERS substrates means that in theory SERS analysis of cannabinoids in bodily fluids can be easily incorporated for road-side monitoring of cannabis-impairment. Several publications have explored SERS as a method for cannabinoid detection thus far, but in general there is poor agreement amongst these published works with regards to the SERS signals detected for the same or similar molecule.25–29 This lack of agreement is most likely due to the fact that the cannabinoids have a poor affinity for the metal surface, coupled with a relatively weak Raman cross section. Coupling SERS with electrochemistry allows for a more intense and discernable signal, which is particularly important for molecules such as cannabinoids which can be difficult to detect using regular SERS.19,21,22 This is due to a variety of advantages that EC-SERS has, including the ability to change the surface charge, thereby influencing adsorption via electrostatic considerations, as well as the ability to electrochemically “clean” the SERS sensor surface prior to analysis, thus providing more adsorption sites for target analytes. To our knowledge, this work represents the first application of EC-SERS as a method for the detection of THC and THC-COOH. In addition, this is the first report, to our knowledge, that provides a complete computational analysis of the Raman vibrational modes for both THC and THC-COOH.
Materials and methods
Reagents and materials
Sodium citrate (99%), citric acid (≥99%) and sodium fluoride (99%) were purchased from Sigma-Aldrich (St Louis, MO, USA). Sodium borohydride (NaBH4, 99%) was purchased from Fluka Analytical (Sleeze, Germany). Silver nitrate (≥99.9995%) was purchased from Alfa Aesar (Wardhill, MA, USA). Potassium chloride was purchased from Chimiques ACP Chemicals (Saint-Leonard, QC Canada). The target analyte delta-9-THC standard was purchased as a 1.00 mg mL−1 analytical standard in methanol from Restek Corporation (Bellefonte, PA, USA) and the metabolite delta (±)-11-nor-9-carboxy-delta-9-THC was purchased as a 1.00 mg mL−1 analytical standard in methanol from Cerilliant Corporation (Round Rock, TX, USA). Artificial saliva (1700-0304) was purchased from Pickering Laboratories (Mountain View, CA, USA). Synthetic urine was prepared in the laboratory using the procedure reported by Wilsenach et al.30 Screen-printed electrodes (SPEs) containing a rectangular carbon working electrode (4 × 5 mm) were purchased from Pine Research Instrumentation (Durham, NC, USA). All glassware was soaked in neat sulfuric acid overnight and rinsed thoroughly with Millipore water (≥18.2 MΩ cm) prior to use.Synthesis of silver nanoparticles (AgNP)
The detailed synthesis and characterization of AgNPs used in this work was highlighted in previous publications and is therefore only briefly discussed here.31–34 1.0 mL of 0.1 M silver nitrate solution, 3.4 mL of 0.17 M aqueous sodium citrate and 0.6 mL of 0.17 M citric acid were added into a foiled three-necked flat-bottom flask containing 95.0 mL of water. The mixture was stirred under reflux, 0.2 mL of freshly prepared 0.1 mM NaBH4 was then added and the mixture was boiled for 1 hour and 20 minutes. The AgNP colloid formed was allowed to cool for an hour. Two aliquots of 715 μL of the AgNP colloidal suspension were transferred to each of 14 Eppendorf tubes and centrifuged for 20 minutes at 8000 rpm. The resulting supernatant was discarded and the AgNPs from all the Eppendorf tubes were collected into one tube and centrifuged again at 8000 rpm for 20 minutes. Once the supernatant was carefully removed, a concentrated AgNP paste was obtained. The final volume of the AgNP paste made up to 50 μL with Millipore water.Preparation of EC-SERS screen printed electrodes (SPE)
To render the working electrode of the SPE SERS-active, 3 layers of 5 μL AgNP paste was drop-coated onto the SPE, allowing for complete drying between layers. Once deposition of the AgNP layers was complete, the SPE was soaked in 0.5 M KCl for 30 minutes to eliminate adsorbed citrate which is a spectral interference, and then rinsed with Millipore water. This KCl treatment of the AgNP electrode has been reported on previously, and in our experience is a necessary step for the detection of weakly adsorbing analytes.34 Citrate is a capping agent as well as a reducing agent in the AgNP synthesis, and remains strongly adsorbed onto the silver surface, unless displaced by chloride. For all studies reported herein, 5.0 μL of the 1 mg mL−1 methanolic standard solution containing the analyte of interest (THC or THC-COOH) was deposited onto the AgNP-modified SPE and allowed to briefly dry before carrying out subsequent EC-SERS measurements.Spectroscopic measurements
A DXR Smart Raman spectrometer equipped with a 780 nm laser (Thermo Fisher Scientific, Mississauga, ON, Canada) was used to perform the EC-SERS measurements. The spectrometer has a resolution of 3 cm−1 and is equipped with an air-cooled CCD detector. The Raman spectrometer is coupled to a portable USB Wavenow potentiostat/galvanostat from Pine Research Instrumentation (Durham, NC, USA) to perform spectroelectrochemical measurements. The supporting electrolyte used in this work (0.1 M NaF) was purged with argon (99.999% purity) prior to analysis. For the artificial saliva and synthetic urine studies, the saliva and urine were used as the supporting electrolyte directly, and were also purged with argon prior to use. An applied potential of 0.0 V to −1.0 V with an increment of 0.1 V was applied vs. Ag/AgCl. Data collected were analyzed with Origin 9.0 software (OriginLab Corporation, Northampton, MA, USA).Computational studies
Calculations were performed using Gaussian 16.35 The geometries were optimized using a stepping stone approach, in which the geometries at the levels HF/6-31G*, HF/6-31+G*, HF/6-311+G*, B3LYP/6-31G*, B3LYP/6-31+G*, B3LYP/6-311+G* (and for smaller model systems, MP2/6-31G*, MP2/6-31+G*, and MP2/6-311+G*) were sequentially optimized, with the geometry and molecular orbital used as an initial guess for the subsequent level. The MP2 calculations utilize the frozen core approximation. Default optimization specifications were normally used. After each level, a frequency calculation was performed at the same level and the resulting Hessian was used in the following optimization. Z-Matrix coordinates constrained to the appropriate symmetry were used to speed up the optimization. Since frequency calculations are done at each level, any problems with the Z-matrix coordinates would manifest themselves by giving imaginary frequencies of non-totally symmetric irreducible representation. The Hessian was evaluated at the first geometry (opt = CalcFC) for the first level in a series in order to aid geometry convergence. The presence of extraneous imaginary frequencies for aromatic systems of Cs symmetry at MP2/6-31+G* and MP2/6-311+G* is believed to be an artifact of the calculation method.36 Full details of the calculation methodology is presented in the ESI.† Fig. S1 in the ESI† provides the structures for the molecules examined in these calculations.Results and discussion
Computational study of THC and THC-COOH
Recently, several studies have reported the SERS signal for the main psychoactive component in cannabis, tetrahyrocannabinol (THC).25,26,28,29 To date, to the best of the authors knowledge, there have been no SERS reports of carboxy-tetrahydrocannabinol (THC-COOH). The reports which have focused on THC thus far have used both silver and gold SERS substrates, and while SERS signal was detected, it can be noted that the SERS signal varies greatly for this molecule between the various studies. In order to help guide our interpretation of the EC-SERS signals for both THC and THC-COOH, we performed a computational study to calculate the normal Raman vibrational modes for both THC and THC-COOH. The vibrational mode assignments resulting from the computational study are provided in Table S1.† The theoretical intensities for both THC and THC-COOH are plotted in Fig. 1, along with the corresponding structures. Both Table S1† and Fig. 1 highlight the degree of similarity in the Raman vibrational modes for these two molecules.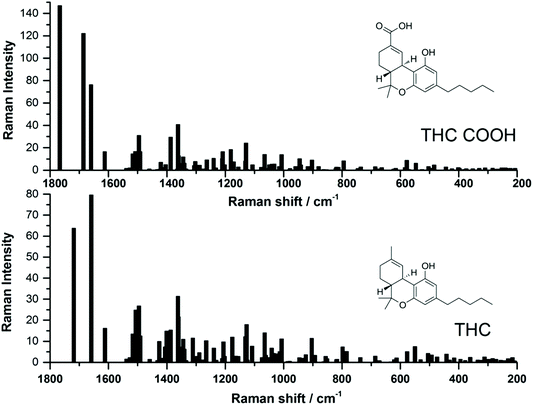 | ||
| Fig. 1 Comparison of theoretical Raman spectra calculated using B3LYP/6-31G* level of theory, for both 11-nor-9-carboxy-tetrahydrocannabinol (THC-COOH) and tetrahydrocannabinol (THC). | ||
EC-SERS measurements of THC
Electrochemical-SERS measurements were conducted for THC in 0.1 M NaF as supporting electrolyte. Previous work from our group and others have highlighted the usefulness of modified screen printed electrodes for conducting EC-SERS measurements in a rapid, user-friendly and cost effective manner.31–34,37 In this work, the screen printed electrodes were first modified with silver nanoparticles as described above, after which a chloride treatment strategy was applied, wherein the modified SPE was incubated in 0.5 M KCl for 30 minutes prior to the deposition of 5 μL of the 1.0 mg mL−1 THC or THC-COOH solution in methanol onto the electrode surface. This surface pre-treatment strategy allows the chloride ion, which has a strong specific adsorption on silver, to effectively displace all residual citrate ion that remains on the SERS-active surface. Citrate anion is used as the reducing and capping agent in the AgNP synthesis and can be an interference both in terms of allowing the analyte to access the surface and also as a spectral interference, as citrate has a relatively strong Raman signal. In general, this surface pre-treatment strategy allows one to obtain a much stronger SERS signal when doing EC-SERS on citrate-reduced silver nanoparticles.34 After the analyte solution was drop-coated onto the electrode surface and allowed to briefly dry, the electrode was placed into the electrochemical cell, into which the argon-purged supporting electrolyte was added. Subsequently, the EC-SERS signal was collected first at open circuit potential (OCP), and then the voltage was stepped from 0.0 V to −1.0 V vs. Ag/AgCl, in 100 mV increments. The SERS signal was collected at each applied voltage.
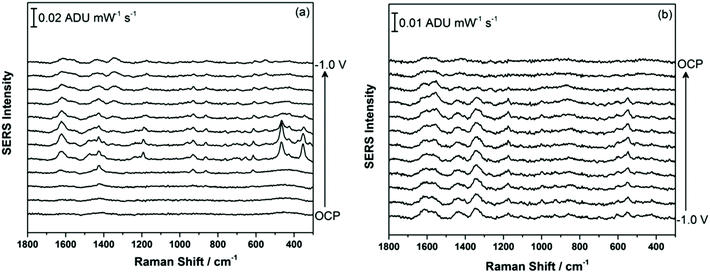
Fig. 2a shows the EC-SERS data collected for THC on the modified SPE surface as a function of voltage for the cathodic stepping sequence. At open circuit potential (OCP) (before application of a voltage), the SERS signal is very weak, in fact no signal for THC can be readily observed at this resting potential of silver. As the potential is stepped to −1.0 V however, the signal for THC increases, and is maximum at ∼−0.4 V vs. Ag/AgCl. As the potential reaches −1.0 V, the signal for THC decreases significantly. When the voltage is stepped back anodically (Fig. 2b), the THC signal is lost and does not return even when the voltage returns to −0.4 V. It can be noted that some broad spectral features of unknown origin appear at ∼−0.7 V, and remain on the surface of the electrode until the voltage returns to OCP. Fig. 3 compares the EC-SERS signal for THC recorded at −0.4 V (cathodic) (Fig. 3a) with the signal at OCP (Fig. 3b). Clearly the signal for THC is greatly enhanced by stepping the voltage to −0.4 V, and several peaks of interest can be noted. In particular, several vibrational modes are particularly prominent, including modes at 1622 cm−1 (ν(C–C![[double bond, length as m-dash]](https://www.rsc.org/images/entities/char_e001.gif) C)), 1426 cm−1 (δs(CH3)), 1192 cm−1 (δ(O–H), ring twist), 466 cm−1 (mixed, δ(Me–C)) and 352 cm−1 (OH twist). The prominence of these particular modes indicates that the THC molecule is likely coordinated to the metal surface through the OH group, with the planar tricyclic ring structure oriented perpendicular to the surface when the surface selection rules, which are active for SERS, are considered.
C)), 1426 cm−1 (δs(CH3)), 1192 cm−1 (δ(O–H), ring twist), 466 cm−1 (mixed, δ(Me–C)) and 352 cm−1 (OH twist). The prominence of these particular modes indicates that the THC molecule is likely coordinated to the metal surface through the OH group, with the planar tricyclic ring structure oriented perpendicular to the surface when the surface selection rules, which are active for SERS, are considered.
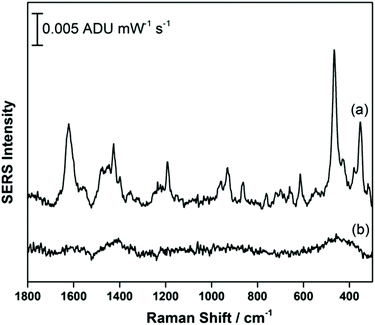 | ||
| Fig. 3 EC-SERS signal for THC on the AgNP-modified SPE at (a) −0.4 V and at (b) OCP. Spectra measured at 780 nm, 80 mW, 30 seconds. | ||
Fig. S2† compares the experimental EC-SERS signal obtained at −0.4 V to the theoretical Raman spectrum for THC calculated using ab initio methods. It is clear from Fig. S2† that the agreement between the two spectra is weak with respect to intensities, suggesting that the computational model does not describe the behaviour of the THC molecule at the electrified interface well. This is logical since the computational model assumes gas phase species and does not take into account symmetry changes that occur upon surface coordination with a metal. Despite this, however, the calculations are helpful in assigning vibrational modes in the experimental SERS spectra.
EC-SERS measurements of THC-COOH
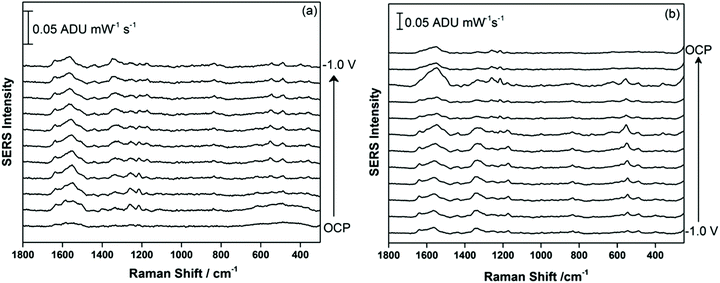
Fig. 4 shows the EC-SERS data collected for THC-COOH, the primary secondary metabolite of THC which is excreted into the urine. THC-COOH is a biomarker for use of cannabis over time, which can be of interest for certain occupations where drug use is not allowed, as well as in areas of the world where cannabis use is not yet legalized. 5.0 μL of the 1.0 mg mL−1 methanolic stock solution of THC-COOH was drop-coated onto the AgNP-modified SPE and allowed to briefly dry, before being transferred to the electrochemical cell containing 0.1 M NaF as the supporting electrolyte. Fig. 4a shows the cathodic progression from OCP, while Fig. 4b shows the anodic progression stepping back to OCP. The SERS signal is observed to be relatively weak initially, but gaining in intensity at ∼−0.3 V cathodic, with the most enhanced signal appearing at −0.4 V during the anodic progression. In this case, the adsorbed chloride is likely an interference, and once desorption of this anion is complete at ∼−0.5 V, the THC-COOH can then occupy the newly available surface sites on the metal surface. Compared to THC, the SERS signal for THC-COOH is more stable as the potential is stepped progressively more negative and then back positive, suggesting that once adsorbed onto the metal surface, the interaction is relatively strong in comparison.
Fig. 5 compares the signal recorded at −0.4 V (anodic) with the signal obtained at OCP, prior to application of a voltage. It is clear that a signal for THC-COOH is only obtainable when a voltage is applied, and this is largely driven by surface adsorption effects. Several vibrational modes can be observed, particularly at 1638 cm−1 (ν(C–C![[double bond, length as m-dash]](https://www.rsc.org/images/entities/char_e001.gif) C)), 1548 cm−1 (δas (chain CH3)), 1436 cm−1 (δs(CH3)), 1331 cm−1 (CH2 twist), 1176 cm−1 (δ(O–H), ring twist), 551 cm−1 and 491 cm−1 (both ring deformation modes) and 360 cm−1 (OH twist). As was observed previously with THC, a low frequency mode assigned to an OH deformation is observed, and in addition stronger contributions from the acyl chain moiety are present. It is possible that coordination to the metal through a combination of both the hydroxyl group and the carboxylic acid group result in a different molecular orientation at the electrified interface for THC-COOH compared to THC. Fig. S3† compares the EC-SERS signal collected at −0.4 V (anodic) with the theoretical Raman spectrum calculated using ab initio methods. Again, as was observed previously with THC, the calculated Raman intensities are not in good agreement with the SERS intensities, however the calculations can help with vibrational mode assignment.
C)), 1548 cm−1 (δas (chain CH3)), 1436 cm−1 (δs(CH3)), 1331 cm−1 (CH2 twist), 1176 cm−1 (δ(O–H), ring twist), 551 cm−1 and 491 cm−1 (both ring deformation modes) and 360 cm−1 (OH twist). As was observed previously with THC, a low frequency mode assigned to an OH deformation is observed, and in addition stronger contributions from the acyl chain moiety are present. It is possible that coordination to the metal through a combination of both the hydroxyl group and the carboxylic acid group result in a different molecular orientation at the electrified interface for THC-COOH compared to THC. Fig. S3† compares the EC-SERS signal collected at −0.4 V (anodic) with the theoretical Raman spectrum calculated using ab initio methods. Again, as was observed previously with THC, the calculated Raman intensities are not in good agreement with the SERS intensities, however the calculations can help with vibrational mode assignment.
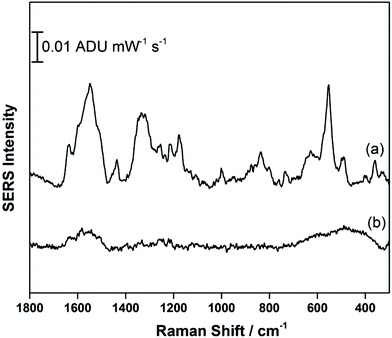 | ||
| Fig. 5 EC-SERS signal for THC-COOH on the AgNP-modified SPE at (a) −0.4 V (anodic) and at (b) OCP cathodic. Spectra measured at 780 nm, 80 mW, 30 seconds. | ||
In summary, both THC and THC-COOH were more readily detected using SERS when a voltage was applied to the SERS substrate. In the absence of applied voltage, the signal for both molecules was negligible. This suggests that the difficulty in detecting cannabinoids using regular SERS (non-EC-SERS) is due primarily to a weak surface adsorption by these molecules, which are unable to effectively compete with other more strongly adsorbing surface species, such as capping agents.
EC-SERS detection of THC and THC-COOH in relevant bodily fluid simulants
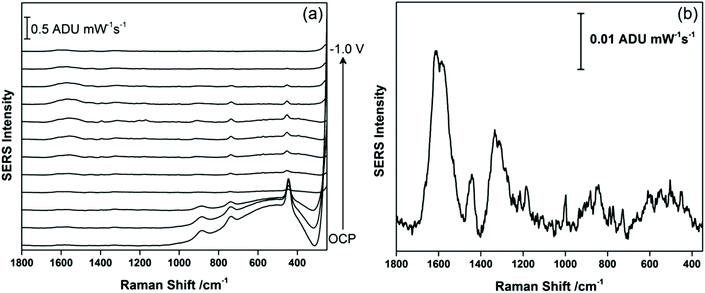
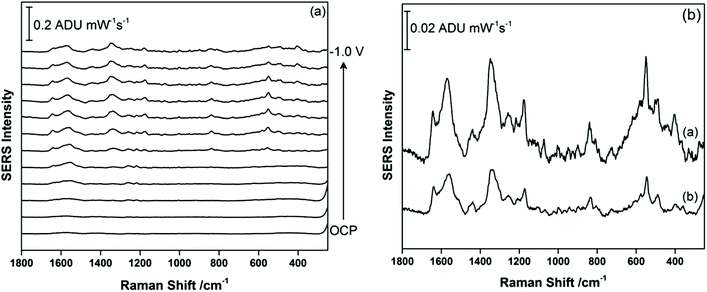
Once EC-SERS detection of THC and THC-COOH was deemed successful in 0.1 M NaF, this study then moved to more relevant matrices. THC is primarily detected in the saliva and in blood, while THC-COOH is primarily detected in the urine. For THC, since a primary motivation is to detect THC at the roadside, artificial saliva was used as the supporting matrix. The artificial saliva used contains a number of salts (potassium chloride, potassium phosphate, sodium chloride) as well as a small amount (<0.05%) of potassium thiocyanate, SCN−. Thiocyanate is naturally present in saliva from dietary sources (vegetables, nuts, milk and cheese) and also as a by-product of the detoxification of cyanide in the body, which originates primarily from primary and secondary exposure to tobacco smoke.38 For THC, 5 μL of a 1.0 mg mL−1 methanolic stock solution of this cannabinoid was again drop-coated onto the AgNP-modified SPE and allowed to briefly dry before being transferred to the electrochemical cell where the argon-purged artificial saliva was used as the supporting electrolyte directly. Fig. 6a shows the EC-SERS data for the cathodic progression for THC in the artificial saliva. At OCP, the primary peaks observed occur at 452 cm−1 (δ(NCS)) and 740 cm−1 (ν(C–S)) which are consistent with the adsorption of SCN− onto the silver surface.39 The broader peak at 908 cm−1 could not be identified. As the potential is stepped progressively negative, the peaks due to SCN− disappear completely, and when the signal at −1.0 V is plotted separately (Fig. 6b), one can discern a signal for THC with the most prominent peaks arising at 1600 cm−1, 1447 cm−1, and 1323 cm−1, which is consistent with the SERS vibrational modes observed by others.25–29 Of particular note is the lack of intense low frequency modes as was observed for THC in 0.1 M NaF, which suggests that the presence of SCN− in the saliva and its efficient adsorption onto the silver surface blocks the initial adsorption of THC, resulting in a weakened signal only observable at negative applied voltages. Once the SCN− has been electrochemically desorbed from the surface the THC can then adsorb, but now the surface charge is essentially neutral for the silver electrode (potential of zero charge (PZC) for Ag(poly) is ∼−0.95 V vs. Ag/AgCl), and THC adsorption no longer occurs through the hydroxyl group. This interference from SCN− is an important consideration for future SERS-based sensor platforms which seek to detect THC in saliva, especially given that regular cannabis use via smoking will lead to elevated levels of SCN− in the saliva for these individuals. In addition, this result highlights the usefulness of EC-SERS for point-of-need analysis of analytes which are weakly adsorbing.For THC-COOH, the relevant bodily fluid is urine. For this work, a synthetic urine recipe was used as outlined by Wilsenach et al.30 This synthetic urine recipe contains a variety of inorganic ions (Mg2+, Na+, K+, Cl−, PO43−, SO42−) as well as small molecules (urea, creatinine, citrate). In this case, THC-COOH was again drop-coated onto the AgNP-modified SPE and the EC-SERS spectra were recorded in the synthetic urine directly. Fig. 7a shows the cathodic progression of the signal for THC-COOH in synthetic urine. In this case, the signal at OCP is exceedingly weak, similar to what was observed in 0.1 M NaF. As the potential is stepped to more negative potentials, the signal for THC-COOH is gradually more visible. Fig. 7b compares the signal for THC-COOH in 0.1 M NaF and in synthetic urine, both at an applied voltage of −0.8 V vs. Ag/AgCl. Both signals in Fig. 7b are similar in appearance, indicating that in both instances adsorption of the THC-COOH is primarily thorough the hydroxyl and carboxylic acid groups. In this case, application of a voltage is again necessary for successful detection of THC-COOH in synthetic urine, and the main components in the synthetic urine are weakly adsorbing and do not pose as much of an issue for detection as was observed for THC in saliva. It is possible that the presence of the carboxylic acid group in THC-COOH leads to a stronger surface adsorption for this molecule compared to THC. This finding indicates that EC-SERS may be more useful for the detection of THC-COOH in urine, and therefore would find use as an assessment tool for cannabis use over time.
Conclusions
Both THC and THC-COOH are important analytical targets for the assessment of cannabis use, both with regards to drugged driving (THC) and drug use over time (THC-COOH). SERS offers many advantages in the field of point-of-need analysis for cannabis, however the weak surface affinity and inefficient Raman scattering of this class of molecules make routine SERS difficult. In this work, EC-SERS was highlighted as a new tool for cannabis analysis, and showed for the first time that cannabinoids can be detected using electrochemical SERS. Application of a voltage was shown to have a demonstrable effect on the SERS intensity, thereby paving the way for quantitative EC-SERS analysis of cannabinoids in biological fluids. For SERS detection of THC in saliva, the presence of SCN− in saliva was observed to be a significant spectral interference. Future work will explore the extent to which EC-SERS can provide a quantitative metric for cannabinoid detection, and will explore the various molecular interferences (nicotine, purine metabolites, etc.) which may limit the sensitivity of such a point-of-need analysis platform.Conflicts of interest
There are no conflicts to declare.Acknowledgements
C. L. Brosseau acknowledges funding support for this project from the Natural Sciences and Engineering Research Council and the Canada Research Chairs program. Infrastructure support was provided by the Canada Foundation for Innovation and the Nova Scotia Research and Innovation Trust. C. C. Pye thanks Compute Canada for computational support.References
-
United Nations Drug and Crime office, Vienna, World Drug Report 2010, United Nations publications, New York, 2010 Search PubMed
.
- S. Zivovinovic, R. Alder, M. D. Allenspach and C. Steuer, J. Anal. Sci. Technol., 2018, 9(27) DOI:10.1186/s40543-018-0159-8
.
- What you need to know about cannabis. https://www.canada.ca/en/services/health/campaigns/cannabis/canadians.html (accessed Mar 7, 2019).
- Government of Canada, Cannabis Act, S. C. 2018, c. 16 (http://laws-lois.justice.gc.ca).
- H. Dies, J. Raveendran, C. Escobedo and A. Docoslis, Sens. Actuators, B, 2018, 257, 382–388 CrossRef CAS
.
- H. Moskowitz, Anal. Prev., 1985, 17(4)), 323–345 CrossRef CAS
.
- O. J. Rafaelsen, P. Bech, J. Christiansen, H. Christrup, J. Nyboe and L. Rafaelsen, Science, 1973, 179, 920–923 CrossRef CAS PubMed
.
- R. L. Hartman, T. L. Brown, G. Milavetz, A. Spurgin, R. S. Pierce, D. A. Gorelick, G. Gaffney and M. A. Huestis, J. Appl. Toxicol., 2016, 36(11), 1418–1429 CrossRef CAS PubMed
.
- R. L. Hartman and M. A. Huestis, Clin. Chem., 2012, 59, 478–492 CrossRef PubMed
.
- A. Weinstein, O. Brickner, H. Lerman, M. Greemland, M. Bloch, H. Lester, R. Chisin, R. Mechoulam, R. Bar-Hamburger, N. Freedman and E. Even-Sapir, Psychopharmacology, 2008, 196, 119–131 CrossRef CAS PubMed
.
- F. Grotenhermen, Clin. Pharmacokinet., 2003, 42, 327–360 CrossRef CAS PubMed
.
- M. A. Huestis, Handb. Exp. Pharmacol., 2005, 168, 657–690 CAS
.
- S. Priyamvada, P. Murthy and M. M. S. Bharath, Iran. J. Psychiatry, 2012, 7(4), 149–156 Search PubMed
.
- D. M. Andrenyak, D. E. Moody, M. H. Slawson, D. S. Oleary and M. Haney, J. Anal. Toxicol., 2017, 41, 277–288 CAS
.
- H. S. Cho, B. Cho, J. Sim, S. K. Baeck, S. In and E. Kim, Forensic Sci. Int., 2019, 295, 219–225 CrossRef CAS PubMed
.
- I. Angeli, S. Casati, R. Alessandro, M. Mauro and M. Orioli, J. Pharm. Biomed. Anal., 2018, 155, 1–6 CrossRef CAS PubMed
.
- K. Purschke, S. Heinl, O. Lerch, F. Erdmann and F. Veit, Anal. Bioanal. Chem., 2016, 408, 4379–4388 CrossRef CAS PubMed
.
- S. Strano-Rossi, A. Bermejo, X. De la Torre and F. Botrè, Anal. Bioanal. Chem., 2011, 399, 1623–1630 CrossRef CAS PubMed
.
- A. L. Castro, S. Tarelho, P. Melo and J. M. Franco, Forensic Sci. Int., 2018, 289, 344–351 CrossRef CAS PubMed
.
- T. R. Arkell, R. C. Kevin, J. Stuart, N. Lintzeris, P. S. Haber, J. G. Ramaekers and I. S. McGregor, Drug Test. Anal., 2019, 1–12 Search PubMed
.
- L. Ambach, F. Penitschka, A. Broillet, S. König, W. Weinmann and W. Bernhard, Forensic Sci. Int., 2014, 243, 107–111 CrossRef CAS PubMed
.
- M. Goosensen, L. M. L. Stolk and B. J. Smit, J. Anal. Toxicol., 1995, 19, 330–330 CrossRef CAS PubMed
.
- D. J. Beirness and D. R. Smith, Can. Soc. Forensic Sci. J., 2017, 50(2), 55–63 CrossRef
.
- A. M. Robinson, L. Zhao, M. Y. Shah Alam, P. Bhandari, S. G. Harroun, D. Dendukuri, J. Blackburn and C. L. Brosseau, Analyst, 2015, 140, 779–785 RSC
.
- S. Yüksel, A. K. Schwenke, G. Soliveri, A. Ardizzone, K. Weber, D. Cialla-May, S. Hoeppener, U. S. Schubert and J. Popp, Anal. Chim. Acta, 2016, 939, 93–100 CrossRef PubMed
.
- K. Sivashanmugan, K. Squire, A. Tan, Y. Zhao, J. A. Kraai, G. L. Rorrer and A. X. Wang, ACS Sens., 2019, 4(4), 1109–1117 CrossRef CAS PubMed
.
- S. Milliken, J. Fraser, S. Poirier, J. Hulse and L.-L. Tay, Spectrochim. Acta, Part A, 2018, 196, 222–228 CrossRef CAS PubMed
.
- H. Dies, J. Raveendran, C. Escobedo and A. Docoslis, Sens. Actuators, B, 2018, 257, 383–388 CrossRef
.
- A.-M. Dowgiallo, Spectroscopy, 2017, 32(9), 58 Search PubMed
.
- J. A. Wilsenach, C. A. H. Schuurbiers and M. C. M. van Loosdrecht, Water Res., 2007, 41, 458–466 CrossRef CAS PubMed
.
- S. D. Bindesri, D. S. Alhatab and C. L. Brosseau, Analyst, 2018, 143, 4128–4135 RSC
.
- A. M. Robinson, S. G. Harroun, J. Bergman and C. L. Brosseau, Anal. Chem., 2012, 84(3), 1760–1764 CrossRef CAS PubMed
.
- L. Zhao, J. Blackburn and C. L. Brosseau, Anal. Chem., 2015, 87(1), 441–447 CrossRef CAS PubMed
.
- B. H. C. Greene, D. S. Alhatab, C. C. Pye and C. L. Brosseau, J. Phys. Chem. C, 2017, 121, 8084–8090 CrossRef
.
-
M. J. Frisch, G. W. Trucks, H. B. Schlegel, G. E. Scuseria, M. A. Robb, J. R. Cheeseman, G. Scalmani, V. Barone, G. A. Petersson, H. Nakatsuji, X. Li, M. Caricato, A. V. Marenich, J. Bloino, B. G. Janesko, R. Gomperts, B. Mennucci, H. P. Hratchian, J. V. Ortiz, A. F. Izmaylov, J. L. Sonnenberg, D. Williams-Young, F. Ding, F. Lipparini, F. Egidi, J. Goings, B. Peng, A. Petrone, T. Henderson, D. Ranasinghe, V. G. Zakrzewski, J. Gao, N. Rega, G. Zheng, W. Liang, M. Hada, M. Ehara, K. Toyota, R. Fukuda, J. Hasegawa, M. Ishida, T. Nakajima, Y. Honda, O. Kitao, H. Nakai, T. Vreven, K. Throssell, J. A. Montgomery Jr., J. E. Peralta, F. Ogliaro, M. J. Bearpark, J. J. Heyd, E. N. Brothers, K. N. Kudin, V. N. Staroverov, T. A. Keith, R. Kobayashi, J. Normand, K. Raghavachari, A. P. Rendell, J. C. Burant, S. S. Iyengar, J. Tomasi, M. Cossi, J. M. Millam, M. Klene, C. Adamo, R. Cammi, J. W. Ochterski, R. L. Martin, K. Morokuma, O. Farkas, J. B. Foresman and D. J. Fox, Gaussian 16, Revision A.03, Gaussian, Inc., Wallingford CT, 2016 Search PubMed
.
- D. Moran, A. C. Simmonett, F. E. Leach, P. v. R. Schleyer, H. F. Schaefer and W. D. Allen, J. Am. Chem. Soc., 2006, 128, 9342–9343 CrossRef CAS PubMed
.
- D. Martín-Yerga, A. Pérez-Junquera, M. B. González-García, J. V. Perales-Rondon, A. Heras, A. Colina, D. Hernández-Santos and P. Fanjul-Bolado, Electrochim. Acta, 2018, 264, 183–190 CrossRef
.
- L. Wiu, Z. Wang, S. Zong and Y. Cui, Biosens. Bioelectron., 2014, 62, 13–18 CrossRef PubMed
.
- P.-P. Fang, J.-F. Li, X.-D. Lin, J. R. Anema, D.-Y. Win, B. Ren and Z.-Q. Tian, J. Electroanal. Chem., 2012, 665, 70–75 CrossRef CAS
.
Footnote |
| † Electronic supplementary information (ESI) available. See DOI: 10.1039/c9an02173f |
| This journal is © The Royal Society of Chemistry 2020 |

