Sensitive photoelectrochemical immunoassay of Staphylococcus aureus based on one-pot electrodeposited ZnS/CdS heterojunction nanoparticles†
Hui
Yang
,
Xiao
Zhao
,
Hui
Wang
,
Wenfang
Deng
*,
Yueming
Tan
 *,
Ming
Ma
and
Qingji
Xie

Key Laboratory of Chemical Biology and Traditional Chinese Medicine Research (Ministry of Education of China), College of Chemistry and Chemical Engineering, Hunan Normal University, Changsha 410081, China. E-mail: dandy3-3@163.com; tanyueming0813@hunnu.edu.cn
First published on 14th November 2019
Abstract
We report here a facile synthesis of ZnS/CdS heterojunction nanoparticles on an indium–tin oxide (ITO) electrode and their application in the ultrasensitive photoelectrochemical detection of Staphylococcus aureus (S. aureus). The ZnS/CdS/ITO electrode was prepared using one-pot electrodeposition in an acidic solution containing ZnCl2, CdCl2 and Na2S2O3. The optimal ZnS/CdS heterojunction nanoparticles with a Zn/Cd atomic ratio of 1![[thin space (1/6-em)]](https://www.rsc.org/images/entities/char_2009.gif) :
:![[thin space (1/6-em)]](https://www.rsc.org/images/entities/char_2009.gif) 1 showed a high photoelectrochemical response to L-cysteine. L-Cysteine-encapsulated liposome (cysteine@liposome) immunonanocapsules were prepared and used as the labels for photoelectrochemical detection of S. aureus. By coupling cysteine@liposome immunonanocapsule labeling with immunomagnetic separation/enrichment and photoelectrochemical analysis using the ZnS/CdS/ITO electrode, sensitive photoelectrochemical detection of S. aureus was achieved. Under optimal conditions, the linear range for photoelectrochemical detection of S. aureus was from 1 to 4000 CFU mL−1. The proposed method was successfully used for photoelectrochemical detection of S. aureus in milk and juice samples.
1 showed a high photoelectrochemical response to L-cysteine. L-Cysteine-encapsulated liposome (cysteine@liposome) immunonanocapsules were prepared and used as the labels for photoelectrochemical detection of S. aureus. By coupling cysteine@liposome immunonanocapsule labeling with immunomagnetic separation/enrichment and photoelectrochemical analysis using the ZnS/CdS/ITO electrode, sensitive photoelectrochemical detection of S. aureus was achieved. Under optimal conditions, the linear range for photoelectrochemical detection of S. aureus was from 1 to 4000 CFU mL−1. The proposed method was successfully used for photoelectrochemical detection of S. aureus in milk and juice samples.
1. Introduction
Food safety has become a major concern for all countries in the world, and foodborne pathogens are one of the main factors affecting food safety. To provide technical guarantee for food safety and medical diagnosis, it is significant to develop a reliable detection technology of foodborne pathogens. Traditional culture-based methods are time-consuming.1 Various modern detection technologies, such as polymerase chain reaction, enzyme-linked immunosorbent assay, and biosensing technologies have been extensively used for the detection of foodborne pathogens,2–11 but they still have some limitations in terms of detection efficiency and sensitivity. Therefore, rapid and sensitive detection of foodborne pathogens remains extremely challenging.Photoelectrochemical analysis as a newly developed method based on photoelectric conversion has a low background signal and high sensitivity, due to the completely separated excitation signal (optical signal) and detection signal (electrical signal).12,13 In addition, the photoelectrochemical analysis has the advantages of simple equipment, easy miniaturization, and on-line detection. Owing to its advantages, photoelectrochemical analysis has broad application prospects in the field of chemistry, biology, medicine, environmental monitoring, and food safety.12,13 For instance, the photoelectrochemical method has been widely used to detect heavy metal ions, small biological molecules, DNA, micro-RNA, proteins, and cells.14–19 However, photoelectrochemical detection of foodborne pathogens has rarely been reported.20
Controllable synthesis of metal sulfides has always been a research hotspot. Many methods have been adopted for the synthesis of metal sulfides, such as hydrothermal/solvothermal synthesis, precipitation methods, thermal decomposition, sol–gel methods, ion exchange methods, gas phase deposition, and electrochemical deposition.21–26 Among these, the electrochemical deposition method has been favored by researchers because of its mild reaction conditions, simple equipment, easy operation and short preparation time.23,24 Up to now, many metal sulfides, such as CdS and ZnS, have been prepared using electrodeposition.27,28 It is reported that the heterojunctions formed by ZnS and CdS can show increased light absorption ability and improved electron–hole separation efficiency, resulting in enhanced performance for photoelectrochemical hydrogen generation.29 However, preparation of ZnS/CdS heterojunctions using one-pot electrodeposition and their application for photoelectrochemical analysis have not been reported to date.
Herein, ZnS/CdS heterojunction nanoparticles on an indium–tin oxide (ITO) electrode were prepared by one-pot electrodeposition using Na2S2O3 as the sulfur source. The as-prepared ZnS/CdS heterojunction nanoparticles showed superior photoelectric performance to CdS and ZnS nanoparticles. The optimal ZnS/CdS heterojunction nanoparticles with a Zn/Cd atomic ratio of 1![[thin space (1/6-em)]](https://www.rsc.org/images/entities/char_2009.gif) :
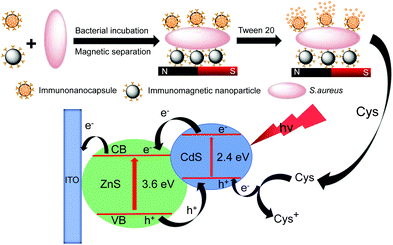
:![[thin space (1/6-em)]](https://www.rsc.org/images/entities/char_2009.gif) 1 showed a high photoelectrochemical response to L-cysteine. L-Cysteine-encapsulated liposome (cysteine@liposome) immunonanocapsules were prepared and used as the labels for photoelectrochemical detection of Staphylococcus aureus (S. aureus) in this work. As illustrated in Fig. 1, S. aureus cells were separated from the samples by immunomagnetic nanoparticles and labeled with cysteine@liposome immunonanocapsules. Then, the immunonanocapsules labeled to S. aureus cells were lysed with Tween 20, and the released L-cysteine was used for photoelectrochemical analysis using the ZnS/CdS/ITO electrode. Due to the great signal amplification of cysteine@liposome immunonanocapsule labeling and the high photoelectrochemical responses of the ZnS/CdS/ITO electrode to L-cysteine, sensitive photoelectrochemical detection of S. aureus was achieved.
1 showed a high photoelectrochemical response to L-cysteine. L-Cysteine-encapsulated liposome (cysteine@liposome) immunonanocapsules were prepared and used as the labels for photoelectrochemical detection of Staphylococcus aureus (S. aureus) in this work. As illustrated in Fig. 1, S. aureus cells were separated from the samples by immunomagnetic nanoparticles and labeled with cysteine@liposome immunonanocapsules. Then, the immunonanocapsules labeled to S. aureus cells were lysed with Tween 20, and the released L-cysteine was used for photoelectrochemical analysis using the ZnS/CdS/ITO electrode. Due to the great signal amplification of cysteine@liposome immunonanocapsule labeling and the high photoelectrochemical responses of the ZnS/CdS/ITO electrode to L-cysteine, sensitive photoelectrochemical detection of S. aureus was achieved.
2. Experimental
Instrumentation and reagents
Transmission electron microscopy (TEM) images were obtained with a Philips TECNAI F-30 transmission electron microscope. Scanning electron microscopy (SEM) images were obtained with a JSM-6360 field emission scanning electron microscope. Fourier transform infrared (FTIR) spectra were recorded on a Nicolet Nexus 670 Fourier transform infrared spectrometer. Ultraviolet-visible (UV-Vis) spectra were acquired with a UV-2450 UV-Vis spectrophotometer (Shimadzu, Japan). All electrochemical experiments were performed on a CHI760E electrochemical workstation. All photoelectrochemical experiments were carried out on an electrochemical workstation (ZENNIUM, ZAHNER-elecktrik GmbH & Co. KG, Germany) equipped with a controlled-intensity-modulated-photospectroscopy setup (CIMPS, PP211, ZAHNER-elecktrik GmbH & Co. KG, Germany). A white light lamp (WLC02, ZAHNER-elecktrik GmbH & Co. KG, Germany) with a visible-light filter (400–700 nm) was used as the light source.N-Hydroxysuccinimide, N-(3-(dimethylamino)propyl)-N′-ethylcarbodiimide hydrochloride, bovine serum albumin, dipalmitoyl phosphoethanolamine, and dipalmitoyl phosphocholine were purchased from Sigma Aldrich. Sodium thiosulfate pentahydrate (Na2S2O3·5H2O), zinc chloride (ZnCl2), L-cysteine, cholesterol, sodium sulfate and trichloromethane were purchased from Sinopharm Chemical Reagent Co. Ltd (Shanghai, China). Cadmium chloride (CdCl2·2.5H2O) was purchased from Komeo Chemical Reagent Factory (Tianjin, China). Amino-functionalized Fe3O4 nanoparticles were purchased from Aladdin. Staphylococcus aureus and Escherichia coli O157:H7, Escherichia coli K12, and Salmonella typhimurium were purchased from the American Strain Preservation Center (ATCC, USA). The rabbit anti-S. aureus antibodies were purchased from Beijing Biosynth. Biotechnol. Co. Ltd (Beijing, China). All other reagents were of analytical grade and were used without further purification. The washing and blocking buffer solution for immunoassay was 0.01 M phosphate buffer solution (pH 7.4, 10 mM NaH2PO4-Na2HPO4 + 0.15 M NaCl). Milli-Q ultrapure water (Millipore, ≥18 MΩ cm) was used throughout.
Preparation of ZnS/CdS heterojunction nanoparticles on ITO
An ITO electrode with an effective working area of 1 cm2 was successively ultrasonicated with acetone, ethanol and water for 20 minutes, respectively. Electrodeposition of ZnS/CdS on a cleaned ITO electrode was carried out potentiostatically at −0.75 V for 600 s in 50 mM citrate buffer solution (pH 3.0) containing 0.02 M CdCl2, 0.02 M ZnCl2 and 0.008 M Na2S2O3. The potential was referred to the KCl-saturated calomel electrode (SCE). The electrodeposition bath was maintained at 50 °C in a constant temperature water bath. After electrodeposition, the ZnS/CdS/ITO electrode was annealed at 300 °C for 30 min under a N2 atmosphere. The preparation of ZnS/ITO and CdS/ITO electrodes was similar to that of the ZnS/CdS/ITO electrode except that the electrodeposition bath was without CdCl2 and ZnCl2, respectively.Preparation of cysteine@liposome nanocapsules
The preparation of Cys@liposome nanocapsules was similar to our previous work.30 In brief, 22 mg of dipalmitoyl phosphocholine, 11.6 mg of cholesterol and 3.5 mg of dipalmitoyl phosphoethanolamine were dissolved in 4 mL of chloroform. After sonication for 10 min under a N2 atmosphere, chloroform was removed by vacuum rotary evaporation, and a uniform lipid film was obtained. To encapsulate the L-cysteine, 5 mL of L-cysteine aqueous solution (20 mM) was added to the lipid film. The lipid film was hydrated for 2 h at 45 °C, and then sonicated for 10 min. The unencapsulated L-cysteine was removed by dialyzing against 0.01 M phosphate buffer solution (PBS, pH 7.4) for 24 h at room temperature. The obtained cysteine@liposome nanocapsules were stored at 4 °C for future use.Preparation of cysteine@liposome immunonanocapsules
4 mg of N-(3-(dimethylamino) propyl)-N′-ethylcarbodiimide hydrochloride and 2 mg of N-hydroxysuccinimide were added in 5 mL of 0.01 M PBS containing 1 mg mL−1 of Cys@liposome nanocapsules, and then 100 μL of anti-S. aureus antibody (0.1 mg mL−1) was added. After reaction for 4 h, the cysteine@liposome immunonanocapsules were collected by centrifugation and washed with PBS. The obtained immunonanocapsules were dispersed in 1 mL PBS containing 1 wt% bovine serum albumin (BSA). After gentle agitation for 1 h, the cysteine@liposome immunonanocapsules blocked by BSA were collected by centrifugation and washed with PBS. Finally, the cysteine@liposome immunonanocapsules were dispersed in 1 mL PBS and stored at 4 °C for future use. Immunomagnetic nanoparticles were prepared according to our previous work.31Photoelectrochemical detection of S. aureus
100 μL of 1 mg mL−1 cysteine@liposome immunonanocapsules and 100 μL of 0.4 mg mL−1 immunomagnetic nanoparticles were mixed evenly in PBS. The mixture was incubated with 1 mL PBS containing different concentrations of S. aureus for 1 h at 37 °C. After magnetic separation, the captured bacterial cells labeled with the cysteine@liposome immunonanocapsules were dispersed in 490 μL of Na2SO4 aqueous solution (0.1 M), followed by the addition of 10 μL of Tween 20 to release L-cysteine. After reaction for 30 min, the above solution was used for photoelectrochemical detection using the ZnS/CdS/ITO electrode at an applied potential of 0.1 V in a conventional three-electrode system.3. Results and discussion
Preparation and characterization of ZnS/CdS heterojunction nanoparticles
ZnS/CdS heterojunction nanoparticles were prepared by potentiostatical electrodeposition on the ITO electrode in an acidic solution (pH 3.0) containing 0.02 M CdCl2, 0.02 M ZnCl2 and 0.008 M Na2S2O3. As shown in Fig. S1a,† in the Na2S2O3 aqueous solution, the cyclic voltammogram shows a cathodic peak at −0.55 V followed by a large cathodic current. As reported previously, S2O32− can undergo disproportionation reaction in acidic solution and decompose into colloidal S and SO32−, and colloidal S and SO32− can be further reduced at the electrode according to the following equations:32,33| SO32− + 4e− + 6H+ → S + 3H2O | (1) |
| S + 2H++2e− → H2S(aq) | (2) |
Therefore, the cathodic peak in Fig. S1a† is due to the electrochemical reduction of colloidal S and SO32− at the ITO electrode, and the large cathodic current at potentials negative than −0.8 V is mainly due to the electrochemical reduction of H+. As shown in Fig. S1b,† electrochemical reduction of Cd2+ starts at −0.8 V, and electrochemical reduction of Zn2+ occurs at more negative potentials (Fig. S1c†). To avoid the deposition of Cd and Zn, ZnS/CdS heterojunction nanoparticles should be prepared by potentiostatic electrodeposition at potentials positive than −0.8 V. In this work, electrodeposition of ZnS/CdS on the ITO electrode was carried out potentiostatically at −0.75 V in citrate buffer solution (pH 3.0) containing CdCl2, ZnCl2 and Na2S2O3. The produced H2S by electrochemical reduction of colloidal S can react with Cd2+ and Zn2+ and form CdS and ZnS, respectively:
| Cd2+ + H2S(aq) → CdS + 2H+ | (3) |
| Zn2+ + H2S(aq) → ZnS + 2H+ | (4) |
The ZnS/CdS deposited on the ITO electrode was characterized by SEM, energy dispersion spectroscopy, and TEM. The SEM images in Fig. 2a and b reveal that ZnS/CdS shows a particle structure, with an average diameter of 59 nm (Fig. 2c). ZnS/ITO and CdS/ITO electrodes were also prepared using Na2S2O3 as the sulfur source. As shown in Fig. S2,† ZnS and CdS also exhibit uniform particle shapes, and the average sizes of ZnS and CdS nanoparticles are of 43.8 and 34.8 nm, respectively. Fig. 2d shows the energy dispersion X-ray spectrum (EDS) of ZnS/CdS nanoparticles on the ITO, and the result indicates that the atomic ratio of Zn, Cd and S on the ITO electrode is close to 1![[thin space (1/6-em)]](https://www.rsc.org/images/entities/char_2009.gif) :
:![[thin space (1/6-em)]](https://www.rsc.org/images/entities/char_2009.gif) 1
1![[thin space (1/6-em)]](https://www.rsc.org/images/entities/char_2009.gif) :
:![[thin space (1/6-em)]](https://www.rsc.org/images/entities/char_2009.gif) 2, implying the coexistence of ZnS and CdS on the ITO electrode. The TEM image in Fig. 2e indicates that the ZnS/CdS nanoparticle is composed of many small nanoparticles. Energy dispersive X-ray elemental mapping of a ZnS/CdS nanoparticle confirms that it consists of Zn, Cd, and S (Fig. S3†). The high-resolution TEM (HRTEM) image in Fig. 2f shows clear lattice fringes of 0.334 and 0.313 nm, corresponding to the (002) lattice spacing of CdS and the (002) lattice spacing of ZnS, respectively. The HRTEM image clearly indicates that some small ZnS and CdS nanoparticles aggregate together to form a ZnS/CdS heterojunction nanoparticle.
2, implying the coexistence of ZnS and CdS on the ITO electrode. The TEM image in Fig. 2e indicates that the ZnS/CdS nanoparticle is composed of many small nanoparticles. Energy dispersive X-ray elemental mapping of a ZnS/CdS nanoparticle confirms that it consists of Zn, Cd, and S (Fig. S3†). The high-resolution TEM (HRTEM) image in Fig. 2f shows clear lattice fringes of 0.334 and 0.313 nm, corresponding to the (002) lattice spacing of CdS and the (002) lattice spacing of ZnS, respectively. The HRTEM image clearly indicates that some small ZnS and CdS nanoparticles aggregate together to form a ZnS/CdS heterojunction nanoparticle.
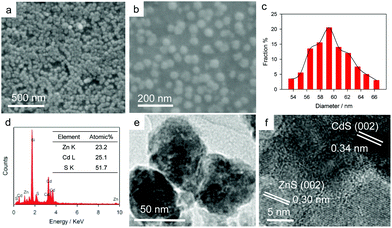 | ||
| Fig. 2 SEM images (a and b), size distribution (c), EDS (d), TEM image (e), and HRTEM image (f) of ZnS/CdS heterojunction nanoparticles. | ||
Photoelectrochemical performance of ZnS/CdS heterojunction nanoparticles
Fig. 3a shows the UV-Vis spectra of ZnS, CdS, and Zn/CdS. One can see that ZnS nanoparticles mainly absorb ultraviolet light, and their absorption edge is about 510 nm. CdS nanoparticles can absorb more visible light than ZnS nanoparticles, and their absorption range extends to 600 nm. Interestingly, the absorption range of Zn/CdS heterojunction nanoparticles extends to 700 nm, indicating that Zn/CdS heterojunction nanoparticles exhibit enhanced visible light absorption compared with pure CdS or ZnS. The enhanced visible light absorption will be beneficial for achieving improved photoelectrochemical performance. Fig. 3b shows the photocurrent responses of ZnS/ITO, CdS/ITO and ZnS/CdS/ITO at 0.1 V in 0.1 M Na2SO4 aqueous solution containing 50 μM L-cysteine. Obviously, the photocurrent response of ZnS/CdS/ITO is much higher than those of CdS/ITO and ZnS/ITO. The n–n type ZnS/CdS heterojunction structure formed can show increased light absorption ability and improved electron–hole separation efficiency,29 so it is reasonable that the ZnS/CdS/ITO electrode shows superior photoelectrochemical response to ZnS/ITO and CdS/ITO.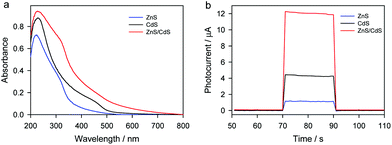 | ||
| Fig. 3 (a) UV-Vis spectra of ZnS/ITO, CdS/ITO and ZnS/CdS/ITO. (b) Photocurrent responses of ZnS/ITO, CdS/ITO and ZnS/CdS/ITO at 0.1 V in 0.1 M Na2SO4 aqueous solution containing 50 μM L-cysteine. | ||
Zn/Cd atomic ratios in ZnS/CdS heterojunction nanoparticles can be controlled by simply varying the concentrations of Zn2+ and Cd2+ in the electrodeposition bath. As shown in Table S1,† the Zn/Cd atomic ratios in the ZnS/CdS heterojunction nanoparticles measured by EDS are close to the concentration ratios of Cd2+ and Zn2+ in the electrodeposition bath. Photocurrent responses of ZnS/CdS/ITO with different Zn/Cd atomic ratios to L-cysteine were measured. As shown in Fig. S4,† the ZnS/CdS heterojunction nanoparticles with a Zn/Cd atomic ratio of 1![[thin space (1/6-em)]](https://www.rsc.org/images/entities/char_2009.gif) :
:![[thin space (1/6-em)]](https://www.rsc.org/images/entities/char_2009.gif) 1 show the highest photocurrent response to L-cysteine among various samples, so the ZnS/CdS/ITO with a Zn/Cd atomic ratio of 1
1 show the highest photocurrent response to L-cysteine among various samples, so the ZnS/CdS/ITO with a Zn/Cd atomic ratio of 1![[thin space (1/6-em)]](https://www.rsc.org/images/entities/char_2009.gif) :
:![[thin space (1/6-em)]](https://www.rsc.org/images/entities/char_2009.gif) 1 was used for photoelectrochemical analysis.
1 was used for photoelectrochemical analysis.
The effects of deposition potential and deposition time on the photocurrent responses of the ZnS/CdS/ITO electrode to L-cysteine were studied. As shown in Fig. S5a,† the optimal deposition potential is −0.75 V. Cd can be deposited on the ITO by electrochemical reduction of Cd2+ at deposition potentials negative than −0.8 V (Fig. S1†), and the deposition efficiency would decrease at deposition potentials positive than −0.75 V, so a deposition potential of −0.75 V was used to prepare the ZnS/CdS/ITO electrode. As shown in Fig. S5b,† with the increase in deposition time from 300 to 600 s, the photocurrent responses of the ZnS/CdS/ITO electrode to L-cysteine increase sharply, and the photocurrent responses increase slightly with the increase in deposition time from 600 to 800 s, so a deposition time of 600 s was used to prepare the ZnS/CdS/ITO electrode. The effect of bias potential on the photocurrent responses of the ZnS/CdS/ITO electrode to L-cysteine was studied (Fig. S6†). With the increase in bias potential from −0.2 to 0.1 V, the photocurrent responses increase greatly, and reach a stable value at the potentials higher than 0.1 V, so the photoelectrochemical measurements were carried out at a bias potential of 0.1 V.
Fig. 4a shows the photocurrent responses of the ZnS/CdS/ITO electrode to different concentrations of L-cysteine. L-Cysteine can serve as the sacrificial electron donor, so the photocurrent responses increase along with the increase in L-cysteine concentration. As shown in Fig. 4b, photocurrent responses are proportional to the L-cysteine concentration from 50 nM to 70 μM, with a detection limit of 50 nM.
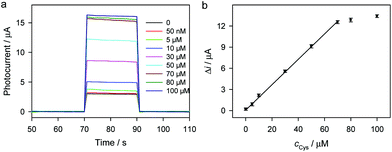 | ||
| Fig. 4 Photocurrent responses (a) and the corresponding calibration curve (b) of the ZnS/CdS/ITO electrode in 0.1 M Na2SO4 aqueous solution containing different concentrations of L-cysteine. | ||
Characterization of cysteine@liposome immunonanocapsules
Considering that liposome nanocapsule labeling has been proved to be an efficient signal-amplification strategy for biosensing,30,34–36 cysteine@liposome nanocapsules were prepared and used as the labels for photoelectrochemical detection of S. aureus. The TEM image of cysteine@liposome nanocapsules in Fig. 5a indicates that the nanocapsules are monodisperse spheres, and the sizes of the cysteine@liposome nanocapsules range from 70 to 120 nm. FTIR spectrometry was used to confirm the successful encapsulation of L-cysteine in liposome nanocapsules. The FTIR spectrum of liposomes in Fig. 5b shows two peaks at 2920 and 2851 cm−1, corresponding to the –CH2 stretching vibration, and the peaks at 1752 and 1257 cm−1 are attributed to the symmetrical stretching vibration of C![[double bond, length as m-dash]](https://www.rsc.org/images/entities/char_e001.gif) O and the antisymmetric stretching vibration of PO4, respectively.37 Two peaks in the FTIR spectrum of L-cysteine at 3175 and 2978 cm−1 are associated with the antisymmetric and symmetric C–H stretching vibrations of the CH2 group, respectively, and the peaks at 1610 and 1397 cm−1 are associated with the antisymmetric and symmetric stretching vibrations of COO–, respectively.38 A small peak at 2552 cm−1 is related to the stretching vibration peak of –SH in L-cysteine.38 In the FTIR spectrum of cysteine@liposomes, all characteristic peaks of L-cysteine and liposomes can be observed, indicating that L-cysteine was successfully filled in the nanocapsules. To quantitatively measure the amount of L-cysteine in the nanocapsules, the cysteine@liposome nanocapsules were lysed with Tween 20, and then the released L-cysteine was photoelectrochemically detected using the ZnS/CdS/ITO. The weight percentage of L-cysteine in the nanocapsules is as high as 57.4%, implying that a large number of L-cysteine molecules are encapsulated in each nanocapsule.
O and the antisymmetric stretching vibration of PO4, respectively.37 Two peaks in the FTIR spectrum of L-cysteine at 3175 and 2978 cm−1 are associated with the antisymmetric and symmetric C–H stretching vibrations of the CH2 group, respectively, and the peaks at 1610 and 1397 cm−1 are associated with the antisymmetric and symmetric stretching vibrations of COO–, respectively.38 A small peak at 2552 cm−1 is related to the stretching vibration peak of –SH in L-cysteine.38 In the FTIR spectrum of cysteine@liposomes, all characteristic peaks of L-cysteine and liposomes can be observed, indicating that L-cysteine was successfully filled in the nanocapsules. To quantitatively measure the amount of L-cysteine in the nanocapsules, the cysteine@liposome nanocapsules were lysed with Tween 20, and then the released L-cysteine was photoelectrochemically detected using the ZnS/CdS/ITO. The weight percentage of L-cysteine in the nanocapsules is as high as 57.4%, implying that a large number of L-cysteine molecules are encapsulated in each nanocapsule.
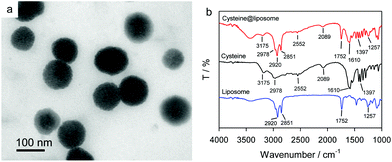 | ||
| Fig. 5 (a) TEM image of cysteine@liposome nanocapsules. (b) FTIR spectra of liposome, L-cysteine, and cysteine@liposome nanocapsules. | ||
To specially recognize S. aureus, cysteine@liposome nanocapsules and magnetic nanoparticles were conjugated with an anti-S. aureus antibody. Sodium dodecyl sulfate polyacrylamide gel electrophoresis (SDS-PAGE) was performed to verify that the anti-S. aureus antibody was successfully linked to cysteine@liposome nanocapsules and magnetic nanoparticles (Fig. S7†). The band of the anti-S. aureus antibody appears at 50–60 kDa. The cysteine@liposome immunonanocapsules show a band at 60–70 kDa, while the band of immunomagnetic nanoparticles appears at 70–80 kDa. Compared with the anti-S. aureus antibody, the electrophoretic mobility of cysteine@liposome immunonanocapsules and immunomagnetic nanoparticles decreases significantly, confirming that the anti-S. aureus antibody was successfully linked to cysteine@liposome nanocapsules and magnetic nanoparticles. After the incubation of cysteine@liposome immunonanocapsules with S. aureus cells, a large number of cysteine@liposome immunonanocapsules linked to S. aureus cells can be observed (Fig. S8†), confirming that cysteine@liposome immunonanocapsules can be used as labels for the detection of S. aureus. As shown in Fig. S9,†S. aureus cells can be successfully separated from the samples by immunomagnetic nanoparticles.
Photoelectrochemical detection of S. aureus
Photoelectrochemical detection of S. aureus was carried out. As illustrated in Fig. 1, S. aureus cells are separated from the samples by immunomagnetic nanoparticles and simultaneously labeled with cysteine@liposome immunonanocapsules. Then, the cysteine@liposome immunonanocapsules labeled to S. aureus cells were lysed with Tween 20, and the released L-cysteine was used for photoelectrochemical analysis using the ZnS/CdS/ITO electrode. To achieve the highest photocurrent responses for the detection of S. aureus, some experimental parameters were optimized. As shown in Fig. S10,† the optimal weight ratio of cysteine@liposome immunonanocapsules and immunomagnetic nanoparticles is 5![[thin space (1/6-em)]](https://www.rsc.org/images/entities/char_2009.gif) :
:![[thin space (1/6-em)]](https://www.rsc.org/images/entities/char_2009.gif) 2, and the optimal incubation time is 60 min.
2, and the optimal incubation time is 60 min.
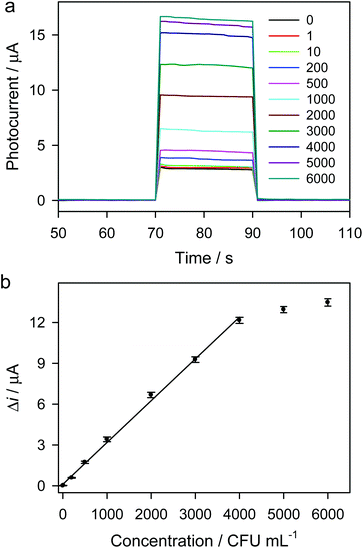
Under optimal conditions, the photocurrent responses for the detection of different concentrations of S. aureus are shown in Fig. 6a. The photocurrent responses increase with the increase in S. aureus concentration. As shown in Fig. 6b and Fig. S11,† the linear range for photoelectrochemical detection of S. aureus is from 1 to 4000 CFU mL−1 (R2 = 0.9983). The relative standard deviation (RSD) for three parallel tests was less than 6%. The limit of detection (LOD) for the proposed photoelectrochemical detection is calculated based on the equation LOD = 3σ/k, where σ is the standard deviation of background, and k is the slope of the calibration curve. The σ in our work is lower than 1 × 10⁻³ μA, and k is 3.07 × 10⁻³ μA mL CFU−1, so the LOD is estimated to be ca. 1 CFU mL−1. The LOD is significantly lower than those of various methods reported previously (Table S2†), indicating a sensitive method for the detection of S. aureus. A lot of cysteine@liposome immunonanocapsules were labeled to each S. aureus cell (Fig. S8†), and a large number of L-cysteine molecules were filled in each immunonanocapsule, enabling great amplification of the photoelectrochemical signals. Due to the great signal amplification of cysteine@liposome immunonanocapsule labeling and the high photoelectrochemical responses of the ZnS/CdS/ITO electrode to L-cysteine, sensitive photoelectrochemical detection of S. aureus was achieved. The infectious dose of many foodborne pathogens (e.g. E. coli O157:H7) is as low as 10 cells,39 so the detection of foodborne pathogens down to 10 CFU mL−1 is necessary. Obviously, our method will be beneficial for the detection of foodborne pathogens at ultralow concentrations.
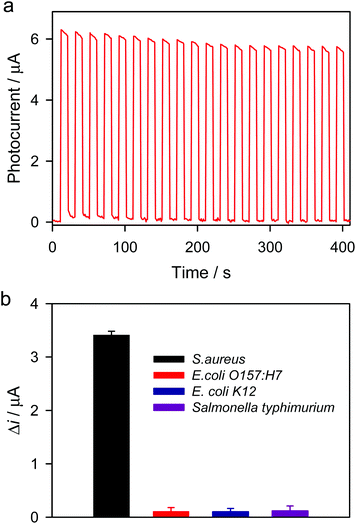
To study the stability of ZnS/CdS/ITO for photoelectrochemical detection of S. aureus, the transient photocurrent responses were measured for 20 on–off cycles of intermittent irradiation. As shown in Fig. 7a, the photocurrent responses for the detection of S. aureus (1000 CFU mL−1) show no obvious change. The RSD was 3.8% (on) and 7.9% (off). These results indicate that the ZnS/CdS/ITO electrode shows good stability for the detection of S. aureus. The specificity of the proposed photoelectrochemical detection was investigated. As shown in Fig. 7b, the photocurrent response for S. aureus is much higher than those for E. coli O157:H7, E. coli K12 and Salmonella typhimurium, resulting from the high immunoaffinity between the anti-S. aureus antibody and the surface antigen on S. aureus. Photoelectrochemical detection of S. aureus in milk and juice was carried out, and the results are shown in Table 1. The recoveries are between 97 and 102%, indicating that this method can be used for the detection of S. aureus in real samples. In our work, photoelectrochemical detection of S. aureus was achieved by coupling the cysteine@liposome immunonanocapsule labeling with immunomagnetic separation/enrichment and photoelectrochemical analysis using the ZnS/CdS/ITO electrode, all of which can effectively avoid false positive results.
| Sample | Added (CFU mL−1) | Detected (CFU mL−1) | Recovery (%) |
|---|---|---|---|
| Milk | 100 | 97 ± 2 | 97 |
| 200 | 196 ± 6 | 98 | |
| 500 | 510 ± 20 | 102 | |
| Juice | 100 | 96 ± 2 | 96 |
| 200 | 198 ± 10 | 99 | |
| 500 | 490 ± 20 | 98 |
4. Conclusions
In summary, ZnS/CdS heterojunction nanoparticles were prepared on the ITO electrode by one-pot electrodeposition using Na2S2O3 as the sulfur source. The composition of ZnS/CdS heterojunction nanoparticles can be controlled by simply varying the concentrations of Zn2+ and Cd2+ in the electrodeposition bath. The ZnS/CdS heterojunction nanoparticles exhibit better photoelectric activity than those of ZnS and CdS nanoparticles. Cysteine@liposome immunonanocapsules were prepared and used as the labels for photoelectrochemical detection of S. aureus. Due to the great signal amplification of cysteine@liposome immunonanocapsule labeling and the high photoelectrochemical responses of the ZnS/CdS/ITO electrode to L-cysteine, the limit of detection for photoelectrochemical detection of S. aureus is as low as 1 CFU mL−1. This work not only demonstrates a facile method for the synthesis of a high-performance ZnS/CdS heterojunction optoelectronic material, but also provides a new method for rapid and sensitive detection of foodborne pathogens.Conflicts of interest
There are no conflicts to declare.Acknowledgements
This work was supported by the National Natural Science Foundation of China (21705045, 21675050, and 21775041), the Science and Technology Innovation Project of Hunan Province (2018RS3062), the Natural Science Foundation of Hunan Province (2018JJ2252), the Scientific Research Fund of Hunan Provincial Education Department (17A125), and the Science and Technology Project of Changsha (KQ1802036).Notes and references
- W. J. Loesche, D. E. Lopatin, J. Stoll, N. van Poperin and P. P. Hujoel, J. Clin. Microbiol., 1992, 30, 418–426 CAS.
- J. C. Cheng, C. L. Huang, C. C. Lin, C. C. Chen, Y. C. Chang, S. S. Chang and C. P. Tseng, Clin. Chem., 2006, 52, 1997–2004 CrossRef CAS PubMed.
- O. Lazcka, F. J. Del Campo and F. X. Munoz, Biosens. Bioelectron., 2007, 22, 1205–1217 CrossRef CAS.
- C. H. Gayathri, P. Mayuri, K. Sankaran and A. S. Kumar, Biosens. Bioelectron., 2016, 82, 71–77 CrossRef CAS PubMed.
- F. Salam, Y. Uludag and I. E. Tothill, Talanta, 2013, 115, 761–767 CrossRef CAS.
- M. Barreiros dos Santos, J. P. Agusil, B. Prieto-Simon, C. Sporer, V. Teixeira and J. Samitier, Biosens. Bioelectron., 2013, 45, 174–180 CrossRef CAS.
- S. Wu, N. Duan, Z. Shi, C. Fang and Z. Wang, Anal. Chem., 2014, 86, 3100–3107 CrossRef CAS PubMed.
- Y. Zhang, C. Tan, R. Fei, X. Liu, Y. Zhou, J. Chen, H. Chen, R. Zhou and Y. Hu, Anal. Chem., 2014, 86, 1115–1122 CrossRef CAS PubMed.
- G. A. R. Y. Suaifan, S. Alhogail and M. Zourob, Biosens. Bioelectron., 2017, 92, 702–708 CrossRef CAS.
- S. Wang, W. Deng, L. Yang, Y. Tan, Q. Xie and S. Yao, ACS Appl. Mater. Interfaces, 2017, 9, 24440–24445 CrossRef CAS.
- M. Zhong, L. Yang, H. Yang, C. Cheng, W. Deng, Y. Tan, Q. Xie and S. Yao, Biosens. Bioelectron., 2019, 126, 493–500 CrossRef CAS.
- W.-W. Zhao, M. Xiong, X.-R. Li, J.-J. Xu and H.-Y. Chen, Electrochem. Commun., 2014, 38, 40–43 CrossRef CAS.
- W.-W. Zhao, J.-J. Xu and H.-Y. Chen, Chem. Soc. Rev., 2015, 44, 729–741 RSC.
- Y. Zang, J. Lei, Q. Hao and H. Ju, ACS Appl. Mater. Interfaces, 2014, 6, 15991–15997 CrossRef CAS.
- J. Tang, B. Kong, Y. Wang, M. Xu, Y. Wang, H. Wu and G. Zheng, Nano Lett., 2013, 13, 5350–5354 CrossRef CAS.
- S. Liu, C. Li, J. Cheng and Y. Zhou, Anal. Chem., 2006, 78, 4722–4726 CrossRef CAS.
- W. Tu, H. Cao, L. Zhang, J. Bao, X. Liu and Z. Dai, Anal. Chem., 2016, 88, 10459–10465 CrossRef CAS.
- Y. Lin, Q. Zhou, D. Tang, R. Niessner, H. Yang and D. Knopp, Anal. Chem., 2016, 88, 7858–7866 CrossRef CAS PubMed.
- Z. Qian, H. J. Bai, G. L. Wang, J. J. Xu and H. Y. Chen, Biosens. Bioelectron., 2010, 25, 2045–2050 CrossRef CAS.
- Z. Yang, Y. Wang and D. Zhang, Sens. Actuators, B, 2018, 274, 228–234 CrossRef CAS.
- Q. Guo, H. W. Hillhouse and R. Agrawal, J. Am. Chem. Soc., 2009, 131, 11672–11673 CrossRef CAS.
- C. J. Barrelet, Y. Wu, D. C. Bell and C. M. Lieber, J. Am. Chem. Soc., 2003, 125, 11498–11499 CrossRef CAS.
- Y. J. Xu, D. S. Xu, D. P. Chen, G. L. Guo and C. J. Li, Acta Phys.-Chim. Sin., 1999, 15, 577–580 CAS.
- X.-J. Wu, F. Zhu, C. Mu, Y. Liang, L. Xu, Q. Chen, R. Chen and D. Xu, Coord. Chem. Rev., 2010, 254, 1135–1150 CrossRef CAS.
- C. R. Lubeck, T. Y. J. Han, A. E. Gash, J. H. Satcher and F. M. Doyle, Adv. Mater., 2006, 18, 781–784 CrossRef CAS.
- D. H. Son, S. M. Hughes, Y. Yin and A. P. Alivisatos, Science, 2004, 306, 1009–1012 CrossRef CAS PubMed.
- J. Du, X. Yu and J. Di, Biosens. Bioelectron., 2012, 37, 88–93 CrossRef CAS PubMed.
- J. Du, X. Yu, Y. Wu and J. Di, Mater. Sci. Eng., C, 2013, 33, 2031–2036 CrossRef CAS.
- J. Zhang, L. H. Wang, X. H. Liu, X. A. Li and W. Huang, J. Mater. Chem. A, 2015, 3, 535–541 RSC.
- W. Deng, C. Cheng, H. Yang, H. Wang, Y. Tan, Q. Xie, M. Ma and S. Yao, Talanta, 2019, 202, 244–250 CrossRef CAS.
- L. Yang, W. Deng, C. Cheng, Y. Tan, Q. Xie and S. Yao, ACS Appl. Mater. Interfaces, 2018, 10, 3441–3448 CrossRef CAS.
- K. Zarebska and M. Skompska, Electrochim. Acta, 2011, 56, 5731–5739 CrossRef CAS.
- I. V. Demidenko and V. M. Ishimov, Russ. J. Appl. Chem., 2017, 90, 1225–1229 CrossRef CAS.
- Y. Lin, Q. Zhou and D. Tang, Anal. Chem., 2017, 89, 11803–11810 CrossRef CAS.
- Y. Lin, Q. Zhou, Y. Zeng and D. Tang, Microchim. Acta, 2018, 185, 311–320 CrossRef.
- L.-P. Mei, F. Liu, J.-B. Pan, W.-W. Zhao, J.-J. Xu and H.-Y. Chen, Anal. Chem., 2017, 89, 6300–6304 CrossRef CAS.
- X. Chen, L.-Q. Zou, J. Niu, W. Liu, S.-F. Peng and C.-M. Liu, Molecules, 2015, 20, 14293–14311 CrossRef CAS PubMed.
- H. L. Fan, L. Li, S. F. Zhou and Y. Z. Liu, Ceram. Int., 2016, 42, 4228–4237 CrossRef CAS.
- A. Wolter, R. Niessner and M. Seidel, Anal. Chem., 2008, 80, 5854–5863 CrossRef CAS PubMed.
Footnote |
| † Electronic supplementary information (ESI) available: Additional experimental section, figures and tables. See DOI: 10.1039/c9an02020a |
| This journal is © The Royal Society of Chemistry 2020 |

