 Open Access Article
Plasmon induced deprotonation of 2-mercaptopyridine
Pushkar
Singh
a,
Tanja
Deckert-Gaudig
 a,
Zhenglong
Zhang
 b and
Volker
Deckert
 *acd
*acd
aLeibniz Institute of Photonic Technology, Albert-Einstein-Str. 9, 07745 Jena, Germany. E-mail: volker.deckert@leibniz-ipht.de
bSchool of Physics and Information Technology, Shaanxi Normal University, Xi'an, 710062, China
cInstitute of Physical Chemistry and Abbe Center of Photonics, Friedrich-Schiller University Jena, Helmholtzweg 4, 07743 Jena, Germany
dInstitute of Quantum Science and Engineering, Texas A&M University, College Station, TX 77843-4242, USA
First published on 3rd February 2020
Abstract
Surface plasmons can provide a novel route to induce and simultaneously monitor selective bond formation and breakage. Here pH-induced protonation, followed by plasmon-induced deprotonation of 2-mercaptopyridine was investigated using surface- and tip-enhanced Raman scattering (SERS and TERS). A large difference in the deprotonation rate between SERS and TERS will be demonstrated and discussed with respect to hot-spot distribution.
The pathway of a chemical reaction can be controlled by varying the experimental conditions such as temperature, concentration, pH or, a recent development, by the application of surface plasmons. Plasmon induced catalysis is an emerging approach to induce chemical reactions and can for instance be applied to a variety of reactions types, which can be probed by surface-enhanced Raman scattering (SERS) or tip-enhanced Raman scattering (TERS).1–6 The background of this type of catalysis is the activation of a light-induced plasmonic activity of metal nanostructures. In particular the reactions of nitro- and amino-substituted aromatic thiols to the corresponding diazo compounds have been extensively studied.7,8
Such reactions would otherwise need extreme conditions like e.g. very high temperatures or short excitation wavelengths.9–11 Laser irradiation of metal nanoparticles at their plasmon resonance leads to an efficient generation of collective oscillations of free conduction band electrons at the surface of the nanoparticles. As a result localized surface plasmon resonances are generated.12,13 In general, surface plasmons can locally enhance the electromagnetic field by many orders of magnitude. In combination with Raman spectroscopy, as realized in surface-enhanced Raman scattering (SERS) or tip-enhanced Raman scattering (TERS), such nanostructured surfaces yield a huge signal enhancement of the sample.14,15 For more details on both methods it is referred to ref. 16–18.
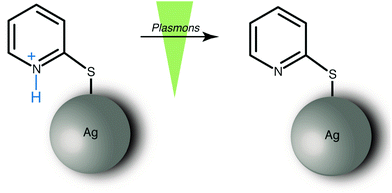
In this study, we experimentally demonstrate that surface plasmons can induce a deprotonation reaction from an aromatic ring system. An earlier work on a self assembled monolayers (SAM) of a substituted thiaheterohelicene reported that the abstraction of hydrogen atoms under TERS conditions is feasible.19 In our approach, the model system 2-mercaptopyridine (2-MPY) was protonated (2-MPY-H+) at low pH conditions prior to adsorption on the substrate. Subsequent deprotonation was achieved by exposing the pyridinium cation to surface plasmons as illustrated in Scheme 1.
In a previous study we reported that 4-mercaptopyridine (4-MPY) can be protonated under ambient conditions utilizing surface plasmons.20 There, the protonation of 4-MPY immobilized on a silver island film under ambient conditions was tracked using SERS. The intensity increase of the ring stretching mode associated with the protonated nitrogen and the simultaneous intensity decrease of the ring stretching mode corresponding to the unprotonated nitrogen was observed. 2-MPY differs from 4-MPY only by the thiol group position with respect to the nitrogen in the pyridine ring. Nevertheless, the position of the nitrogen atom (para vs. ortho) is decisive for the different chemical behavior of 2-MPY and 4-MPY, as it will be demonstrated using SERS and TERS techniques.
In the SERS case, all molecules attached to a nanoparticle that are in the laser focus potentially can contribute to the signal while in TERS only molecules directly underneath the tip apex experience a signal enhancement. Furthermore, a previously detected faster reaction rate under TERS condition20 needed to be further investigated.
The detailed instrumental setup for the SERS and TERS used in this work has been described in detail earlier.26 An important aspect is that for both TERS and SERS the same illumination and collection optics was used to provide roughly comparable power densities (60× oil immersion, N.A. 1.45, Olympus, Japan). A 10−3 M ethanolic solution of 2-MPY or a 10−3 M ethanol–water solution, either at pH 7 or pH 1.3, was used for SERS and TERS sample preparation. For SERS, a drop of the solution was drop cast on a silver island film, dried, and washed with ethanol to remove any unbound molecules. In the TERS study gold nanoplates were immersed in the respective solution for 20 h and then washed with ethanol. Fig. 1 shows SERS spectra (λ = 532 nm, P = 180 μW) of 2-MPY at different time-points. A gradual intensity decrease of all bands indicates a slow degradation (probably oxidation) of the silver island film, since the measurements were carried out under ambient conditions.
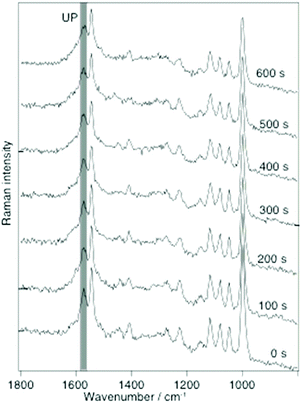 | ||
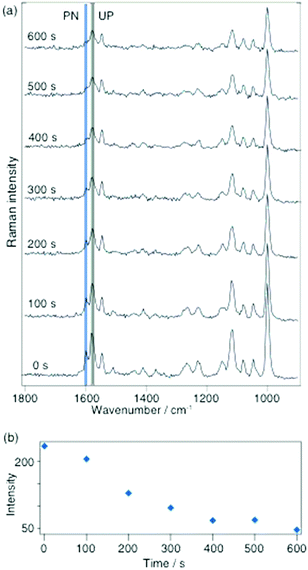
Fig. 1 Selected time-dependent SERS spectra of 2-MPY adsorbed from ethanolic solution (pH 7) on a silver island film with 180 μW@532 nm, acquisition time: 1 s per spectrum. Band assignment: 1000 cm−1(ring breathing), 1048 cm−1 (β(C–H)), 1082 cm−1 (β(C–H)), 1116 cm−1 (ring breathing/ν(C–S)), 1546 cm−1 (ν(C![[double bond, length as m-dash]](https://www.rsc.org/images/entities/char_e001.gif) C)) and 1574 cm−1 (ring stretching mode with unprotonated nitrogen(UP)).21–25 No band at 1605 cm−1 (indicator for protonated 2-MPY (PN)) was detected. C)) and 1574 cm−1 (ring stretching mode with unprotonated nitrogen(UP)).21–25 No band at 1605 cm−1 (indicator for protonated 2-MPY (PN)) was detected. | ||
This effect did not further interfere with the experiment and can be accounted for by normalization procedures. Of main interest was the behavior of the band at 1574 cm−1, a marker for the unprotonated pyridine ring (UP). The constant intensity of this peak over 600 s indicates that 2-MPY was stable and was not protonated under atmospheric SERS conditions. In case of a protonation, an additional peak around 1605 cm−1, a marker for the protonated pyridine ring (PN), would have been observed. Hence, in contrast to the previously studied 4-MPY, no protonation occurred for 2-MPY under similar surface plasmons conditions. Structurally, a different binding situation of 2-MPY on the silver nanoparticles can be considered for the different behavior. When the covalent Ag–S bond is formed during immobilization, the nitrogen atom of the tilted 2-MPY will be close to the metal surface resulting in additional Ag–N interactions. Such an interaction clearly obstructs the access to the nitrogen atom. Even when the SERS experiment was repeated at a higher incident laser power (up to 1 mW, not shown), a protonation was never observed.
In a subsequent experiment 2-MPY was drop cast as indicated above, but this time from a pH 1.3 solution on a silver island film. The investigation under otherwise similar conditions as previously indicates that a new peak at 1605 cm−1 could be detected (see Fig. 2a). The presence of this peak indicates that a protonated compound, 2-MPY-H+, exists right from the beginning. As time progressed the relative intensity of this peak decreased and after 500 s it finally disappeared, thus clearly indicating a complete reversal of the protonation. To illustrate this process more clearly, Fig. 2b shows the band intensity as a function of time.
Follow-up experiments addressed the laser power dependence of the deprotonation. Below 25 μW no deprotonation was observed, but above this threshold the deprotonation rate increased linearly with increasing incident laser power. This observation indicates that either temperature in the laser focus, which correlates to the incident power, or the photon flux determines the reaction rate.
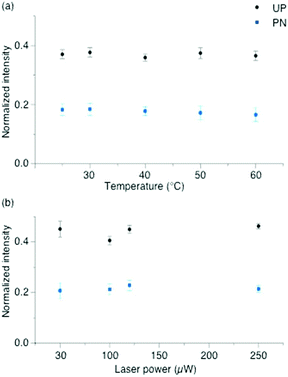
To exclude plasmonic thermal effects due to sample heating in the laser focus, experiments were performed at various temperatures. Fig. 3(a) shows the intensities of protonated and unprotonated bands as a function of temperature. No intensity change of these peaks was observed. Here, the laser power was kept at 20 μW, which was just below the minimum value to initiate a deprotonation at room temperature. Heating the sample up to 60 °C did not change the 2-MPY-H+ spectra, pointing to the stability of the N+–H bond. Since the temperature in the focus at 20 μW was presumably below 60 °C we concluded that the reaction is either temperature independent or higher temperatures are needed to abstract the proton.
Consequently, under the present experimental conditions the rate of deprotonation is not determined by the temperature but by the surface plasmons generated in the laser focus. Fig. 3(b) shows the relative protonated and unprotonated peak intensities measured at different incident laser powers (50, 100, 125 and 250 μW). To keep the radiant fluence constant, measurements were done at different time points (250, 125, 100 and 50 s), respectively. No variations in the peak intensities of protonated and unprotonated species were observed which shows that the reaction rate depends only on the radiant fluence.
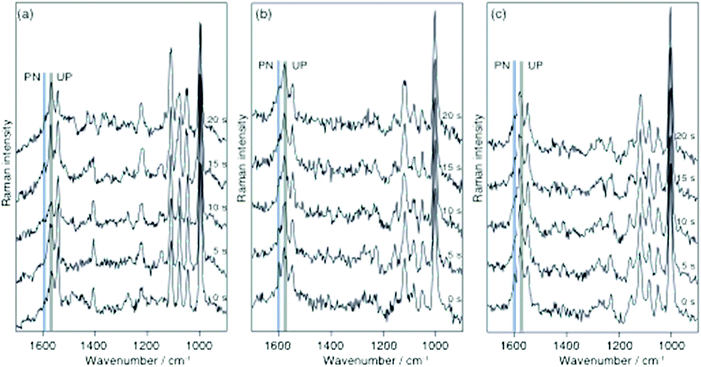
Finally, the protonation/deprotonation of 2-MPY was investigated with TERS to examine if a single silver particle is capable to initiate either both or neither reaction. Such a local controllability essentially would allow confining the reaction to any selected position on the sample substrate. For the TERS measurements 2-MPY was immobilized on transparent gold nanoplates from either a pH 1.3 solution or directly from ethanolic solution. The gold surface was used to uniformly adsorb the thiol to the substrate and thus generating a gap-mode configuration.16,27 From the neat ethanol solution merely the unprotonated species 2-MPY was detected (see continuously collected example spectra in Fig. 4a (λ = 532 nm, P = 620 μW). Note that the nominally 3 times higher power does not directly correspond to a higher radiance at the gap, as the attenuation due to the specific thickness of the gold flake needs to be considered as a rough estimation the transmission should be attenuated by a factor of 3–5, hence we consider the laser power similar to the SERS experiments. Similarly, to the SERS experiments also for TERS no protonation signature was observed for more than 200 s. In contrast, the same sample preparation from the acidic medium yielded 2-MPY-H+ signals only for a short time and complete deprotonation occurred already after 15 s. The data from two independent experiments are given in Fig. 4b and c. This faster reaction agrees with previous protonation experiments and confirms the hypothesis that the gold–silver gap in TERS provides a uniform reaction center with a high turn-over rate.
The average particle orientation/gap formation of the SERS substrate used here in contrast seems to yield much less efficient reaction sites. The experiments clearly show the surface plasmon induced deprotonation of 2-MPY-H+ in SERS and TERS conditions. A comparison of the reaction rate under SERS and TERS shows a faster reaction of 2-MPY-H+ in TERS which was also observed in our previous work.20 Moreover, the comparison of the reaction rate for these two molecules in TERS shows a faster reaction for 4-MPY. The differences in the reaction rate of these molecules under TERS conditions can be explained by a charge-transfer model where the electron transfer from the tip to the nitrogen atom of the pyridine ring determines the rate of chemical reaction. In the case of 4-MPY the nitrogen atom, which is far away from the gold substrate, faces the tip and presumably a direct electron transfer to the nitrogen facilitates the binding of a hydrogen proton. In case of 2-MPY, direct tip–nitrogen atom interactions are sterically hindered by the orientation of the pyridine ring on the gold surface and also due to an increase in the distance between them, which leads to a slower reaction rate compared to 4-MPY.28,29 The faster reaction under TERS compared to SERS is attributed to the higher enhancement in the nanogap between the two metals (Ag–tip and Au–substrate) and the effective charge transfer in the tip–sample geometry.30–35
Conclusions
We experimentally demonstrated that 2-MPY can neither be protonated in the presence of surface plasmons in SERS nor in TERS due to strong substrate–nitrogen interactions. As expected 2-MPY can be protonated chemically under low pH conditions and the resulting pyridinium cation can be deprotonated in the presence of surface plasmons when adsorbed on a silver island film. To exclude photo thermal effects by sample heating a temperature dependent study was performed. Increasing the sample temperature up to 60 °C and keeping the laser power constant did not change the reaction rate, which indicates that the deprotonation reaction is temperature independent, at least under the applied experimental conditions. The faster reaction rate in the TERS experiments can be attributed to a large field confinement in the metal–metal nanogap and charge transfer properties in the experimental configuration. The higher laser power used in the TERS experiment (compared to SERS) increased the reaction rate, which is apparent in the linear increase of the reaction rate with radiant fluence. A plausible explanation of the slower plasmon induced reaction kinetics of 2-MPY compared to 4-MPY in TERS is due to a change of the charge-transfer properties. A faster reaction of 4-MPY can be understood as direct electron transfer from the tip to the nitrogen atom as they are in direct vicinity. In contrast, the position of the nitrogen atom in 2-MPY is far away from the tip, which prohibits a direct electron transfer and leads to a slower reaction compared to 4-MPY.Conflicts of interest
There are no conflicts to declare.Acknowledgements
Financial Support from the European Union and the state of Thuringia (FKZ: 2011 FE 9048; 2011 VF 0016) and COST Action MP1302 “Nanospectroscopy” as well as through the Deutsche Forschungsgemeinschaft CRC 1278 (Project B4) is gratefully acknowledged. P. Singh acknowledges financial supports from Thüringer Aufbaubank (grant number: 2011SE9048) and Z. Zhang via an Alexander von Humboldt fellowship.Notes and references
- P. K. Jain, J. Phys. Chem. C, 2019, 123, 24347–24351 CrossRef CAS.
- J. Quan, E. Cao, X. Mu and M. Sun, Appl. Mater. Today, 2018, 11, 50–56 CrossRef.
- X. Ren, E. Cao, W. Lin, Y. Song, W. Liang and J. Wang, RSC Adv., 2017, 7, 31189–31203 RSC.
- V. Q. Nguyen, Y. Ai, P. Martin and J. C. Lacroix, ACS Omega, 2017, 2, 1947–1955 CrossRef CAS PubMed.
- L. Cui, X. Yang, P. Wang, Y. Qu, W. Liang and M. Sun, J. Raman Spectrosc., 2016, 47, 877–883 CrossRef CAS.
- Z. Zhang, P. Xu, X. Yang, W. Liang and M. Sun, J. Photochem. Photobiol., C, 2016, 127, 100–112 Search PubMed.
- Z. Zhang, M. Richard-Lacroix and V. Deckert, Faraday Discuss., 2017, 205, 213–226 RSC.
- E. M. von Schrojenstein Lantman, T. Deckert-Gaudig, A. J. G. Mank, V. Deckert and B. M. Weckhuysen, Nat. Nanotechnol., 2012, 7, 583–586 CrossRef PubMed.
- M. L. Hause, N. Herath, R. Zhu, M. C. Lin and A. G. Suits, Nat. Chem., 2011, 3, 932 CrossRef CAS PubMed.
- C. Rosado-Reyes and W. Tsang, J. Phys. Chem. A, 2013, 117, 10170 CrossRef CAS PubMed.
- Y. Li, J. Sun, H. Yin, K. Han and G. He, J. Chem. Phys., 2003, 118, 6244–6249 CrossRef CAS.
- E. Hutter and J. H. Fendler, Adv. Mater., 2004, 16, 1685–1706 CrossRef CAS.
- P. K. Jain, X. Huang, I. H. El-Sayed and M. A. El-Sayed, Acc. Chem. Res., 2008, 41, 1578–1586 CrossRef CAS PubMed.
- D. L. Jeanmaire and R. P. Van Duyne, J. Electroanal. Chem., 1977, 84, 1–20 CrossRef CAS.
- R. M. Stöckle, Y. D. Suh, V. Deckert and R. Zenobi, Chem. Phys. Lett., 2000, 318, 131–136 CrossRef.
- T. Deckert-Gaudig, A. Taguchi, S. Kawata and V. Deckert, Chem. Soc. Rev., 2017, 46, 4077–4110 RSC.
- M. F. Cardinal, E. V. Ende, R. A. Hackler, M. O. McAnally, P. C. Stair, G. C. Schatz and R. P. Van Duyne, Chem. Soc. Rev., 2017, 46, 3886–3903 RSC.
- M. Richard-Lacroix, Y. Zhang, Z. Dong and V. Deckert, Chem. Soc. Rev., 2017, 46, 3922–3944 RSC.
- S. Chaunchaiyakul, A. Setiadi, P. Krukowski, F. C. I. Catalan, M. Akai-Kasaya, A. Saito, N. Hayazawa, Y. Kim, H. Osuga and Y. Kuwahara, J. Phys. Chem. C, 2017, 121, 18162–18168 CrossRef CAS.
- P. Singh and V. Deckert, Chem. Commun., 2014, 50, 11204–11207 RSC.
- J. A. Baldwin, B. Vlcková, M. P. Andrews and I. S. Butler, Langmuir, 1997, 13, 3744–3751 CrossRef CAS.
- W. Zhang, T. Schmid, B. S. Yeo and R. Zenobi, Isr. J. Chem., 2007, 47, 177–184 CrossRef CAS.
- Y. S. Pang, H. J. Hwang and M. S. Kim, J. Mol. Struct., 1998, 441, 63–76 CrossRef CAS.
- M. Takahashi, M. Fujita and M. Ito, Surf. Sci., 1985, 158, 307–313 CrossRef CAS.
- W. H. Do, C. J. Lee, D. Y. Kim and M. J. Jung, J. Ind. Eng. Chem., 2012, 18, 2141–2146 CrossRef CAS.
- A. Rasmussen and V. Deckert, J. Raman Spectrosc., 2006, 37, 311–317 CrossRef CAS.
- T. Deckert-Gaudig and V. Deckert, Small, 2009, 5, 432–436 CrossRef CAS PubMed.
- F. C. Grozema, Y. A. Berlin, L. D. A. Siebbeles and M. A. Ratner, J. Phys. Chem. B, 2010, 114, 14564–14571 CrossRef CAS PubMed.
- C. B. George, I. Szleifer and M. A. Ratner, Chem. Phys., 2010, 375, 503–507 CrossRef CAS.
- N. Behr and M. B. Raschke, J. Phys. Chem. C, 2008, 112, 3766–3773 CrossRef CAS.
- T. Yano, T. Ichimura, A. Taguchi, N. Hayazawa, P. Verma, Y. Inouye and S. Kawata, Appl. Phys. Lett., 2007, 91, 121101 CrossRef.
- M. Futamata, Y. Maruyama and M. Ishikawa, J. Phys. Chem. B, 2003, 107, 7607–7617 CrossRef CAS.
- R. M. Roth, N. C. Panoiu, M. M. Adams, R. M. Osgood, C. C. Neacsu and M. B. Raschke, Opt. Express, 2006, 14, 2921–2931 CrossRef PubMed.
- K. J. Savage, M. M. Hawkeye, R. Esteban, A. G. Andrei, G. Borisov, J. Aizpurua and J. J. Baumberg, Nature, 2012, 491, 574–577 CrossRef CAS PubMed.
- Z. Zhang, M. Sun, P. Ruan, H. Zheng and H. Xu, Nanoscale, 2013, 5, 4151–4155 RSC.
| This journal is © The Royal Society of Chemistry 2020 |

