Ultrasensitive electrochemical DNA biosensor based on a tetrahedral structure and proximity-dependent surface hybridization†
Xuejiao
Wang
a,
Shuyan
Niu
a,
Manman
Wei
a,
Shuai
Liu
a,
Rui
Liu
a,
Chao
Shi
 b and
Cuiping
Ma
 *a
*a
aShandong Provincial Key Laboratory of Biochemical Engineering, Key Laboratory of Sensor Analysis of Tumor Marker, Ministry of Education, Shandong Key Laboratory of Biochemical Analysis, College of Chemistry and Molecular Engineering, College of Marine Science and Biological Engineering, Qingdao University of Science and Technology, Qingdao 266042, PR China. E-mail: mcp169@163.com
bCollege of Life Sciences, Qingdao University, Qingdao 266071, PR China
First published on 28th October 2019
Abstract
The DNA tetrahedron has developed a broad spectrum of applications in biosensor construction thanks to its excellent mechanical rigidity and structural stability. However, how to construct a highly sensitive biosensor using a DNA tetrahedron is still a challenge. In this work, an ultrasensitive electrochemical biosensor based on a DNA tetrahedral nanostructure was developed with the help of synergy from proximity-dependent hybridization. To decrease the steric hindrance of DNA tetrahedra to proximity-dependent hybridization, the detection signal was set on the inclined side chain structure of a DNA tetrahedral sensing system. Additionally, when the target hybridized with the DNA probe, the ferrocene (Fc) labeled on the end of the DNA probe was driven close to the surface of the biosensor, providing a sensitive faradaic current. The experimental results exhibited a good linear relationship from 1 fM to 10 pM with a linear correlation coefficient of 0.9977, and a high sensitivity with a detection limit of 0.2 fM. Our DNA biosensor also showed good stability according to electrode characterization and target detection at different time scales and the anti-jamming capabilities in a complicated biological extraction environment were excellent. The electrochemical sensing system established here has greatly improved the detection sensitivity of a DNA biosensor based on a DNA tetrahedron, which will further promote its practical applications.
1. Introduction
Nucleic acids, as the most basic biomolecules, play various paramount roles in a wide range of biological processes.1,2 In this case, many nucleic acid detection technologies have been developed to reveal the mysteries of life, such as the traditional sequencing technique,3 real-time polymerase chain reaction (RT-RCR),4–7 and isothermal amplification technologies,8–14 and so on.15,16 Among all these methods, the inexpensive, rapid and miniaturized detection devices used in the electrochemical method ensure it a promising candidate, and endow it with exciting opportunities to explore.17–20During the process of electrochemical research, the perpendicular orientation of the DNA strand must be maintained for efficient hybridization. While controlling the surface density and orientation of capture probes remains a big challenge for the development of electrochemical biosensors, especially for single strand DNA capture probes.21–23 Thanks to the stability of Watson–Crick base pairing, DNA nanofabrication can be used to establish highly controlled and precise programmable geometries, which have been widely adapted for solving the orientation difficulty. Research into and application of tetrahedral DNA nanostructures (TDNs) has attracted a great deal of attention24,25 and of all the DNA nanostructures, TDNs have exhibited an excellent mechanical rigidity and can greatly improve the sensitivity of a biosensor.26 Early in 2008, Goodman et al.27 proved the simple synthesis of TDNs and also verified the structural stability of their triangulated architecture. Thanks to the advantages of TDNs, many sensors based on them have been developed. Liu et al.28 reported a framework nucleic acid (FNA)-programmed strategy, which was utilized to develop valence-controlled signal amplifiers, and the team demonstrated that a framework nucleic acid (FNA)-programmed strategy could achieve the ultrasensitive detection of cfDNA with a sensitivity enhancement of 3–5 orders. An electrochemical biosensor combining hybridization chain reaction (HCR) amplification with tetrahedral DNA nanostructure was established by Ge et al.24 The three-dimensional tetrahedral DNA nanostructure helped to increase the reactivity and accessibility of the biosensor. In addition, Li et al.29 proved much higher phase-transfer efficiency using aptamer-dependent DNA tetrahedron nanostructures than that achieved using single-stranded DNA.
Labeled electrochemical-DNA (E-DNA) biosensors exhibited higher sensitivity compared with label-free E-DNA biosensors. And various sensor tags have been developed for nucleic acid detection. Of all the sensor tags, ferrocene (Fc) has been considered the best, owing to its REDOX reversibility and universality.30 The Fc, when it is driven to the surface of the electrode after DNA hybridization, can generate the strongest Faraday current signal. Previously, TDNs were used as a scaffold with the capture probe set on the top of the TDNs.31 They investigated the kinetics and thermodynamics of DNA hybridization with different sizes of TDNs and the optimized lowest detection limit was 1 fM. Nevertheless, due to the signal molecules being obstructed by the tetrahedral structure, the hybrid signal molecules could not get close to the electrode surface, which negatively affected the signal output. Thus, it is critical both to keep the advantages of a tetrahedral structure and to keep the signal molecules close to the surface of the electrode to achieve the best performance of the electrochemical sensor.
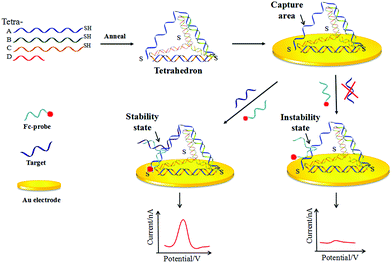
A proximity ligation assay depends on the simultaneous recognition of one target by two affinity signal probes which can ensure the signal probe are in close proximity to hybridize. It has great advantages in enhancing the signal, and has been successfully used for the detection of different targets, such as protein detection32 and nucleic acid detection.33 Therefore, in the present work, an ultrasensitive electrochemical DNA biosensor based on a tetrahedron-structure and proximity-dependent surface hybridization was developed (Fig. 1). Compared to other DNA biosensors based on TDNs,34,35 here the signal identification mechanism was designed on the hypotenuse of a tetrahedron, which ensured that the hybridization process can drive the molecular signal close to the electrode surface. In addition, TDNs served as a rigid scaffold, guaranteeing the fixed orientation of the capture area and getting rid of the use of 6-mercapto-1-hexanol (MCH) which was time-saving and provided a stable structure for hybridization. The biosensor established here was proved to be stable and sensitive. And more than that, our method successfully achieved the detection of an actual simulated sample.
2. Experimental
2.1 Chemicals and materials
The nucleic acid sequences used in this study were all synthesized and purified by Sangon Biotech (Shanghai, China). The DNA sequences are listed in Table S1.† The nucleic acid extraction reagent was purchased from Navid Biotechnology Co., Ltd (Qingdao, China). Potassium ferricyanide (K3Fe(CN)6) and potassium ferricyanide trihydrate (K4Fe(CN)6·3H2O) were obtained from Sinopharm Chemical Reagent Co., Ltd (Jinan, china). Tris (2-carboxyethyl) phosphine hydrochloride (TCEP), RNase-free water, KCl, NaCl, DNA loading buffer (6×), DNA marker (20 bp) and ethidium bromide were purchased from Sigma. All other chemicals were of at least analytical grade and were used without additional purification.In addition, the buffer solutions used in this study were prepared with RNase-free water according to a previous report.32 The buffers for TDN assembly and TDN hybridization were TM buffer (Tris, MgCl2·6H2O, pH 8.0) and TE buffer (Tris, EDTA·2H2O, NaCl, pH 7.4), respectively.
2.2 Formation of tetrahedron-structured DNA
TDNs were synthesized according to a modification of a previous method.36 First, the four DNA strands used for TDN assembly were all diluted to 1.0 × 10⁻⁵ M with TM buffer. Then 40 μL of each of them (Tetra-(A + B), Tetra-(B + D), Tetra-(B + C + D), Tetra-(A + C + D), Tetra-(A + B + D), Tetra-(A + B + C), Tetra-(A + B + C + D)) were mixed with the same amount of substance. The mixtures were heated at 95 °C for 10 min and then cooled to 4 °C for 20 min. The resulting mixtures were analyzed by 12.5% polyacryamide gel electrophoresis (PAGE) in TAE buffer solution (Fig. S1†). The Tetra-(A + B + C + D) mixture was inactivated using 10 mM TCEP and stored at 4 °C for further use.2.3 Preparation of sensing substrate
Gold electrodes (CHI101, CH Instruments Inc.) were cleaned in piranha solution (1 mL with 30% H2O2 and 70% H2SO4) for 1 h and polished with a motor sander (GU-100) for 3 min each, then ultrasonically rinsed for 5 min with ethanol and deionized water, respectively, and finally dried with nitrogen. The electrodes were further treated electrochemically in a real-time prepared 0.5 M H2SO4 solution. Finally, the electrodes were rinsed with water and dried under a stream of nitrogen.2.4 Establishment of the tetrahedron-structured DNA-based biosensing surface
For the surface construction of the biosensor, 50 μL of TDNs (0.1 μM) in a hybridization buffer solution was hybridized onto the surface of the gold electrode at 4 °C overnight. And thanks to a thiol group at the 5′ ends of Tetra-B, Tetra-C and Tetra-D, the TDN molecules were successfully anchored on the surface of the gold electrodes via specific Au–S bonding. The established biosensor was thoroughly rinsed with TE buffer and blow-dried with nitrogen. All the electrochemical detections were performed in a measurement buffer solution (10 mM phosphate buffer (PB) containing 0.1 M NaCl, pH 7.40). The hybridization was performed by mixing the target and the signal probe together with the TDNs on the electrode for 2 h at the 52 °C.2.5 Electrochemical measurement
Cyclic voltammetry (CV), differential pulse voltammetry (DPV) and electrochemical impedance spectroscopy (EIS) were performed with an electrochemical workstation (CHI600E, CH Instruments Inc.). The three-electrode system consisting of a gold working electrode, an Ag/AgCl (3 M KCl) reference electrode and a platinum wire auxiliary electrode was used. CV was carried out at a scan rate of 100 mV s−1. DPV was scanned from 0 to 5 V. In addition, error bars showed standard deviations of three individual tests and the corresponding background signal was subtracted from all the DPV signals.3. Results and discussion
3.1 Scheme of the TDN biosensor
A schematic of the established biosensor is shown in Fig. 1. In the capture probe formulation process, the previous method33 was used as reference for the design of the capture area. Three strands of a tetrahedron were divided into three different areas that were complementary with others, except for Tetra-A which was divided into only two areas. Thus after the tetrahedron was formed, a single area of Tetra-C was set for DNA detection (Table S1, ESI†). The second part was for proximity-dependent surface hybridization. When the target DNA was introduced into the system, relying on the simultaneity principle a stable duplex complex was formed by the complementary of the target and the 5′ Fc labeled probe at one-half-segment, and the complementary of the target and the 3′ TDNs capture probe at another-half-segment. Thus after hybridization, the Fc signal was driven close to the Au electrode and then a strong current signal was observed. In the absence of the target, the complementary of the Fc-probe and TDNs was in an instability stage which ensures a low background signal.3.2 The feasibility of the method
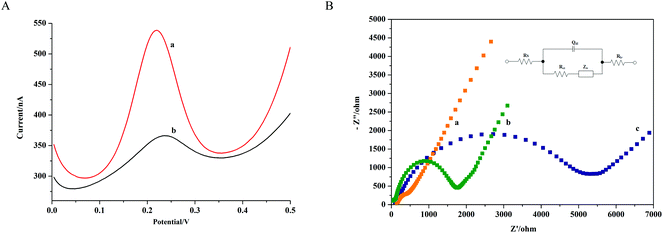
Firstly, the successful construction of the TDNs was proved with the different migration rates of different DNA nanostructures by 12.5% polyacrylamide gel electrophoresis (PAGE). It is known that the migration rate of DNA in PAGE is differentiated by the complexity of the DNA nanostructures. It can be seen in Fig. S1† that the double strand system in lane 5 and lane 6 had a lower migration rate than the single strand in lanes 1–4, and at the same time, the third strand system in lane 7–10 had a lower migration rate than the double strand system, while the four strand system in lane 11 had the lowest migration rate. As long as the structures in lane 11 contained all four strands and had the lowest migration rate, we could draw the conclusion that the DNA tetrahedron in lane 11 was successfully synthesized. Besides, because the nanostructures were not activated by Tris (2-carboxyethyl) phosphine (TCEP) to break the S–S bonds, thus resulted into many bands in Fig. S1.† To further prove that the multiple bands were caused by S–S bonds, we compared the single strand Tetra-A, B, C, D (Tetra-B, C, D were all modified with –SH) with and without using TCEP. It can be seen from Fig. S2† that Tetra-A with and without treatment by TCEP were both at the same position thanks to lack of modification by the sulfhydryl group. Untreated Tetra-B, C, D strands have multiple bands in the same position as Fig. S1.† While after treatment with TCEP, there was only one band left. The result verified that it was the formulation of S–S bonds that resulted in the multiple bands. Also, the surface stability of the TDNs biosensor was tested by scanning the CV, as illustrated in Fig. S3;† after 50 cycles, the biosensor retained a good surface stability. These results demonstrated that the biosensor provided here was easily established and had a good surface stability, showing its promise as a base for further DNA detection.Secondly, to show the feasibility of detection performance with the proposed biosensor, a differential pulse voltammetry test was carried out. 1 pM synthetic DNA sequence was analyzed as a model target. Without the presence of a target, complementarity between TDNs and the Fc-probe was difficult. The Fc could barely contact the Au electrode, which gave rise to a low signal. After the hybridization performance, the Fc was brought close to the surface of the Au electrode, which resulted in a strong electrochemical signal. Thus the signal improvement was used to prove the successful detection of the DNA target. In Fig. 2A, it is shown that the peak current of the TDN biosensor (Fig. 2A, curve b) was obviously enhanced compared to the peak current before hybridization (Fig. 2A, curve a). The difference in the signals successfully verified the feasibility of the provided biosensor for target detection. To further verify that the hybridization happened between the capture probe with the Fc-probe and the target, an additional 12.5% native PAGE experiment is also provided in Fig. S4.† By observing lane 10, the migration rate of the hybrid of TDNs, Fc-probe and the target was slower than that of ssDNA and TDNs alone or TDNs incubated with a probe alone. And we could not see any new bands except for the TDNs in Fig. S4.† The native PAGE result also verified the successful application of the established biosensor for target detection.
Furthermore, electrochemical impedance spectroscopy (EIS) is considered an effective way to characterize the features of a designed biosensor step by step. Thus, EIS was carried out to study the gold electrodes modified by different procedures. The bare Au electrode served as an ideal conductor with the impedance plot exhibiting an almost straight line (Fig. 2B, curve a). The impedance of curve b in Fig. 2B obviously increased, which gave positive evidence for the successful self-modification of the TDNs capture probe. After the hybridization, thanks to the surface confinement of the Fc labels, electron transfer became more difficult, resulting in negative charge enhancement on the Au electrode surface. Thus the decrease in curve c compared to curve b can be seen in Fig. 2B, which verifies the feasibility of the established biosensor. The insert in Fig. 2B is the equivalent circuit which was used to fit the EIS results.
3.3 Sensitivity and stability
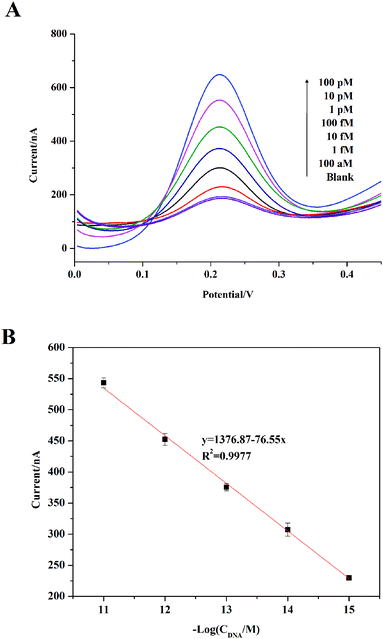
For the purpose of achieving a favorable performance, experimental conditions were investigated (Fig. S5, ESI†). As shown in Fig. S3A,† different concentrations of Fc-probe (0.1, 1, 2, 5 μM) were incubated with the constructed DNA biosensor. It can be seen that a gradual increase in current was observed for the lower concentrations of Fc-probe (from 0.1 μM to 1 μM). A decrease for values higher than 1 μM was observed. This suggested that high concentrations of Fc-probe hindered the process of the hybridization of the target. In view of these results, an Fc-probe concentration of 1 μM was selected for further study. Another parameter affecting the hybridization is the DNA hybridization time. In order to achieve the most efficient hybridization, various times (1, 2, 3 h) for hybridization were tested (Fig. S3B†). 2 h hybridization time achieved the best signal performance, and a decrease was observed when the time was prolonged to 3 h. The electrochemical data indicated that a DNA hybridization time of 2 h was the optimum for our biosensor system.Based on the optimized experimental conditions, the sensitivity of the designed sensor was examined by testing different concentrations of the target. As shown in Fig. 3A, all the signals of different concentrations tested here were higher than the background signal. And with an increase in target concentration, the fluorescent signal increased gradually. In addition, DPV responses increased with an increase in analyte concentration. The results showed a favorable linear range of 1 fM to 10 pM with a linear correlation coefficient of 0.9977 (S/N = 3) (Fig. 3B). Compared to the previous study reported by Zhang et al.37 in which the detection limit was 1 fM, the detection limit of the proposed strategy has increased 5-fold by introducing the tetrahedron as a scaffold and the detection limit here is 0.2 fM. In addition, the strategy proposed here exhibits a higher sensitivity than the method reported by Zuo et al.31 based on a DNA tetrahedron for nucleic acid detection, where the lowest detection limit for DNA detection was 1 fM. Therefore, the established TS-DNA-based sensor exhibits excellent sensitivity. These advantages endow the developed method with sensitivity for nucleic acid detection.
Furthermore, many electrochemical biosensors for nucleic acid detection have been developed based on enzymes, which increases the testing cost, or on nucleic acid amplification, which could easily result in cross contamination, such as those developed by Dong et al.38 who reported a strategy adopting avidin-horseradish peroxidase (HRP), and Miao et al.39 who developed a biosensor through rolling circle amplification. While the method here relies solely on DNA hybridization and achieves the highly sensitive detection of a DNA target, cross contamination is avoided thanks to the freedom from any use of nucleic acid amplification steps.
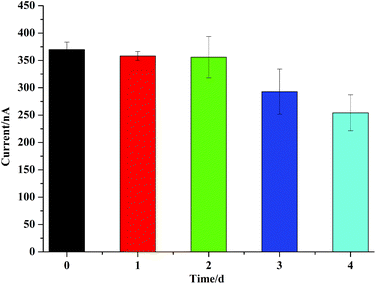
The stability of the developed biosensor for target detection was also studied by using the established TDNs biosensor stored at 4 °C for different numbers of days. 10 pM DNA was used as the target for each test. It can be seen from Fig. 4, that with two days’ storage, the TDNs biosensor retained nearly the same surface activity as the freshly prepared TDNs biosensor. On the third day, a 17.14% decrease in peak current was observed compared to the fresh TDNs biosensor. It is worth mentioning that after four days’ storage at 4 °C, the biosensor still maintained good stability when detecting a 10 pM DNA target even though there was a 13.78% decrease compared to the third day. The successful detection of the DNA target using a TDN biosensor stored for 4 days indicated that the method here was capable of practical use.
3.4 The application under biological environment
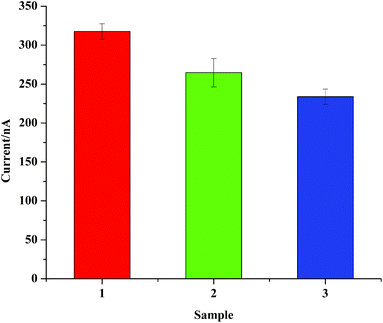
To validate the applicability of the proposed assay, the detection of DNA based on the TDNs biosensor capture probe was carried out in a simulated complex biological environment. It is worth mentioning that in the process of real sample detection, unknown factors in the environment have a great impact. In many previous studies, the practicality test relied on the verification of bovine serum.40,41 Herein, both bovine serum and a fresh extract from Lis-tria monocytogenes which are closer to the actual detection of samples were used as analytes. Sample 1 took a 10 pM synthetic sequence as the target. While sample 2 contained a 10 pM target in 20 μL bovine serum and sample 3 contained a 10 pM target in 20 μL Listeria monocytogenes extraction solution. As can be seen from Fig. 5, the proposed biosensor had a 16.67% decrease in the bovine serum environment and a 31.8% decrease in the biological environment compared with sample 1. The signal's attenuation ratio in bovine serum and in the reaction buffer condition was within 1/6. And when the target was detected in the clinical biological environment, a 2/3 signal was successfully obtained. The results indicated that the proposed biosensor could realize DNA detection even in a complicated biological environment, making it a promising strategy for clinical biological applications.4. Conclusions
A new combination of proximity-depended surface hybridization and DNA tetrahedral nanostructure was proposed and successfully utilized for the detection of a DNA target. The use of a TDN scaffold not only ensured the orientation of the detection probe, but also offered more stable conditions for the detection process. Likewise, the easy synthesis of the TDNs ensures the good reproducibility of our biosensor. Given the advantages of TDNs, by combining them with proximity-dependent surface hybridization, the biosensor achieved a fantastic DNA detection performance. More significantly, the sensitivity in our assay was greatly improved with a detection limit of 0.2 fM. On the other hand, by using a freshly extracted solution from L. monocytogenes, an environment close to a complicated biological and chemical environment was established. The results show that our method was able to achieve target detection even under complex extraction conditions. Therefore, this method is expected to become a powerful tool for nucleic acid detection and hence have great capacity in biological analysis.Conflicts of interest
There are no conflicts to declare.Acknowledgements
The work was supported by the Shandong Province Natural Science Fund Major Basic Research Project (ZR2017ZC0123) and the National Natural Science Foundation of China (31670868, 21675094, 51808304).Notes and references
- R. E. Jason, B. Israel and R. W. David, Anal. Chim. Acta, 2002, 469, 3–36 CrossRef.
- J. Wang, Anal. Chim. Acta, 2002, 469, 63–71 CrossRef CAS.
- T. Sampson, C. Ogugbue and G. Okpokwasili, J. Adv. Microbiol., 2018, 11, 1–18 CrossRef.
- Y. Yu, C. Lee, J. Kim and S. Hwang, Biotechnol. Bioeng., 2005, 89, 670–679 CrossRef CAS.
- N. R. Beer, J. H. Benjamin, K. W. Elizabeth, B. H. Sara, A. R. Klint, M. K. Ian and W. C. Bill, Anal. Chem., 2007, 79, 8471–8475 CrossRef CAS.
- H. L. D. Ronald, A. C. F. Deprez, M. R. Jan and F. M. M. Antoon, Anal. Biochem., 2002, 307, 63–69 CrossRef.
- C. Ma, D. Han, M. Deng, J. Wang and C. Shi, Chem. Commun., 2015, 51, 553–556 RSC.
- C. Ma, S. Liu and C. Shi, Biosens. Bioelectron., 2014, 58, 57–60 CrossRef CAS.
- F. Ma, M. Liu, B. Tang and C. Y. Zhang, Anal. Chem., 2017, 89, 6182–6187 CrossRef CAS.
- T. D. Rane, L. Chen, H. C. Zec and T. H. Wang, Lab Chip, 2015, 15, 776–782 RSC.
- C. Shi, F. Shang, M. Zhou, P. Zhang, Y. Wang and C. Ma, Chem. Commun., 2016, 52, 11551–11554 RSC.
- F. X. Wang, D. Y. Yuan, Y. N. Jin, L. Hu, Z. Y. Sun, Q. He, S. H. Zhao, S. B. Zhan and Y. J. Wen, Sci. Rep., 2016, 6, 24702–24708 CrossRef CAS.
- C. Shi, Q. Liu, C. Ma and W. Zhong, Anal. Chem., 2014, 86, 336–339 CrossRef CAS PubMed.
- C. Ma, H. Jing, P. Zhang, L. Han, M. Zhang, F. Wang, S. Niu and C. Shi, Chem. Commun., 2018, 02, 42–59 Search PubMed.
- K. Zhu, J. Chi, D. Zhang, B. Ma, X. Dong, J. Yang, C. Zhao and H. Liu, Analyst, 2019, 144(18), 5413–5419 RSC.
- R. Narayanan, P. Basuri, S. K. Jana, A. Mahendranath, S. Bosea and T. Pradeep, Analyst, 2019, 144(18), 5404–5412 RSC.
- J. Y. Chen, Z. J. Liu, X. W. Wang, C. L. Ye, Y. J. Zheng, H. P. Peng, G. X. Zhong, A. L. Liu, W. Chen and X. H. Lin, Anal. Chem., 2019, 91, 4552–4558 CrossRef CAS.
- S. Dutta, A. D. Chowdhury, S. Biswas, E. Y. Park, N. Agnihotri, A. De and S. De, Biochem. Eng. J., 2018, 140, 130–139 CrossRef CAS.
- H. A. M. Faria and V. Zucolotto, Biosens. Bioelectron., 2019, 131, 149–155 CrossRef CAS.
- H. Sun, Y. Qiu, Q. Liu, Q. Wang, Y. Huang, D. Wen, X. Zhang, Q. Liu, G. Liu and J. Kong, Biosens. Bioelectron., 2019, 131, 193–199 CrossRef CAS PubMed.
- X. Bin, E. H. Sargent and S. O. Kelley, Anal. Chem., 2010, 82, 5928–5931 CrossRef CAS.
- J. Fu, M. Liu, Y. Liu and H. Yan, Acc. Chem. Res., 2012, 45, 1215–1226 CrossRef CAS.
- J. Wu, S. Campuzano, C. Halford, D. A. Haake and J. Wang, Anal. Chem., 2010, 82, 8830–8837 CrossRef CAS.
- Z. Ge, M. Lin, P. Wang, H. Pei, J. Yan, J. Shi, Q. Huang and D. He, Anal. Chem., 2014, 86, 2124–2130 CrossRef CAS.
- X. Chen, J. Huang, S. Zhang, F. Mo, S. Su, Y. Li, L. Fang, J. Deng, H. Huang, Z. Luo and J. Zheng, ACS Appl. Mater. Interfaces, 2019, 11, 3745–3752 CrossRef CAS.
- N. Xie, S. Liu, X. Yang, X. He, J. Huang and K. Wang, Analyst, 2017, 142, 3322–3332 RSC.
- R. P. Goodman, M. Heilemann, S. Doose, C. M. Erben, A. N. Kapanidis and A. J. Turberfield, Nat. Nanotechnol., 2008, 3, 93–96 CrossRef CAS.
- Q. Liu, X. Mao, G. Zhou, X. Zuo, J. Shen, J. Shi, J. Li, L. Wang, X. Chen and C. Fan, Angew. Chem., Int. Ed., 2018, 130, 7249–7253 CrossRef.
- J. Li, C. Hong, S. Wu, H. Liang, L. Wang, G. Huang, X. Chen, H. Yang, D. Shangguan and W. Tan, J. Am. Chem. Soc., 2015, 137, 11210–11213 CrossRef CAS.
- A. Anne, A. Bouchardon and J. Moiroux, J. Am. Chem. Soc., 2003, 125, 1112–1113 CrossRef CAS.
- M. Lin, J. Wang, G. Zhou, J. Wang, N. Wu, J. Lu, J. Gao, X. Chen, J. Shi, X. Zuo and C. Fan, Angew. Chem., Int. Ed., 2015, 54, 2151–2155 CrossRef CAS.
- S. Fredriksson, M. Gullberg, J. Jarvius, C. Olsson, K. Pietras, S. M. Gústafsdóttir, A. Östman and U. Landegren, Nat. Biotechnol., 2002, 20, 473–477 CrossRef CAS.
- C. Sun, L. Zhang, J. hui, J. Guo, G. Shen and R. Yu, Biosens. Bioelectron., 2010, 25(11), 2483–2489 CrossRef CAS.
- H. Pei, N. Lu, Y. Wen, S. Song, Y. Liu, H. Yan and C. Fan, Adv. Mater., 2010, 22, 4754–4758 CrossRef CAS.
- M. Lin, Y. Wen, L. Li, H. Pei, G. Liu, H. Song, X. Zuo, C. Fan and Q. Huang, Anal. Chem., 2014, 86, 2285–2288 CrossRef CAS.
- R. P. Goodman, R. M. Berry and A. J. Turberfield, Chem. Commun., 2004, 12, 1372–1373 RSC.
- Y. L. Zhang, Z. Wang, H. Wang, J. Jiang, G. Shen, R. Yu and J. Li, Anal. Chem., 2009, 81, 1982–1987 CrossRef CAS.
- S. B. Dong, R. Zhao, J. Zhu, X. Lu, Y. Li, S. Qiu, L. Jia, X. Jiao, S. Song, C. Fan, R. Hao and H. Song, ACS Appl. Mater. Interfaces, 2015, 7, 8834–8842 CrossRef CAS PubMed.
- P. Miao, B. Wang, F. Meng, J. Yin and Y. Tang, Bioconjugate Chem., 2015, 26, 602–607 CrossRef CAS.
- L. Liu, C. Song, Z. Zhang, J. Yang, L. Zhou, X. Zhang and G. Xie, Biosens. Bioelectron., 2015, 70, 351–357 CrossRef CAS PubMed.
- D. Zeng, Z. Wang, Z. Meng, P. Wang, L. San, W. Wang, A. Aldalbahi, L. Li, J. Shen and X. Mi, ACS Appl. Mater. Interfaces, 2017, 9, 24118–24125 CrossRef CAS PubMed.
Footnote |
| † Electronic supplementary information (ESI) available. See DOI: 10.1039/c9an01897b |
| This journal is © The Royal Society of Chemistry 2020 |

