 Open Access Article
Elucidation of the electron energy structure of TiO2(B) and anatase photocatalysts through analysis of electron trap density†
Haruki Nagakawa a,
Tsuyoshi Ochiai
 bc,
He Mad,
Changhua Wangd,
Xintong Zhang
 d,
Yang Shene,
Mai Takashima
 ef,
Bunsho Ohtani
 ef and
Morio Nagata
 *a
*a
aDepartment of Industrial Chemistry, Graduate School of Engineering, Tokyo University of Science, 12-1 Ichigayafunagawara-cho, Shinjuku-ku, Tokyo 162-0826, Japan. E-mail: nagata@ci.tus.ac.jp
bMaterials Analysis Group, Research and Development Department, Local Independent Administrative Agency, Kanagawa Institute of industrial Science and TEChnology (KISTEC), Kanagawa 213-0012, Japan
cPhotocatalysis International Research Center, Tokyo University of Science, Chiba 278-8510, Japan. E-mail: ochiai.tsuyoshi@gmail.com
dCenter for Advanced Optoelectronic Functional Materials Research, Key Laboratory of UV-Emitting Materials and Technology of Ministry of Education, Northeast Normal University, Changchun, 130024 China. E-mail: xtzhang@nenu.edu.cn
eGraduate School of Environmental Science, Hokkaido University, Sapporo 060-0810, Japan
fInstitute for Catalysis, Hokkaido University, Sapporo 001-0021, Japan. E-mail: ohtani@cat.hokudai.ac.jp; Fax: +81-11-706-9133
First published on 15th May 2020
Abstract
A clear understanding of the electron energy structure of TiO2(B)/anatase is needed to study the related catalytic reactions and design new composite photocatalysts. In this study, the electron energy structures of TiO2(B) and anatase were estimated by analyzing the energy-resolved distribution of electron traps measured by reversed double-beam photoacoustic spectroscopy. In the mixture of TiO2(B) and anatase, interfacial charge-transfer excitation from anatase to electron traps of TiO2(B) was suggested. By analyzing this for TiO2(B), the electron level with a relatively high density of states was found to be located ∼0.07 eV deeper than that for anatase. Furthermore, a similar electron energy structure was suggested for a composite photocatalyst having a mixed phase of TiO2(B) and anatase.
Introduction
In recent years, photocatalysis technology has been considered a promising solution to the problems of fossil fuel depletion and environmental pollution.1,2 Especially, titanium dioxide (TiO2) is widely applied in many fields3,4 because of its favorable characteristics such as low cost, stability, amphiphilicity, super hydrophilicity, and nontoxicity.5–7 To achieve highly efficient photocatalysis, many researchers have combined different phases of TiO2 such as anatase/rutile to form composites.8 So far, the conduction band bottom (CBB), the valence band top (VBT), and the band gap of photocatalysts are often estimated experimentally in order to infer the energy structure,9 which in turn is used to discuss the excitation process of photocatalysts and improve their activity by forming composites. However, the electron energy structure of those mixed phase photocatalysts is still largely ambiguous.We have previously reported the method of reversed double-beam photoacoustic spectroscopy (RDB-PAS)10–12 to measure the energy-resolved distribution of electron traps (ERDT) within oxide semiconductors. This technique enables analysis with higher energy resolution and detection of deeper electron traps than conventional photochemical methods.10 By using a more detailed ERDT information obtained by RDB-PAS, the electron energy structure of an anatase/rutile mixed phase photocatalyst could be discussed.13,14 In this study, we further apply the ERDT analysis to investigate the electron energy structure of mixed phase anatase/TiO2(B) mixture and composite photocatalyst.
TiO2(B) is a monoclinic metastable phase of TiO2. While there are fewer basic and applied studies of it than those of the anatase and rutile phases, it has attracted growing attention in recent years as a material for lithium ion batteries.15–17 In addition, TiO2(B) has been applied as a photocatalyst for hydrogen generation and pollutant decomposition. Especially, the TiO2(B)/anatase composite was reported to have higher photocatalytic activity than either of its components.18–21 Our research group had prepared anatase/TiO2(B) nanotubes with higher activity than the raw material of P25.21 In that paper, we used several characterization methods to estimate the band structure model of anatase/TiO2(B). However, there has been no report on the experimentally measured electron energy structure of TiO2(B)/anatase. Although the band structure and density of states (DOS) of TiO2(B) were theoretically calculated,22,23 the theoretical and actual experimental results often differ. Therefore, experimental evaluation of the detailed electron energy structure of TiO2(B) should be useful in not only designing highly efficient composite photocatalysts but also identifying the reaction mechanism and excitation process.
Experimental
Materials and synthesis
TiO2 nanotubes were synthesized by the same method in our previous research.21 TiO2 powder (Degussa P25, 8.46 g) was mixed with 80 mL of 10 M NaOH solution. The mixture was transferred into a Teflon-lined stainless steel autoclave and heated at 130 °C for 36 h. Afterwards, the autoclave was left to cool to room temperature. The intermediate product was collected and washed several times with deionized water, until the pH value of the solution was about 7. Then, 80 mL of 15 M KOH solution was added, and the mixture was reacted in the autoclave at 200 °C for 24 h. The system was cooled to 150 °C at a rate of 1 °C min−1 and held at 150 °C for 12 h. The autoclave was quenched to room temperature. The white product was collected, washed several times with deionized water, and neutralized using 0.1 M HCl solution. It was then washed again with deionized water in order to remove any remaining traces of NaCl and KCl. The obtained white product was filtered and dried at 70 °C for 4 h in air, and gently ground in a mortar. Finally, the powders were calcined in air at 350 °C, 450 °C, and 700 °C for 2 h. For brevity, these samples are labelled as NT350, NT450, and NT700, respectively.For comparison, two other TiO2 nanotube samples were prepared using the method reported by Brutti et al.17 TiO2(B) nanotubes were synthesized by adding anatase powder (6 g, Aldrich) to a 15 M solution of NaOH in distilled water (28 mL). The mixture was heated to 150 °C for 72 h in a 40 mL autoclave. After the hydrothermal reaction, the product was washed with 0.05 M HCl (aq), dried under vacuum at 80 °C, calcined at 350 °C and 700 °C for 2 h under dry air flow, and then stored under Ar. These samples are denoted as thick-NT350 (t-NT350) and thick-NT700 (t-NT700).
The phase composition of the samples was calculated from XRD measurements.21 NT350 was determined to be pure TiO2(B), whereas NT450 had a mixed phase of anatase and TiO2(B), and NT700 was pure anatase phase. The characterization of the prepared thick samples was conducted using X-ray diffraction (XRD; Cu Kα at a scan rate of 5° min−1, λ = 0.1542 Å, 40 kV, 100 mA, Rigaku D/max – 2500, Tokyo, Japan) and diffuse reflection spectroscopy (DRS; U-3900/3900H spectrophotometer, Hitachi High-Tech Science, Tokyo, Japan). XRD results (Fig. S1 and S2†) showed that t-NT350 was pure TiO2(B) phase (ICDD 046-1237), whereas t-NT700 was pure anatase phase (ICDD 21-1272). The CBB positions of these samples were calculated from UV-vis DRS measurements (Fig. S3 and S4†).
RDB-PAS measurement
The procedure for measuring the ERDT/CBB patterns was reported previously.10–12 A powder sample of 40–80 mg (depending on the apparent bulk density) was spread out as a 1.0 mm layer in a stainless steel sample holder with a glass bottom. The sample holder was placed in a laboratory-made RDB-PAS cell (the upper part was made of aluminum, and the bottom and light guide port parts were made of stainless steel) equipped with a microphone (MEMS, SWITCH SCIENCE) and a quartz window on the upper part.24For the RDB-PAS measurements, ambient-temperature nitrogen gas saturated with methanol was passed at ca. 30 mL min−1 through the loaded RDB-PAS cell, and then the cell was tightly closed. Methanol was used for scavenging positive holes left by the photoexcitation of valence band (VB) electrons to the electron traps (ETs). The RDB-PAS cell was placed in an acrylic box (Unico UN650F) under a nitrogen atmosphere. Two light beams were combined and introduced to the RDB-PAS cell using a UV quartz combiner light guide (Moritex MWS5-1000S-UV3). One beam was the probe light from a 625 nm light-emitting diode (LED; Luxeon LXHL-ND98), whose intensity was modulated at 35 Hz by a digital function generator (NF Corporation DF-1906). The other light beam was the wavelength-scanned continuous monochromatic light from a grating monochromator with a xenon lamp (Bunkokeiki, Tokyo, Japan). The photoacoustic signal was detected using a digital lock-in amplifier (NF Corporation LI5630) by scanning the continuous light from 650 to 300 nm with a 5 nm step. The standard waiting and acquisition times at each wavelength were 160 and 20 s, respectively. The observed signal intensity was plotted against the energy of the continuous light, and the RDB-PA spectrum was differentiated from the lower energy side to the higher energy side. The obtained value was converted to ET density in the unit of μmol g−1 eV−1 with the conversion coefficient. The thus-obtained ERDT was a function of energy from the VBT, and it was replotted in a bar graph with a pitch of 0.05 eV.
To compare the measured and simulated ERDT patterns, their similarity was quantified by the degree of coincidence in their shape (ζ(a)).10 For two ERDT spectra f(1) and f(2) (ERDT pattern profiles as a function of energy from the VBT; the integrated f is equal to the density of ETs (D), and D(1) < D(2)), ζ(a) was evaluated as
Detail of the summation simulation
In order to investigate the electron energy structure of anatase/TiO2(B), results from the summation simulation were compared with the measured ERDT pattern of the NT350/NT700 mixture. For preparation of the mixture of NT350 and NT700 powder samples, samples according to weight ratio were put in an agate mortar and were mixed with a pestle for 15 min. The simulation was performed by shifting the original ERDT pattern of NT350 to the lower energy side with a pitch of 0.01 eV to maximize ζ(a), and then ζ(a) with the mixture sample pattern was calculated.Results and discussion
Electron energy structure of TiO2(B)/anatase from ERDT patterns
The ERDT/CBB patterns of the prepared NT350 (TiO2(B) phase) and NT700 (anatase phase) are shown in Fig. 1. The total density of ETs in NT350 is higher than that in NT700, and the ETs in NT350 are distributed at higher energies (3.7 eV). While in previous studies the ETs were presumed to have a lower energy position than the CBB,22,25 in this case they were distributed around the CBB. This may be because the excitation to the ETs is not all from the VBT, but rather from the relatively high DOS states in the VB as previously reported.10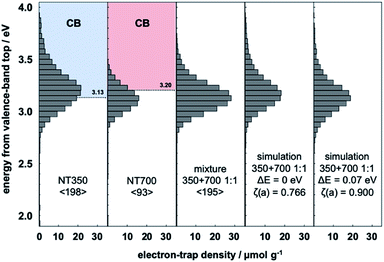 | ||
Fig. 1 Representative ERDT patterns of NT350, NT700, their 1![[thin space (1/6-em)]](https://www.rsc.org/images/entities/char_2009.gif) : :![[thin space (1/6-em)]](https://www.rsc.org/images/entities/char_2009.gif) 1 mixture, the simple summation simulation, and the simulation assuming a −0.07 eV shift of the VBT in NT350. 1 mixture, the simple summation simulation, and the simulation assuming a −0.07 eV shift of the VBT in NT350. | ||
In order to estimate the electron energy structures of TiO2(B) and anatase, the ERDT of a mixed sample of NT350 and NT700 was measured (Fig. 1). Moreover, Table 1 compares the measured pattern of the mixture with those from the summation simulation for NT350 and NT700. When the position of the NT350 VBT was shifted to the lower energy side by 0.01 eV, the ζ(a) value increased. A maximum ζ(a) value was obtained at ΔE = 0.07 eV, and then it decreased with further shifts. The simulated ERDT patterns at ΔE = 0 and 0.07 eV are shown in Fig. 1. At ΔE = 0.07 eV, the overall distribution was shifted to the low energy side, and the peak position matched the measured ERDT pattern of the mixture. The values of ζ(a) without and with the energy shift were 0.766 and 0.900, respectively, confirming that they have a very high degree of coincidence after a shift of 0.07 eV.
| Shifting energy/eV | Mixture (1![[thin space (1/6-em)]](https://www.rsc.org/images/entities/char_2009.gif) : :![[thin space (1/6-em)]](https://www.rsc.org/images/entities/char_2009.gif) 1) samples 1) samples |
|
|---|---|---|
| NT350 + NT700 | t-NT350 + t-NT700 | |
| 0 | 0.766 | 0.762 |
| 0.01 | 0.793 | 0.781 |
| 0.02 | 0.819 | 0.799 |
| 0.03 | 0.843 | 0.813 |
| 0.04 | 0.865 | 0.823 |
| 0.05 | 0.883 | 0.831 |
| 0.06 | 0.897 | 0.835 |
| 0.07 | 0.900 | 0.836 |
| 0.08 | 0.895 | 0.835 |
| 0.09 | 0.885 | 0.831 |
| 0.10 | 0.870 | 0.825 |
| 0.11 | 0.849 | 0.817 |
| 0.12 | 0.826 | 0.808 |
| 0.13 | 0.801 | 0.796 |
| 0.14 | 0.778 | 0.784 |
| 0.15 | 0.754 | 0.768 |
Similar analysis was performed for t-NT350 (TiO2(B) phase) and t-NT700 (anatase phase) fabricated by a different method. In Fig. 2, it is confirmed that the ERDT pattern of t-NT350 is distributed at a higher energy than that of t-NT700, similar to the trend observed in the NT samples. The relationship between the energy shift and ζ(a) value of the mixture and summation simulation results are listed in Table 1. The value of ζ(a) has an identical trend to that in the NT samples: the maximum value was obtained at ΔE = 0.07. The ERDT patterns obtained from the mixture of t-NT350 and t-NT700 and the corresponding simulation results at ΔE = 0 and 0.07 eV are shown in Fig. 2. With a VBT shift of 0.07 eV, the positions of maximum ζ(a) for the mixture and simulation are similar, and so are the ERDT patterns. While ζ(a) = 0.762 from the simple summation result, it increased to 0.836 at ΔE = 0.07 eV.
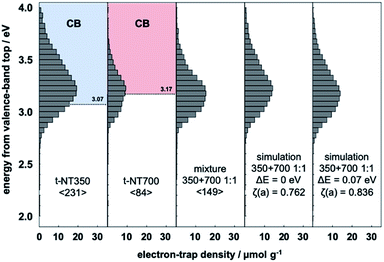 | ||
Fig. 2 Representative ERDT patterns of t-NT350, t-NT700, their 1![[thin space (1/6-em)]](https://www.rsc.org/images/entities/char_2009.gif) : :![[thin space (1/6-em)]](https://www.rsc.org/images/entities/char_2009.gif) 1 mixture, the simple summation simulation, and the simulation assuming a −0.07 eV shift of the VBT in NT350. 1 mixture, the simple summation simulation, and the simulation assuming a −0.07 eV shift of the VBT in NT350. | ||
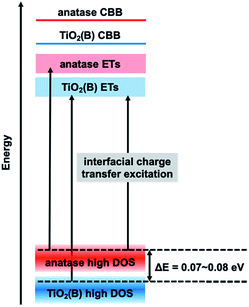
In the mixture, if excitation occurs from the VBT to ETs in each phase particle, the ERDT pattern of the mixture should match the simple summation result since it uses energy from each VBT. Why does the energy shift described above occur in the simulation? This is considered to be due to the interfacial charge-transfer excitation between TiO2(B) and anatase. In our previous study, the energy shift obtained by simulation suggested that interfacial charge-transfer excitation occurs between anatase and rutile13 and will be reported using various anatase–rutile mixtures in detail.14 In the RDB-PAS measurement, since the excitation light was changed from a long wavelength to a short wavelength, electrons first occupied the low-energy ETs. Therefore, when excitation occurs from the high DOS level of the rutile sample with higher energy to the ETs of the anatase sample with lower energy levels, the obtained ERDT pattern is lower than when excitation occurs in each phase. From this phenomenon, it was confirmed that the high DOS level of rutile is about 0.2 eV higher than that of anatase. A schematic diagram of the relationship between the high DOS levels in the TiO2(B)/anatase combination here is shown in Fig. 3. In the electron energy structure of mixed phase TiO2(B)/anatase, interfacial charge-transfer excitation from the high DOS level of anatase to the ETs of TiO2(B) occurred first when the photocatalyst was irradiated at a long wavelength. Therefore, in the ERDT pattern of the mixture, the energy was shifted to lower than that required to excite to ETs from the high DOS level of TiO2(B). From the simulation results, it can be estimated that the high DOS level of anatase is 0.07 eV higher than that of TiO2(B), because the ζ(a) is maximized when the ERDT pattern of NT350 is shifted by −0.07 eV. This energy positional relationship shows the same tendency as that of VBT obtained in an earlier study and reinforces the previous theory.21
Validation of energy shift at different mixing ratios measured by ERDT
The interfacial charge-transfer excitation requires not only light absorption but also overlap between the bonding orbital and the ET orbital. Therefore, it requires that the TiO2(B) and anatase phases are thoroughly mixed in all particles. For isolated particles in the mixture, interfacial charge-transfer excitation does not occur, which would reduce the shift of the ERDT pattern. In order to correctly estimate the relative position of the high DOS level, the shift of the ERDT pattern was analyzed using NT350 and NT700 mixtures in different ratios.Fig. 4 shows the ERDT pattern and the result of summation simulation for a mixture of NT350![[thin space (1/6-em)]](https://www.rsc.org/images/entities/char_2009.gif) :
:![[thin space (1/6-em)]](https://www.rsc.org/images/entities/char_2009.gif) NT700 = 1
NT700 = 1![[thin space (1/6-em)]](https://www.rsc.org/images/entities/char_2009.gif) :
:![[thin space (1/6-em)]](https://www.rsc.org/images/entities/char_2009.gif) 3. The relationships between the energy shift and ζ(a) value of this mixture and the results from summation simulation are shown in Table S1.† The maximum value of ζ(a) was obtained at ΔE = 0.08 eV and showed almost the same tendency as the case of 1
3. The relationships between the energy shift and ζ(a) value of this mixture and the results from summation simulation are shown in Table S1.† The maximum value of ζ(a) was obtained at ΔE = 0.08 eV and showed almost the same tendency as the case of 1![[thin space (1/6-em)]](https://www.rsc.org/images/entities/char_2009.gif) :
:![[thin space (1/6-em)]](https://www.rsc.org/images/entities/char_2009.gif) 1 mix. The shifted ERDT pattern was consistent with that from the mixture in the peak position, and the value of ζ(a) was 0.907 (Fig. 4). On the other hand, when NT350 and NT700 were mixed at a ratio of 3
1 mix. The shifted ERDT pattern was consistent with that from the mixture in the peak position, and the value of ζ(a) was 0.907 (Fig. 4). On the other hand, when NT350 and NT700 were mixed at a ratio of 3![[thin space (1/6-em)]](https://www.rsc.org/images/entities/char_2009.gif) :
:![[thin space (1/6-em)]](https://www.rsc.org/images/entities/char_2009.gif) 1, the change of ζ(a) was different (Fig. 5 and Table S1†). The maximum value of ζ(a) was at ΔE = 0.03 eV, and the shift was smaller than those of the 1
1, the change of ζ(a) was different (Fig. 5 and Table S1†). The maximum value of ζ(a) was at ΔE = 0.03 eV, and the shift was smaller than those of the 1![[thin space (1/6-em)]](https://www.rsc.org/images/entities/char_2009.gif) :
:![[thin space (1/6-em)]](https://www.rsc.org/images/entities/char_2009.gif) 1 and 1
1 and 1![[thin space (1/6-em)]](https://www.rsc.org/images/entities/char_2009.gif) :
:![[thin space (1/6-em)]](https://www.rsc.org/images/entities/char_2009.gif) 3 mixtures. The likely reason for this is the different contact ratios on the surface of TiO2(B) and anatase particles. Our previous study21 showed that NT350 consists of entangled one-dimensional nanostructures and their diameters were ca. 10 nm. The t-NT350 also showed one-dimensional nanostructure and their diameters were ca. 15 nm.17 The length of these nanotubes ranged from several hundred nanometers to several micrometers, but the morphology of NT700 collapsed into small rods of several tens of nanometers. When there are more smaller particles (i.e., NT700) than the larger ones (NT350), the contact ratio between the two types of particles is high because the voids near the larger ones are filled. On the other hand, if there are more larger particles than the smaller ones, the mixture becomes more porous, and so the contact area between the two types of particles will decrease. Therefore, in the NT350
3 mixtures. The likely reason for this is the different contact ratios on the surface of TiO2(B) and anatase particles. Our previous study21 showed that NT350 consists of entangled one-dimensional nanostructures and their diameters were ca. 10 nm. The t-NT350 also showed one-dimensional nanostructure and their diameters were ca. 15 nm.17 The length of these nanotubes ranged from several hundred nanometers to several micrometers, but the morphology of NT700 collapsed into small rods of several tens of nanometers. When there are more smaller particles (i.e., NT700) than the larger ones (NT350), the contact ratio between the two types of particles is high because the voids near the larger ones are filled. On the other hand, if there are more larger particles than the smaller ones, the mixture becomes more porous, and so the contact area between the two types of particles will decrease. Therefore, in the NT350![[thin space (1/6-em)]](https://www.rsc.org/images/entities/char_2009.gif) :
:![[thin space (1/6-em)]](https://www.rsc.org/images/entities/char_2009.gif) NT700 = 1
NT700 = 1![[thin space (1/6-em)]](https://www.rsc.org/images/entities/char_2009.gif) :
:![[thin space (1/6-em)]](https://www.rsc.org/images/entities/char_2009.gif) 1 and 1
1 and 1![[thin space (1/6-em)]](https://www.rsc.org/images/entities/char_2009.gif) :
:![[thin space (1/6-em)]](https://www.rsc.org/images/entities/char_2009.gif) 3 mixtures, the shift value is large due to the large contact area between the two types of TiO2 particles, and the shift value is considered to be close to the actual energy difference between the high DOS levels of TiO2(B) and anatase. However, in the 3
3 mixtures, the shift value is large due to the large contact area between the two types of TiO2 particles, and the shift value is considered to be close to the actual energy difference between the high DOS levels of TiO2(B) and anatase. However, in the 3![[thin space (1/6-em)]](https://www.rsc.org/images/entities/char_2009.gif) :
:![[thin space (1/6-em)]](https://www.rsc.org/images/entities/char_2009.gif) 1 mixture, the contact area between TiO2(B) and anatase is small, the interfacial charge-transfer excitation is insufficient, and the energy shift is smaller.
1 mixture, the contact area between TiO2(B) and anatase is small, the interfacial charge-transfer excitation is insufficient, and the energy shift is smaller.
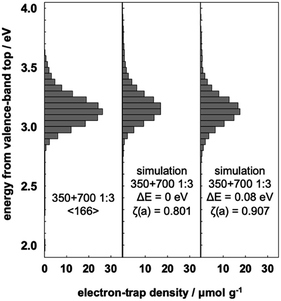 | ||
Fig. 4 Representative ERDT patterns of the 1![[thin space (1/6-em)]](https://www.rsc.org/images/entities/char_2009.gif) : :![[thin space (1/6-em)]](https://www.rsc.org/images/entities/char_2009.gif) 3 mixture of NT350 and NT700, simple summation simulation, and simulation assuming a −0.08 eV shift of the VBT in NT350. 3 mixture of NT350 and NT700, simple summation simulation, and simulation assuming a −0.08 eV shift of the VBT in NT350. | ||
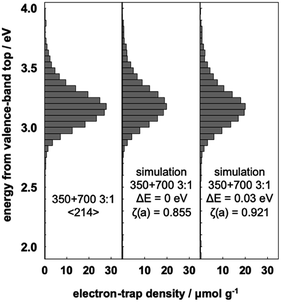 | ||
Fig. 5 Representative ERDT patterns of the 3![[thin space (1/6-em)]](https://www.rsc.org/images/entities/char_2009.gif) : :![[thin space (1/6-em)]](https://www.rsc.org/images/entities/char_2009.gif) 1 mixture of NT350 and NT700, simple summation simulation, and simulation assuming a −0.03 eV shift of the VBT in NT350. 1 mixture of NT350 and NT700, simple summation simulation, and simulation assuming a −0.03 eV shift of the VBT in NT350. | ||
Interfacial charge-transfer excitation in NT450
Previous research found that NT450 with mixed phases of TiO2(B) and anatase (ca. 1![[thin space (1/6-em)]](https://www.rsc.org/images/entities/char_2009.gif) :
:![[thin space (1/6-em)]](https://www.rsc.org/images/entities/char_2009.gif) 1) have an interface within the same nanotube and the highest photocatalytic activity.21 Does interfacial charge-transfer also occur in this system? Fig. 6 shows the ERDT patterns of NT450, mixed NT350 and NT700 (1
1) have an interface within the same nanotube and the highest photocatalytic activity.21 Does interfacial charge-transfer also occur in this system? Fig. 6 shows the ERDT patterns of NT450, mixed NT350 and NT700 (1![[thin space (1/6-em)]](https://www.rsc.org/images/entities/char_2009.gif) :
:![[thin space (1/6-em)]](https://www.rsc.org/images/entities/char_2009.gif) 1), and the simple summation simulation result. The NT450 sample and the NT350/NT700 mixture showed higher ζ(a) values than the simulation. This fact makes it impossible to prove that NT450 shows higher activity or that spatial electron transfer occurs between TiO2(B) and anatase. However, the NT450 powder may have an electron energy structure as shown in Fig. 3. In addition, interfacial charge-transfer excitation from the high DOS level of anatase to the ETs of TiO2(B) probably occurred in both the NT450 powder and the mixture. Furthermore, we hypothesize that when interfacial charge-transfer excitation occurs between two phases, there should be a contact for spatial charge transfer from the CB of anatase to the CB of TiO2(B).
1), and the simple summation simulation result. The NT450 sample and the NT350/NT700 mixture showed higher ζ(a) values than the simulation. This fact makes it impossible to prove that NT450 shows higher activity or that spatial electron transfer occurs between TiO2(B) and anatase. However, the NT450 powder may have an electron energy structure as shown in Fig. 3. In addition, interfacial charge-transfer excitation from the high DOS level of anatase to the ETs of TiO2(B) probably occurred in both the NT450 powder and the mixture. Furthermore, we hypothesize that when interfacial charge-transfer excitation occurs between two phases, there should be a contact for spatial charge transfer from the CB of anatase to the CB of TiO2(B).
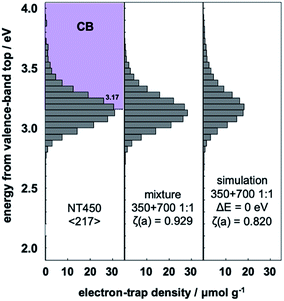 | ||
Fig. 6 Representative ERDT patterns of NT450, NT350 and NT700 in 1![[thin space (1/6-em)]](https://www.rsc.org/images/entities/char_2009.gif) : :![[thin space (1/6-em)]](https://www.rsc.org/images/entities/char_2009.gif) 1 mixture, and simple summation simulation of the mixture. 1 mixture, and simple summation simulation of the mixture. | ||
From all the above discussion, it was confirmed that the interfacial charge-transfer excitation between two kinds of oxide photocatalysts can be estimated by analyzing the ERDT patterns obtained by RDB-PAS. The electron energy structure of mixed phase TiO2 can be investigated by calculating the energy shift caused by the interfacial charge-transfer excitation. Furthermore, this technique is applicable to not only mixed photocatalysts but also the composite ones. Since the energy structure obtained by theoretical calculation often disagrees with that measured experimentally, this experimental method is expected to be useful for discussing the actual photocatalytic reaction.
Conclusions
In this study, the electron energy structures of TiO2(B) and anatase were estimated through analysis of ERDT measured by RDB-PAS. A comparison between the mixture of NT350 (TiO2(B) phase) and NT700 (anatase phase) with the summation simulation results suggested the existence of interfacial charge-transfer excitation from the high DOS level of anatase to the ETs of TiO2(B). Moreover, the shift value of the ERDT pattern obtained from simulation indicated that the high DOS level of anatase lies approximately 0.07 eV above that of TiO2(B). This is consistent with the information of VBT location obtained in previous studies.21 Moreover, the ERDT method is applicable to not only mixtures of two photocatalysts having different phases, but also composite photocatalysts having two types of phases, and the mixed phase and composite photocatalysts are presumed to have similar electron energy structures. The electron energy structure obtained in this study and the evidence for interfacial charge-transfer excitation can help researchers understand the detailed mechanism of photocatalytic reactions and construct highly active composite photocatalysts in the future.Conflicts of interest
There are no conflicts to declare.Acknowledgements
This study was supported by the Cooperative Research Program of Institute for Catalysis, Hokkaido University (Proposal#19B1010).References
- A. Fujishima and K. Honda, Nature, 1972, 238, 37–38 CrossRef CAS PubMed.
- H. Irie, S. Miura, K. Kamiya and K. Hashimoto, Chem. Phys. Lett., 2008, 457, 202–205 CrossRef CAS.
- A. Fujishima, T. N. Rao and D. A. Tryk, J. Photochem. Photobiol., C, 2000, 1, 1–21 CrossRef CAS.
- H. Chen, C. E. Nanayakkara and V. H. Grassian, Chem. Rev., 2012, 112, 5919–5948 CrossRef CAS PubMed.
- R. Wang, K. Hashimoto, A. Fujishima, M. Chikuni, E. Kojima, A. Kitamura, M. Shimohigoshi and T. Watanabe, Nature, 1997, 388, 431–432 CrossRef CAS.
- R. Wang, K. Hashimoto, A. Fujishima, M. Chikuni, E. Kojima, A. Kitamura, M. Shimohigoshi and T. Watanabe, Adv. Mater., 1998, 10, 135–138 CrossRef CAS.
- N. Sakai, R. Wang, A. Fujishima, T. Watanabe and K. Hashimoto, Langmuir, 1998, 14, 5918–5920 CrossRef CAS.
- T. Kawahara, Y. Konishi, H. Tada, N. Tohge, J. Nishi and S. Ito, Angew. Chem., Int. Ed., 2002, 41, 2811–2813 CrossRef CAS.
- D. O. Scanlon, C. W. Dunnill, J. Buckeridge, S. A. Shevlin, A. J. Logsdail, S. M. Woodley, C. R. A. Catlow, M. J. Powell, R. G. Palgrave, I. P. Parkin, G. W. Watson, T. W. Keal, P. Sherwood, A. Walsh and A. A. Sokol, Nat. Mater., 2013, 12, 798–801 CrossRef CAS PubMed.
- A. Nitta, M. Takase, M. Takashima, N. Murakami and B. Ohtani, Chem. Commun., 2016, 52, 12096–12099 RSC.
- A. Nitta, M. Takashima, M. Takase and B. Ohtani, Catal. Today, 2017, 52, 12096–12099 Search PubMed.
- A. Nitta, M. Takashima, N. Murakami, M. Takase and B. Ohtani, Electrochim. Acta, 2018, 264, 83–90 CrossRef CAS.
- B. Ohtani, Y. Shen, A. Nitta and M. Takashima, presented in part at, 235th ECS Meeting, Dallas, May, 2019 Search PubMed.
- Y. Shen, A. Nitta, M. Takashima and B. Ohtani, Chem. Commun. Search PubMed , submitted.
- M. Zukalová, M. Kalbác, L. Kavan, I. Exnar and M. Graetzel, Chem. Mater., 2005, 17, 1248–1255 CrossRef.
- Y. Cai, H. E. Wang, S. Z. Huang, J. Jin, C. Wang, Y. Yu, Y. Li and B. L. Su, Sci. Rep., 2015, 5, 11557 CrossRef CAS PubMed.
- S. Brutti, V. Gentili, H. Menard, B. Scrosati and P. G. Bruce, Adv. Energy Mater., 2012, 2, 322–327 CrossRef CAS.
- B. Liu, A. Khare and E. S. Aydil, ACS Appl. Mater. Interfaces, 2011, 3, 4444–4450 CrossRef CAS PubMed.
- W. Zhou, L. Gai, P. Hu, J. Cui, X. Liu, D. Wang, G. Li, H. Jiang, D. Liu, H. Liu and J. Wang, CrystEngComm, 2011, 13, 6643–6649 RSC.
- H. L. Kuo, C. Y. Kuo, C. H. Liu, J. H. Chao and C. H. Lin, Catal. Lett., 2007, 113, 7–12 CrossRef CAS.
- C. Wang, X. Zhang, Y. Wei, L. Kong, F. Chang, H. Zheng, L. Wu, J. Zhi and Y. Liu, Dalton Trans., 2015, 44, 13331–13339 RSC.
- K. L. Ming, Z. B. Lin, P. X. Yong and W. G. Chang, Acta Phys. Chim. Sin., 2016, 32, 656–664 Search PubMed.
- R. Asahi, Y. Taga, W. Mannstadt and A. J. Freeman, Phys. Rev. B: Condens. Matter Mater. Phys., 2000, 61, 7459–7465 CrossRef CAS.
- P. Unwiset, G. Chen, B. Ohtani and K. C. Chanapattharapol, Catalysts, 2019, 9, 1010 CrossRef CAS.
- A. Naldoni, M. Allieta, S. Santangelo, M. Marelli, F. Fabbri, S. Cappelli, C. L. Bianchi, R. Psaro and V. Santo, J. Am. Chem. Soc., 2012, 134, 7600–7603 CrossRef CAS PubMed.
Footnote |
| † Electronic supplementary information (ESI) available: X-ray diffraction patterns and diffuse reflection spectra of t-NT350 and t-NT700. See DOI: 10.1039/d0ra02587a |
| This journal is © The Royal Society of Chemistry 2020 |


