 Open Access Article
An LC-MS/MS analysis of opiate residues on Thomas Chatterton's (1752–1770) memorandum book – Did he die from a laudanum overdose?†
Paul J.
Gates
 *a and
Michael L.
Doble
b
aSchool of Chemistry, University of Bristol, Cantock's Close, Bristol, BS8 1TS, UK. E-mail: paul.gates@bristol.ac.uk
bChairman, The Thomas Chatterton Society, St. Paul's Road, Bristol, BS8 1LP, UK
First published on 13th October 2020
Abstract
250 years after his death, Thomas Chatterton continues to create discussion amongst the literati and enchant the people of Bristol. The controversy of his life was entwinned with his writings where he passed his work off as that of a fictional medieval poet – Thomas Rowley. His premature death at the age of 17 in 1770 is also shrouded in controversy – did he commit suicide from arsenic poisoning (as stated at the original inquest into his death), or did he accidentally overdose on laudanum (as suggested by the 1947 forensic analysis)? The purpose of this study is to use state-of-art analytical methods (namely ultra-high-performance liquid chromatography tandem mass spectrometry using an Orbitrap mass spectrometer) to investigate the brown stain found on his memorandum book. The conclusion of this study is that that stain is made up of, amongst other things, 18 opiate and 1 opioid degradation product – 9 of which are previously unpublished, and that the spillage was indeed due to laudanum.
Introduction
The life, work and death of Thomas Chatterton 1752–1770 (a life span of only 17 years 277 days) has always been shrouded in myth and mystery. Born to a widow in Redcliffe, Bristol, Chatterton was expelled from school at the age of six for being a dullard, incapable of improvement.1,2 As a result, he was essentially self-taught. He wrote mock medieval poems in the guise of a 15th Century Bristol priest called Thomas Rowley that confounded the literati of the day. A furore raged over their authenticity for many years after his death, with some still claiming that they were really written by Rowley as late as the 1850s.1,2 Chatterton left Bristol in April 1770 and after residing at Shoreditch in London he moved to Holborn where he tragically died on 24th August 1770.There are conflicting stories surrounding the events leading up to Chatterton's death. A neighbour stated that Chatterton's landlady told her that on 24th August she knew that he had not eaten anything for two or three days. She had begged that he would “take some dinner with her”; but he was offended at her expressions, “which seemed to hint he was in want” and assured her that he was not hungry. Another account was that of a baker, from whom Chatterton obtained his bread, had refused to trust him with an additional loaf, so he immediately went home and committed suicide.1,2
The Coroner had no minutes of the Chatterton inquest, and could not recall the circumstances, however did produce a “memorandum”, the finding of which stated that Thomas Chatterton “swallowed arsenick in water, on the 24th August 1770; and died, in consequence thereof, the next day”.3,4
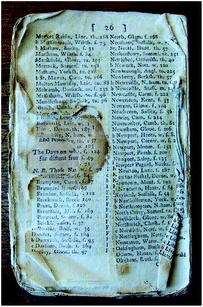
Amongst Chatterton's belongings was a small memorandum book (see Fig. 1) in which he kept his accounts. This book had a brownish stain running through eighteen or so pages. In February 1947, the South-Western Forensic Science Laboratory, Bristol, studied the stained paper and concluded: “It gives a positive reaction for opium alkaloids (i.e. morphine, etc.). The stain was doubtless, therefore, produced by tincture of opium (laudanum)”.5
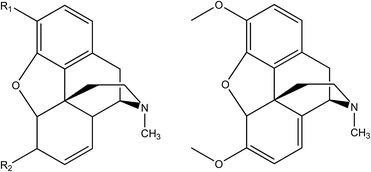
It is now considered likely that Thomas Chatterton did not commit suicide but perhaps died of an accidental overdose of his medicinal treatment. Chatterton showed no signs, in the final four months of his life in London, of the introspective melancholy that often accompanies suicide. Further, contrary to myth, he was financially secure at the time of his death. He may have been taking laudanum (opium tincture) as a sedative. Historic laudanum is a “whole opium” alcoholic extract containing all the main opiates with morphine being at the highest concentration, followed by codeine and thebaine (see Table 1).
Herein, due to the continued interest in the life and work of Thomas Chatterton (it also being the 250th anniversary of his death) and as a result of the considerable advancements in analytical methodologies and technologies since the original forensic investigation of 1947, is contained an up-to-date study of the stain in Chatterton's memorandum book. This study makes use of Ultra performance liquid chromatography (UPLC) coupled to ultra-high-resolution tandem mass spectrometry (MS/MS).
Experimental
A 2 mm2 section of unprinted paper from Chatterton's memorandum book, having the same brown stain as seen in Fig. 1 was obtained in person from Bristol Central Library. This section of paper was cut up with a scalpel and soaked in approximately 1 mL of HPLC grade water. This was left untouched for about 10 minutes. The solution was then pipetted into an LC vial for storage and analysis. A sample of pure codeine was obtained via cold water extraction6 from a pharmaceutical grade co-codamol table obtained from a local pharmacy.Direct infusion screening mass spectra were recorded by nanospray on a Synapt G2S (Waters, Manchester, UK) fitted with a Triversa Nanomate chip-based nanospray system (Advion Biosciences, Norwich, UK). Samples were diluted in methanol![[thin space (1/6-em)]](https://www.rsc.org/images/entities/char_2009.gif) :
:![[thin space (1/6-em)]](https://www.rsc.org/images/entities/char_2009.gif) water (50
water (50![[thin space (1/6-em)]](https://www.rsc.org/images/entities/char_2009.gif) :
:![[thin space (1/6-em)]](https://www.rsc.org/images/entities/char_2009.gif) 50) and 5 μL aspirated through a nanomate 400 chip by the nanospray robot at 1.5 kV nanospray voltage, and 1.5 psi gas pressure. The Synapt's cone temperature was set at 25 °C. Nanospray-MS/MS spectra were recorded by collision induced dissociation (CID) at 30 eV on isolated precursor ions at a resolution of approximately 30
50) and 5 μL aspirated through a nanomate 400 chip by the nanospray robot at 1.5 kV nanospray voltage, and 1.5 psi gas pressure. The Synapt's cone temperature was set at 25 °C. Nanospray-MS/MS spectra were recorded by collision induced dissociation (CID) at 30 eV on isolated precursor ions at a resolution of approximately 30![[thin space (1/6-em)]](https://www.rsc.org/images/entities/char_2009.gif) 000. Reverse phase UPLC-MS/MS analyses were performed on an Orbitrap Elite mass spectrometer equipped with a Dionex Ultimate 3000 UPLC system (Thermo Scientific, Hemel Hempstead, UK). The column was a Waters Acquity UPLC C18 (2.10 × 100 mm, 1.7 μm ID) obtained from Phenomenex (Macclesfield, UK). Solvent A was water + formic acid (1%), solvent B was acetonitrile + formic acid (1%). The 30 minute gradient was 5% B to 95% B over 26 minutes, followed by 2 minutes hold and then return to initial conditions over 2 minutes. Mass spectra were recorded using a heated electrospray ionisation source (HESI) at a resolution of 120
000. Reverse phase UPLC-MS/MS analyses were performed on an Orbitrap Elite mass spectrometer equipped with a Dionex Ultimate 3000 UPLC system (Thermo Scientific, Hemel Hempstead, UK). The column was a Waters Acquity UPLC C18 (2.10 × 100 mm, 1.7 μm ID) obtained from Phenomenex (Macclesfield, UK). Solvent A was water + formic acid (1%), solvent B was acetonitrile + formic acid (1%). The 30 minute gradient was 5% B to 95% B over 26 minutes, followed by 2 minutes hold and then return to initial conditions over 2 minutes. Mass spectra were recorded using a heated electrospray ionisation source (HESI) at a resolution of 120![[thin space (1/6-em)]](https://www.rsc.org/images/entities/char_2009.gif) 000. A source voltage of 3 kV, source temperature of 350 °C and a capillary temperature of 275 °C were used. High purity (oxygen free) N2 was used for both the drying and CID gas. Tandem mass spectra (MS/MS) were recorded during the UPLC analysis on isolated precursor ions (1 Da window) using CID in the Ion Tap of the Orbitrap instrument at 30 eV normalised collision energy. Centroided MS/MS spectra were recorded for every ion in the expected mass range for opium degradation products. Direct infusion MS/MS was also performed on the Orbitrap using the higher energy collisional dissociation (HCD) mode to enable the generation of an increased number of sub fragmentations. All Orbitrap analyses were recorded at a resolution of 120
000. A source voltage of 3 kV, source temperature of 350 °C and a capillary temperature of 275 °C were used. High purity (oxygen free) N2 was used for both the drying and CID gas. Tandem mass spectra (MS/MS) were recorded during the UPLC analysis on isolated precursor ions (1 Da window) using CID in the Ion Tap of the Orbitrap instrument at 30 eV normalised collision energy. Centroided MS/MS spectra were recorded for every ion in the expected mass range for opium degradation products. Direct infusion MS/MS was also performed on the Orbitrap using the higher energy collisional dissociation (HCD) mode to enable the generation of an increased number of sub fragmentations. All Orbitrap analyses were recorded at a resolution of 120![[thin space (1/6-em)]](https://www.rsc.org/images/entities/char_2009.gif) 000. For all MS analysis, the solvents used were HPLC gradient grade obtained from Fisher Scientific (Hemel Hempstead, UK).
000. For all MS analysis, the solvents used were HPLC gradient grade obtained from Fisher Scientific (Hemel Hempstead, UK).
Results and discussion
After leaving the stained paper sample in water for 10 minutes it was seen that a slight brown discolouration occurred, suggesting that something had gone into solution. Fig. 2 shows the mass spectrum resulting from a direct infusion analysis of a 10% diluted sample in methanol![[thin space (1/6-em)]](https://www.rsc.org/images/entities/char_2009.gif) :
:![[thin space (1/6-em)]](https://www.rsc.org/images/entities/char_2009.gif) water (50%). It is clear from this initial analysis that there are many compounds extracted from the paper into the water – this is totally to be expected from a sample of this age. The peaks with the masses labelled in green either match to known opiate degradation products identified in separate studies by Small and Rapaport7,8 or to proposed new degradation products. The two ions labelled in red (m/z 301 and 317) are due to the [M + Na]+ and [M + K]+ of dibutyl phthalate, respectively. The presence of the phthalate contaminant peaks is not unexpected as the book was stored in an air-tight plastic bag and both the book and paper samples were handled with plastic gloves. These peaks will be ignored in all further analysis and were excluded from the UPLC-MS/MS analysis. This spectrum indicates that a wide range of possible degraded opiates were present in the paper extract and to obtain full structural information on them, a systematic analysis by UPLC-MS/MS was performed.
water (50%). It is clear from this initial analysis that there are many compounds extracted from the paper into the water – this is totally to be expected from a sample of this age. The peaks with the masses labelled in green either match to known opiate degradation products identified in separate studies by Small and Rapaport7,8 or to proposed new degradation products. The two ions labelled in red (m/z 301 and 317) are due to the [M + Na]+ and [M + K]+ of dibutyl phthalate, respectively. The presence of the phthalate contaminant peaks is not unexpected as the book was stored in an air-tight plastic bag and both the book and paper samples were handled with plastic gloves. These peaks will be ignored in all further analysis and were excluded from the UPLC-MS/MS analysis. This spectrum indicates that a wide range of possible degraded opiates were present in the paper extract and to obtain full structural information on them, a systematic analysis by UPLC-MS/MS was performed.
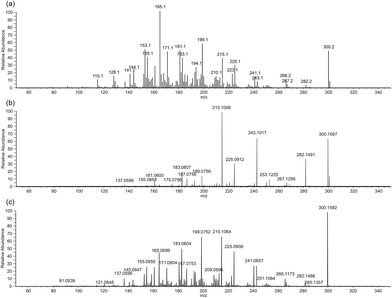
A 10% diluted sample of the paper extract was then subjected a systematic UPLC-HESI-MS/MS analysis with every peak from m/z 220 to 300 fragmented by CID-MS/MS. Opiates have very characteristic fragmentation spectra with groups of peaks clustered by 2 m/z.9–13Fig. 3 shows MS/MS spectra of a pure sample of codeine recorded under a range of conditions. Spectrum (a) is the Nanospray-CID-MS/MS obtained on the Synapt instrument, spectrum (b) is the HESI-CID-MS/MS and spectrum (c) is the HESI-HCD-MS/MS both obtained on the Orbitrap instrument. The pattern of peaks is due to the multitude of possible competing fragment routes which result in product ions that are different in mass by 2 Da. This affect is also apparent in the direct infusion spectrum in Fig. 2, where a range of degraded opiates also cluster with masses different by 2 Da.
Fig. 3 clearly shows the need for different collision modes in MS/MS. Spectrum (a), is a classic Q-Tof type CID-MS/MS spectrum where the multiple fragmentation routes and sub fragmentations are fully accessible creating the classic opiate MS/MS spectrum with clusters of peaks with 2 m/z spacings. Spectrum (b), is the CID-MS/MS run on an Orbitrap instrument which demonstrates how ion-traps can access only a limited number of fragmentations – mainly it is the sub fragmentations that are missing from this spectrum. However, in spectrum (c) the HCD collision mode is used, and this demonstrates that the sub fragmentation routes can still be accessed by using the alternative collision mode. With opiates, the increased stability is bought about by the bridging N-methyl ethanamine. This moiety has been lost in the degraded opiates as demonstrated by the Rapport in 19488 and more recently by Carlin et al. in 2017.14 The result of this is that this enables an increased amount of fragmentation to be observed in the CID-MS/MS mode when compared to the undegraded opiates.
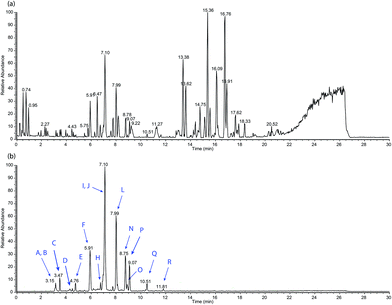
Fig. 4 shows the UPLC-HESI-MS chromatogram of the paper extract. Chromatogram (a) is the base peak chromatogram (BPC) of the whole extract whereas chromatogram (b) is the extracted ion chromatogram (EIC) of the mass range of interest (m/z 220–300). The BPC shows the total chemical make-up of the extract in the full mass range from m/z 50–1000. More polar components will elute at the lower retention times with the hydrophobic components making up the bulk of chromatogram after 20 min. The EIC shows the same chromatogram as (a) but only showing masses in the range from m/z 220–300 which covers the mass range of interest for degraded opiates. This clearly demonstrates how the EIC is far more useful than the BPC as it only shows the components of the extract which might be degraded opiates. The BPC will show everything extracted from the paper which is ionisable under the HESI conditions used. The EIC is labelled with letters from A to R which represent the possible opiate degradation products – see Table 2 for further details.
| ID | Retention time (mins) | Peak area (%) | Molecular formula | Origin | Theoretical mass [M + H]+ | Measured mass [M + H]+ (error in ppm) |
|---|---|---|---|---|---|---|
| a Structure F could be a degradation product from either morphine or codeine.14 | ||||||
| A | 3.09 | 1.8 | C16H20O3 | Mor | 261.1485 | 261.1486 (0.38) |
| B | 3.15 | 4.0 | C16H18O3 | Mor | 259.1329 | 259.1327 (0.77) |
| C | 3.47 | 8.0 | C14H14O3 | Mor | 231.1016 | 231.1013 (1.30) |
| D | 4.49 | 0.9 | C17H22O3 | Cod | 275.1642 | 275.1644 (0.73) |
| E | 4.73 | 3.0 | C16H16O3 | Mor | 257.1172 | 257.1169 (1.17) |
| Fa | 5.91 | 36.7 | C16H14O2 | Cod | 239.1067 | 239.1072 (2.09) |
| G | 6.27 | 0.5 | C13H18O3 | Mor | 245.1172 | 245.1171 (0.41) |
| H | 7.04 | 41.4 | C17H20O3 | Cod | 273.1485 | 273.1487 (0.73) |
| I | 7.10 | 100 | C17H18O3 | Cod | 271.1329 | 271.1326 (1.11) |
| J | 7.10 | 1.6 | C18H22O3 | The | 287.1642 | 287.1639 (1.04) |
| K | 7.21 | 1.4 | C18H18O3 | The | 283.1329 | 283.1325 (1.41) |
| L | 7.99 | 56.4 | C14H12O3 | Mor | 229.0859 | 229.0860 (0.44) |
| M | 8.11 | 1.2 | C18H20O3 | The | 285.1485 | 285.1482 (1.05) |
| N | 8.75 | 6.8 | C14H16O3 | Mor | 233.1172 | 233.1173 (0.43) |
| O | 8.91 | 4.5 | C16H14O3 | Mor | 255.1016 | 255.1018 (0.78) |
| P | 9.07 | 17.6 | C17H20O3 | The | 273.1485 | 273.1488 (1.10) |
| Q | 10.51 | 6.6 | C18H26O3 | The | 291.1955 | 291.1953 (0.69) |
| R | 11.81 | 1.2 | C17H16O3 | Cod | 269.1172 | 269.1164 (2.97) |
To identify the degradation products, tandem mass spectrometry (MS/MS) is performed. In this study, all ions in the mass range of interest were fragmented in the ion trap of the Orbitrap instrument as they eluted from the chromatographic system. In the 1940s, two independent studies of the degradation products of opiates were published7,8 – this is the starting point for the identification of the opiate degradation products found in the brown stain. Fig. 5 shows the structures of the degradation products identified or postulated in the previous studies along with their identification in this study.
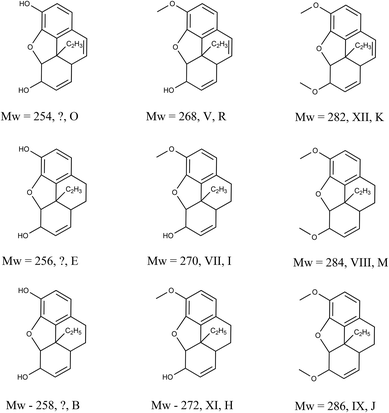 | ||
| Fig. 5 Previously identified (and postulated) degradation products of morphine, codeine and thebaine and their identities. The Roman numeral represents the identity from the original, work by Rapaport8 (‘?’ represents a postulated structure based on those elucidated for codeine and thebaine), the second letter corresponds to the identity used in this study (see Fig. 4 and Table 2). | ||
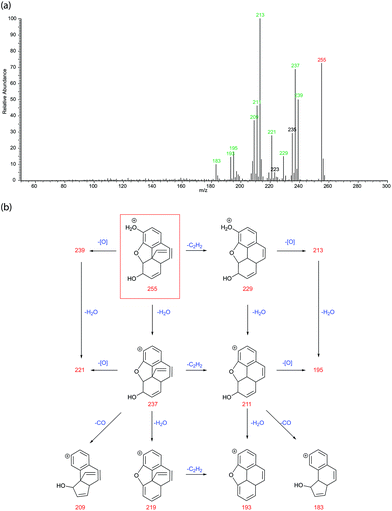
In the early studies, nine opiate degradation products were generated or postulated from chemical degradation methods used for structural elucidation. It is the authors view that environmental degradation should result in some, if not all, of the same degraded structures. In fact, there are peaks corresponding to the mass and formulae of all nine species observed in this analysis and it is fair to assume that these are the species observed. However, to confirm their identities, a thorough and systematic study of their MS/MS spectra was performed. Fig. 6 shows the LC-MS/MS spectrum and proposed fragmentation scheme for degradation product O (m/z 254) postulated as existing by Rapaport.8 The ESI† shows similar spectra and schemes for the other eight known and postulated degradation products (B, E, H, I, J, K, M, R in Table 2). The schemes make reasonable deductions about the neutral losses occurring leading to a consistent set of competing fragmentation routes.
For degradation product O, fragmentation can proceed via 3 competing initial losses – that of oxygen (mass 16), water (H2O mass 18) or ethyne (C2H2, mass 26) resulting in product ions m/z 239, 237 or 229 respectively. All these losses can occur in any sequence and so all three of these initial product ions can then lose one of the other two neutrals to generate product ions m/z 221, 213 or 211. Product ions m/z 237 and 211 can also lose a molecule of carbon monoxide (CO, mass 28) or undergo another water loss to generate ions m/z 219, 209, 193 or 183. Product ion m/z 209 can then also lose ethyne to generate m/z 183 (not shown on the scheme for clarity). The loss of oxygen is quite unusual but is present in every sample in this study. This plethora of possible fragmentation routes and neutral losses leads to the characteristic MS/MS spectra with groups of peaks spaced by 2 m/z. All product ions have had their formulae confirmed by accurate-mass analysis to within 2 ppm maximum error (within 1pmm for a vast majority of ions). Similar fragmentation schemes can be drawn up for all the previously identified degradation products and these can be found, along with their MS/MS in the ESI.†
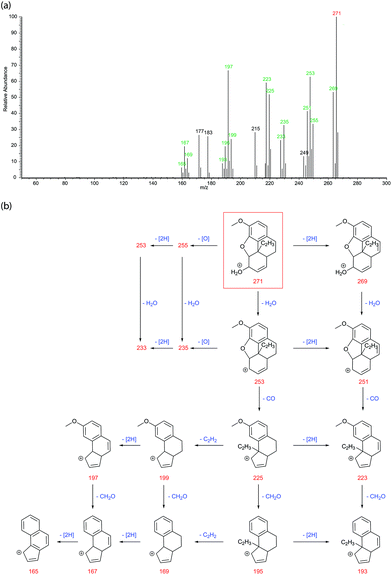
As well as the nine previously identified degradation products, another ten were also observed. To propose structures for these new molecules, fragmentation schemes were drawn up based on those observed for the known products leading to plausible structures for the precursor ions. The fact that almost all product ions can be accounted for within these schemes leads us to have a high degree of confidence in their structures, however these can only be proposals. A good example is for degradation product ‘I’ (m/z 271) from codeine. See Fig. 7 for the LC-MS/MS spectrum and proposed fragmentation scheme.
As degradation product I is from codeine, it has additional fragmentation routes due to the possible loss of formaldehyde (CH2O, mass 30) from the methoxy group. Product I also has a saturated middle ring which enables the loss of 2 hydrogens to occur – this is a very characteristic loss for opiates10,11,13 and seen in this study for every instance where the middle ring is saturated. The precursor ion (m/z 271) can undergo losses of either 2 hydrogens, an oxygen, or a molecule of water to generate product ions m/z 269, 255 or 253 respectively. All these product ions can then also undergo one of the other losses to generate product ions m/z 253, 251 or 235. After the loss of water to generate m/z 253 or 2H and water to generate m/z 251, a loss of a molecule of carbon monoxide followed by formaldehyde occurs to generate product ions m/z 225, 223, 195 and 193. Product ions m/z 225 and 195 can also lose 2 hydrogens to generate m/z 223 and 193. An additional route is for the loss of ethyne (C2H2, mass 26) from m/z 225 or 195 to generate m/z 199 or 169. These can then undergo additional losses of 2 hydrogens leading finally to the fully unsaturated product ion m/z 165.
Degradation products of thebaine (J, K, M, P and Q) all have 2 methoxy groups which makes one of these groups the likely site of protonation resulting in the competing losses of formaldehyde and methanol (CH3OH, mass 32) in place of the losses of water. See ESI† for more details.
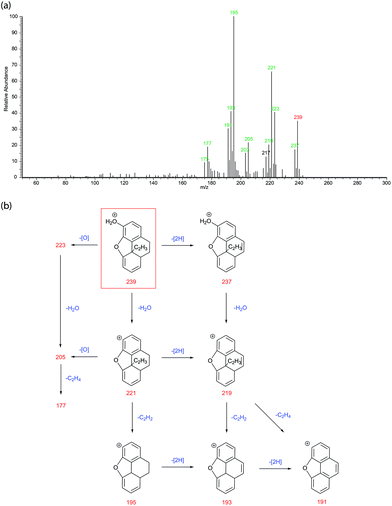
Degradation product ‘F’ is structurally similar to the named opioid morphenol and can result from the degradation of either morphine or codeine. The degradation route of codeine to morphenol is previously published15 and so F is tentatively also assigned as a degradation product of codeine. Fig. 8 is the LC-MS/MS spectrum and proposed fragmentation pathway for ‘F’. The precursor ion (m/z 239) can undergo losses of either 2 hydrogens, oxygen, or a water molecule leading to product ions m/z 237, 223 and 221 respectively. In similar ways to the previous examples above, these three product ions can then undergo another neutral loss resulting in product ions m/z 219 or 205. Further losses of ethyne or ethene (C2H4, mass 28) can then occur leading to product ions m/z 195, 193, 191 or 177.
The discovery of the morphenol analogue amongst the opiate degradation products lead on to the further examination of the LC-MS/MS to see if any other opioids were also present. The EIC for m/z 209 – representing the [M + H]+ of morphenol itself, generates a peak at 3.47 min co-eluting with degradation product ‘C’ but having a very different MS/MS spectrum (see ESI info Fig. S16†). Morphenol is not an opiate and is fully unsaturated and as a result has a relatively simple MS/MS spectrum consisting of only a water loss followed by aromatic like ring contractions (peaks spaced by CH2). The existence of morphenol in the sample is not unexpected due to it being totally unsaturated preventing dehydration or any further environmental degradation. Morphenol was first proposed to be a degradation product of morphine in 189716 and although is a very minor product here, it is clearly present amongst the other opiate degradation products.
Conclusions
The ultrahigh resolution UPLC-MS/MS analysis of the stain on Thomas Chatterton's memorandum book successfully identified 18 opiate and 1 opioid proposed degradation products from morphine, codeine or thebaine. The full unequivocal identification of the proposed degraded structures is not possible within the confines of this study. However, in a study published in the 1940s, Rapoport identified a series of chemical degradation products of morphine and codeine that had the N-methyl ethanamine moiety eliminated.8 A recent study in 2017 also showed similar results for the acid/base degradation of thebaine.14 Several of the structures proposed for the identity of the degradation products in this study match the masses and formulae of those observed previously. From there, a set of structures for all the other degradation products have been proposed based on their similar and highly characteristic MS/MS spectra.The conclusion of this study is that the stain is most certainly the result of laudanum having been spilled. Laudanum was an expensive medicinal treatment in the Georgian era and any user would have been highly careful to not have accidental spilled it – especially on their memorandum book, which itself would have been a treasured possession. This would lead on to the speculation that Chatterton was self-medicating with Laudanum, took too much and spilled or knocked over the rest of the bottle as a result. Paregoric is another opiate medication which was widely taken at the time but was approximately 20 times more dilute than laudanum. It is quite possible that Chatterton mistook laudanum for paregoric – but this is purely speculation. The scientific evidence is overwhelming that the stain is the result of opiates, anything else is purely speculation, but the assertion that he committed suicide by arsenic poisoning should be in, the authors view, called into serious doubt.
Conflicts of interest
The authors declare no conflicts of interest.Acknowledgements
PJG and MLD would like to thank Professor Richard Evershed for initial discussions regarding this study and Jane Bradley of Bristol Central Library for providing access to Thomas Chatterton's memorandum book and permitting the taking of the sample and the photograph required for this study.References
- G. Gregory and A. Kippis, ed. Biographia Britannica, 1789, 4, 573–619 Search PubMed.
- Encyclopaedia Britannica, Vol 6, Slice 1, p11. https://www.gutenberg.org/files/31156/31156-h/31156-h.htm#ar15 (accessed June 11th, 2020).
- G. Gregory, The Life of Thomas Chatterton, 1789, p 100. Reproduced in “The Life of Thomas Chatterton: With Criticisms on his Genius and Writings, and a Concise View of the Controversy Concerning Rowley's Poems”, 2013, Cambridge University Press, Cambridge. ISBN10: 1108063357 Search PubMed.
- G. Gregory, Thomas Chatterton, His Life, Biggs and Cottle, London, 1803, plxx Search PubMed.
- H. J. Walls , South-Western Forensics Science Service report 1947 Bristol Central Library classification mark: B20965.
- J. T. Harnett, A. M. Dines, D. M. Wood, J. R. H. Archer and P. I. Dargan, Clin. Toxicol., 2020, 58, 107 CrossRef CAS.
- L. Small, J. Org. Chem., 1942, 7, 158 CrossRef CAS.
- H. Rapoport, J. Org. Chem., 1948, 13, 714 CrossRef CAS.
- K. Raith, R. Neubert, C. Poeaknapo, C. Boettcher, M. H. Zenk and J. Schmidt, J. Am. Soc. Mass Spectrom., 2003, 14, 1262 CrossRef CAS.
- C. Poeaknapo, U. Fisinger, M. H. Zenk and J. Schmidt, Phytochemistry, 2004, 65, 1413 CrossRef CAS.
- Z. Zhang, B. Yan, K. Liu, T. Bo, Y. Liao and H. Liu, Rapid Commun. Mass Spectrom., 2008, 22, 2851 CrossRef CAS.
- L. Bijlsma, J. V. Sancho, F. Hernández and W. M. A. Niessen, J. Mass. Spectrom., 2011, 46, 865 CrossRef CAS.
- S. Cheddah and T. Hang, J. Chin. Pharm. Sci., 2014, 23, 694 CAS.
- M. G. Carlin, J. R. Dean, J. L. Bookham and J. J. B. Perry, R. Soc. Open Sci., 2017, 4, 170715 CrossRef.
- P. B. Weill, The Structure of Morphine, United Nations Office of Drugs and Crime Technical Report, 1950. https://www.unodc.org/unodc/en/data-and-analysis/bulletin/bulletin_1950-01-01_2_page004.html (accessed June 19th, 2020) Search PubMed.
- E. Vongerichten, Ber., 1897, 30, 2439 CrossRef CAS.
Footnote |
| † Electronic supplementary information (ESI) available. See DOI: 10.1039/d0an01662d |
| This journal is © The Royal Society of Chemistry 2020 |

