 Open Access Article
Creative Commons Attribution 3.0 Unported Licence
A single component white electroluminescent device fabricated from a metallo-organic terbium complex†
Rashid
Ilmi
 a,
Muhammad S.
Khan
 *a,
Weidong
Sun
b,
Liang
Zhou
 *b,
Wai-Yeung
Wong
 *c and
Paul R.
Raithby
 *d
*d
aDepartment of Chemistry, Sultan Qaboos University, P. O. Box 36, Al Khod 123, Sultanate of Oman. E-mail: msk@squ.edu.om
bState Key Laboratory of Rare Earth Resource Utilization, Changchun Institute of Applied Chemistry, Chinese Academy of Sciences, Renmin Street 5625, Changchun 130022, People's Republic of China. E-mail: zhoul@ciac.ac.cn
cDepartment of Applied Biology and Chemical Technology, The Hong Kong Polytechnic University, Hung Hom, Kowloon, Hong Kong. E-mail: wai-yeung.wong@polyu.edu.hk
dDepartment of Chemistry, University of Bath, Claverton Down, Bath BA2 7AY, UK. E-mail: p.r.raithby@bath.ac.uk
First published on 23rd October 2019
Abstract
Two new mixed ligand complexes [Eu(tfac)3(DPEPO)] (Eu-1) and [Tb(tfac)3(DPEPO)] (Tb-2) incorporating trifluoroacetylacetone (Htfac) and bis(2-(diphenylphosphino)phenyl)ether oxide (DPEPO) were synthesized in gram-scale quantities and used as emitters to fabricate single- and double-EML (light-emitting layer) electroluminescence (EL) devices. The single-EML device with the structure: ITO/HAT-CN (6 nm)/HAT-CN (0.2 wt%):TAPC (50 nm)/Eu-1 (1–6 wt%): 26DCzPPy (10 nm)/Tm3PyP26PyB (50 nm)/LiF (1 nm)/Al (100 nm) showed light red (CIE, x: 0.574; y: 0.275) emission for the Eu-1 based EL devices due to the presence of a host emission with a brightness of 1274 cd m−2, current efficiency (ηc), power efficiency (ηp) and external quantum efficiency (EQE) of 0.58 cd A−1, 0.68 lm W−1, and 0.70%, respectively. The single-EML device for the Tb-2 complex with the same device structure displayed white-light emission. The optimized single-EML device of Tb-2 with 14.0 wt% doping concentration showed an impressive EL performance with brightness of 1637 cd m−2, ηc ≈ 3.05 cd A−1, ηp ≈ 2.80 lm W−1, EQE ≈ 1.4%, Vturn-on ≈ 3.1 V, respectively. This is the first report of single component white organic light emitting diode (W-OLED) fabricated from an organo-Tb(III) complex. The W-OLEDs show low turn-on voltages (Vturn-on) ≈ 3.1 V and are thus advantageous in lowering the power consumption of the OLED display.
1. Introduction
The development of W-OLEDs has gained momentum because of their potential to be used as alternatives to existing low efficient incandescent and fluorescent lights and as possible candidates for full-color displays.1 White light can be generated1a by (a) the monochromatic approach utilizing a single material capable of emitting across the entire visible spectrum (400–700 nm), (b) the bichromatic approach that needs two primary colors such as blue and yellow or orange and finally (c) the trichromatic approach that uses red, green and blue (RGB) emitting materials. In this respect a number of white electroluminescent (EL) devices employing organic, polymeric and organometallic complexes have been utilized.1e,2 Organo-lanthanide complexes are interesting candidates because of their fascinating optical properties such as long luminescence lifetimes, ion-specific emission colors e.g. red for trivalent europium [Eu(III)] and green for trivalent terbium [Tb(III)], narrow line-like emission bands (Full Width at Half Maxima (FWHM) < 10 nm).3 β-diketones with organic chromophores have played a major role in lanthanide coordination chemistry because they can chelate the metal centers and as well as sensitize Eu(III) and Tb(III) emissions. Several interesting applications have been envisioned using this class of lanthanide coordination complexes such as single molecule magnets (SMMs),4 luminescent thermometers,5 sensors,6 and OLEDs.3a,7The generation of W-OLEDs using organo-lanthanide complexes kick-started from the pioneering work of Kido et al.,8 who fabricated W-OLEDs with multilayer device structures using red and green emitting ternary europium and terbium complexes [Eu(dbm)3phen] and [Tb(acac)3phen] (acac = acetylactonate, dbm = dibenzoylmethanate and phen = 1,10-phenanthroline). Quirino et al.9 obtained white EL (CIE, x = 0.28; y = 0.35, with 20.5 cd m−2 of luminance) using bis-terpyridine bridged hetero-dinuclear complex of [Eu(btfa)3] and [Tb(acac)3] (btfa = benzoyltrifluoroacetylacetonato). By following a similar approach, W-OLED of [Eu0.45Tb0.55(btfa)3(4,4′-bpy)(EtOH)] with (CIE, x = 0.353; y = 0.316) at 18 V (4,4′-bpy = 4,4′-bipyridine) has been reported.10 However, these multilayer devices using one or more emitting species make the fabrication of EL devices difficult and increase the manufacturing cost as well as the time taken to fabricate them, thereby limiting their real-life applications. An efficient way to circumvent these problems in W-OLEDs is to utilize a single-component emitter with tunable emission, which endows the device with important additional advantages such as good reproducibility and color stability.1d Based on this concept, Li et al., fabricated a W-OLED (CIE, x = 0.333; y = 0.348) from the dendritic complex [Eu(TCPD)3phen] (TCPD = 1-[3,4,5-tris[4-(9H-carbazol-9-yl)butoxy]-phenyl]-3-phenylpropane-1,3-dione) with a maximum brightness of 229 cd m−2 at voltage 20.5 V.11 Similarly Law et al.,12 fabricated a W-OLED from [Eu(tta)3L] (tta = thenoyltrifluoroacetonate and L = 2-(3,5-dimethyl-2H-pyrrol-2-yl)-4-(3,5-dimethyl-3H-pyrrol-2-yl)-6-(4-(pentan-3-yl)phenyl)-1,3,5-triazine) with CIE, x = 0.337; y = 0.362 with 945.1 cd m−2 of luminance at 16 V. Later, Zucchi et al., fabricated an exciplex generated W-OLED CIE, x = 0.35; y = 0.33 with maximum luminance of 19.7 cd m−2 at 7.6 V from the symmetrical homodinuclear [Eu2(tta)6]bpm complex (bpm = 2,2′-bipyrimidine).13 Biju et al.14 have fabricated color-tunable OLED from the tetrakis Eu(III) complex NBu4[Eu(L1)4] (L1 = 4-(4′-carbazol-9-yl-biphenyl-4-yl)-1,1,1-trifluoro-4-oxo-but-2-en-2-ol). The single component device containing NBu4[Eu(L1)4] in the emitting layers (EML) showed white EL (CIE, x = 0.337; y = 0.328) at 8 V with brightness of 1547 cd m−2 at 13.1 V. Notably, the devices described above have utilized very high operating voltages to obtain the white-light. Only a handful of reports are available in the literature on the organo-lanthanide-based single component W-OLEDs. It is even more interesting that most of the reported W-OLEDs are based on Eu(III) complexes or Eu(III) and Tb(III) heterodinuclear complexes such as [Eu(btfa)3phenterpyTb(acac)3]9 and [Eu0.45Tb0.55(btfa)3(4,4′-bpy)(EtOH)].10 To the best of our knowledge, there is no report of single component Tb(III) based W-OLED.
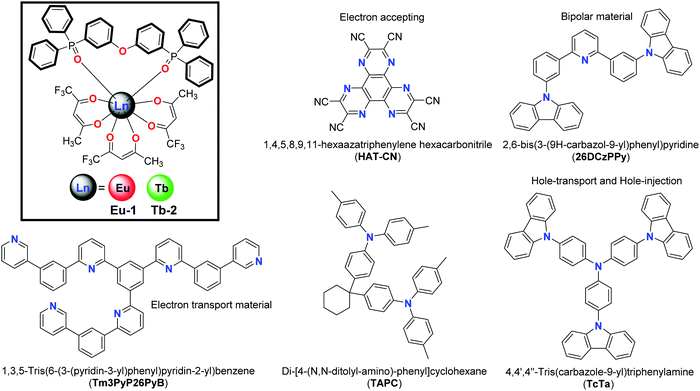
Very recently3a we were able to see near white light (CIE, x = 0.257; y = 0.337) emission from the [Tb(hfaa)3Py-Im] complex [hfaa = hexafluoroacetylacetone; Py-Im = 2-((2-pyridyl)benzimidazole)]. The complex showed residual ligand emission which covers almost the entire visible region of the spectrum from 400–700 nm. This was due to the incompatible triplet state (3ππ*) of Py-Im with the 5D4 emitting level of Tb(III) with ΔE(3ππ*–5D4) ≈ 76 cm−1. In the present study we have synthesized two new ternary Ln(III) complexes [Ln(III) = Eu(III) and Tb(III)] with hemi-fluorinated β-diketonate ‘trifluoroacetylacetone (Htfac)’ and bis(2-(diphenylphosphino)phenyl)ether oxide (DPEPO) as the neutral bidentate ligand to obtain [Ln(tfac)3(DPEPO)] (Chart 1). The neutral and rigid chelate phosphine oxide ‘DPEPO’ is chosen because of its ability to coordinate to Ln(III) ions strongly and to transport electrons.15 Apart from this, the rigid structure of DPEPO is likely to increase the thermal stability of the complexes as well as facilitate the triplet energy transfer from ligands to the central Ln(III) ion.15 Furthermore, it also serves as a host material for the EML of OLEDs.16 The solid-state structures of [Ln(tfac)3(DPEPO)] [Ln = Eu-1 and Tb-2] complexes were determined by X-ray single-crystal analysis. The photophysical properties of the complexes were evaluated in the solid-state and in solution by steady-state and time-resolved spectroscopy. Complexes Eu-1 and Tb-2 were further employed as an EML(s) to fabricate single- and double-layer OLEDs. For the first time Tb(III) based single component W-OLED (CIE at 10 mA cm−2, x = 0.293; y = 0.351) is fabricated with an impressive maximum brightness of (B) 1637 cd m−2 and a maximum power efficiency (ηp) 2.80 lm W−1 at a very low turn-on voltage (Vturn-on) of 3.1 V compared to the reported single component W-OLEDs based on Eu(III) ion. The present work opens up a new avenue for utilizing Tb(III) complexes for high performance single component W-OLEDs.
2. Experimental section: materials and instrumentation
All chemicals were procured from commercial sources and were used without further purification unless otherwise specified. Metal chlorides of Eu(III) and Tb(III) were purchased from Strem Chemicals, Inc. Solvents used in the experiments were dried and distilled prior to use. Combustion analysis of the complexes Eu-1 and Tb-2 were performed on Euro EA-CHN Elemental Analyser. The Fourier transform infrared (FTIR) spectra of the solid complexes Eu-1 and Tb-2 were obtained using a Cary 630 FT-IR spectrometer in the attenuated total reflectance (ATR) mode. The electrospray ionization (ESI) mass spectra were obtained using a VG Autospec magnetic sector instrument. Thermal analyses of Eu-1 and Tb-2 were recorded on PerkinElmer TGA-4000 under a N2 atmosphere.2.1. Synthesis of [Ln(tfac)3(DPEPO)] [Ln: Eu and Tb]
![[double bond, length as m-dash]](https://www.rsc.org/images/entities/char_e001.gif) O) ∼ 1628(s); ν(C
O) ∼ 1628(s); ν(C![[double bond, length as m-dash]](https://www.rsc.org/images/entities/char_e001.gif) C) ∼ 1532(m); ν(P
C) ∼ 1532(m); ν(P![[double bond, length as m-dash]](https://www.rsc.org/images/entities/char_e001.gif) O) ∼ 1175(s); melting point (Tm): 223 °C as determined by the differential scanning calorimetry (DSC); decomposition temperature (Td): 287 °C.
O) ∼ 1175(s); melting point (Tm): 223 °C as determined by the differential scanning calorimetry (DSC); decomposition temperature (Td): 287 °C.
![[double bond, length as m-dash]](https://www.rsc.org/images/entities/char_e001.gif) O) ∼ 1629(s); ν(C
O) ∼ 1629(s); ν(C![[double bond, length as m-dash]](https://www.rsc.org/images/entities/char_e001.gif) C) ∼ 1532(m); ν(P
C) ∼ 1532(m); ν(P![[double bond, length as m-dash]](https://www.rsc.org/images/entities/char_e001.gif) O) ∼ 1174(s) (Fig. S4, ESI†); melting point (Tm): 217 °C as determined by DSC; Td: 287 °C.
O) ∼ 1174(s) (Fig. S4, ESI†); melting point (Tm): 217 °C as determined by DSC; Td: 287 °C.
2.2. Molecular structure determination by single-crystal X-ray crystallography
Crystals of the Eu-1 and Tb-2 complexes for X-ray analysis were grown at room temperature by slow evaporation of concentrated ethanolic solution. X-ray intensity data were collected using ϕ and ω scans on an Oxford Diffraction Gemini A-Ultra diffractometer using monochromated Mo-Kα radiation (λ = 0.71073 Å) at 150 K. The structures were solved by direct methods (SIR-92)17 and refined with full-matrix least-squares, based on F2 (ShelXL),18 within the OLEX-2 program suite.19 One of the CF3 groups in each structure was found to be disordered and was refined over two sites, with partial occupancies, restrained to unity. Hydrogen atoms were placed in idealized positions and refined using a riding model with isotropic displacement parameters refines with Ueq(H) = 1.2Ueq(C) for the aromatic H-atoms and 1.5 Ueq(C) for the methyl H-atoms. The details of the measurements and structure refinements are presented in Table S1, ESI.†2.3. Spectroscopic measurements, photophysical parameters and fabrication of EL devices
Spectroscopic measurements of the free DPEPO ligand and the Eu-1 and Tb-2 complexes including optical absorption, excitation, emission spectra and decay profiles were obtained at room temperature and full details of the measurements have been reported previously.3a,20 Optical absorption spectra were obtained using Varian Cary 50 spectrophotometer while excitation, emission spectra and decay profiles were recorded on an Edinburgh FS5 fluorimeter. Important photophysical parameters such as Judd–Ofelt (J–O) parameters (Ω2 and Ω4), radiative (AR) and non-radiative (ANR) decay rates, radiative lifetime (τrad) and intrinsic quantum yield (QEuEu) were calculated using following eqn (1)–(7) and details are reported elsewhere.3a,20 | (1) |
 | (2) |
 | (3) |
 | (4) |
| τrad = 1/AR | (5) |
 | (6) |
 | (7) |
The structure of the materials used in the fabrication process together with the complexes Eu-1 and Tb-2 are shown in Chart 1. All organic materials used in the fabrication were obtained commercially and used as received, while Eu-1 and Tb-2 were synthesized and purified in our laboratory (Chart 1). ITO coated glass with the sheet resistance of 10 Ω sq−1 was used as the anode substrate. Prior to film deposition, patterned ITO substrates were cleaned with detergent, rinsed in de-ionized water, and finally dried in an oven. All organic layers were deposited at a rate of 0.1 nm s−1 under high vacuum (≤3.0 × 10⁻⁵ Pa). The doped and co-doped EMLs were prepared by co-evaporating dopant(s) and host material from two or three individual sources, and the doping concentration was modulated by controlling the evaporation rate of dopant(s). LiF and Al were deposited in another vacuum chamber (≤8.0 × 10⁻⁵ Pa) at rates of 0.01 and 1.0 nm s−1, respectively, without being exposed to the atmosphere. The thicknesses of these deposited layers and the evaporation rate of individual materials were monitored in vacuum with quartz crystal monitors. A shadow mask was used to define the cathode and make eight emitting dots with the active area of 9 mm2 on each substrate. Current density–brightness–voltage (J–B–V) characteristics were measured by using a programmable brightness light distribution characteristics measurement system C9920-11. The Photoluminescent (PL) and EL spectra were measured with a calibrated Hitachi F–7000 fluorescence spectrophotometer and an Ocean Optics spectrophotometer.
3. Results and discussion
3.1. Synthesis, characterization and thermal analysis
Gram scale syntheses of the Eu-1 and Tb-2 complexes shown in Chart 1 (inset) were accomplished in two steps. The binary hydrated complexes [Ln(tfac)3(H2O)2] [Ln = Eu(III) and Tb(III)] (please see ESI† for synthesis) were first prepared and then reacted with the DPEPO ligand in ethanol (EtOH) at room temperature to obtain the final complexes. The synthesized Eu-1 and Tb-2 complexes were characterized by analytical and spectroscopic techniques while the structures were determined by single crystal X-ray diffraction (SC-XRD). The results of microanalysis and ESI-MS are consistent with Ln(III) to Htfac to DPEPO ratio of 1![[thin space (1/6-em)]](https://www.rsc.org/images/entities/char_2009.gif) :
:![[thin space (1/6-em)]](https://www.rsc.org/images/entities/char_2009.gif) 3
3![[thin space (1/6-em)]](https://www.rsc.org/images/entities/char_2009.gif) :
:![[thin space (1/6-em)]](https://www.rsc.org/images/entities/char_2009.gif) 1 as shown in Chart 1. The IR spectra of free DPEPO and Eu-1 and Tb-2 complexes are shown in Fig. S2 and S4, ESI.† The complexes do not display any absorption between 3200–3600 cm−1 implying that DPEPO has successfully replaced the coordinated water molecules from the [Ln(tfac)3(H2O)2]. The IR spectra of both the complexes are almost similar and displayed two stretching absorption peaks [Eu-1; ν(C
1 as shown in Chart 1. The IR spectra of free DPEPO and Eu-1 and Tb-2 complexes are shown in Fig. S2 and S4, ESI.† The complexes do not display any absorption between 3200–3600 cm−1 implying that DPEPO has successfully replaced the coordinated water molecules from the [Ln(tfac)3(H2O)2]. The IR spectra of both the complexes are almost similar and displayed two stretching absorption peaks [Eu-1; ν(C![[double bond, length as m-dash]](https://www.rsc.org/images/entities/char_e001.gif) O) ∼ 1629(s); ν(C
O) ∼ 1629(s); ν(C![[double bond, length as m-dash]](https://www.rsc.org/images/entities/char_e001.gif) C) ∼ 1532(m)] typical for β-diketonate chelated lanthanide complexes. Furthermore, P
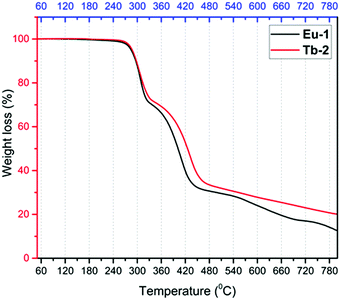
C) ∼ 1532(m)] typical for β-diketonate chelated lanthanide complexes. Furthermore, P![[double bond, length as m-dash]](https://www.rsc.org/images/entities/char_e001.gif) O stretching frequency at 1189 cm−1 of DPEPO is red shifted in the Eu-1 and Tb-2 complexes to 1174–1175 cm−1 confirming its coordination to the Ln(III) center. Thermal stability of the complexes is a very important factor since devices from low thermally stable (decomposition temperature, Td) complexes reduce the EL performance. The thermal stability of the new Eu-1 and Tb-2 complexes was determined by TGA and DSC under dinitrogen atmosphere and are shown in Fig. 1 and Fig. S5 and S6, ESI.† The thermogram of both complexes are nearly identical in shape and show two-step weight loss with almost the same Td ≈ 287 °C. The high Td facilitates the device fabrication. The complexes have higher Td than [Eu(hfaa)3DPEPO] (Td ≈ 228 °C) and marginally lower Td than [Eu(btfa)3DPEPO] (Td ≈ 320 °C) and [Eu(nta)3DPEPO] (Td ≈ 318 °C) (nta = 3-(2-naphthoyl)-1,1,1-trifluoroacetonate).21 The DSC of the complexes displayed sharp endothermic peaks at 223 °C and 217 °C for Eu-1 and Tb-2, respectively, representing the Tm of the complexes (Fig. S5 and S6, ESI†). The higher Td and Tm arise presumably due to the rigid structure of the ancillary DPEPO ligand, making the complexes suitable for device fabrication by the thermal evaporation method. Furthermore, TGA profiles of Eu-1 and Tb-2 do not display any weight loss in the temperature region 60–180 °C and this suggests that the complexes do not have any water or solvent molecules, further attesting to the results of IR spectra.
O stretching frequency at 1189 cm−1 of DPEPO is red shifted in the Eu-1 and Tb-2 complexes to 1174–1175 cm−1 confirming its coordination to the Ln(III) center. Thermal stability of the complexes is a very important factor since devices from low thermally stable (decomposition temperature, Td) complexes reduce the EL performance. The thermal stability of the new Eu-1 and Tb-2 complexes was determined by TGA and DSC under dinitrogen atmosphere and are shown in Fig. 1 and Fig. S5 and S6, ESI.† The thermogram of both complexes are nearly identical in shape and show two-step weight loss with almost the same Td ≈ 287 °C. The high Td facilitates the device fabrication. The complexes have higher Td than [Eu(hfaa)3DPEPO] (Td ≈ 228 °C) and marginally lower Td than [Eu(btfa)3DPEPO] (Td ≈ 320 °C) and [Eu(nta)3DPEPO] (Td ≈ 318 °C) (nta = 3-(2-naphthoyl)-1,1,1-trifluoroacetonate).21 The DSC of the complexes displayed sharp endothermic peaks at 223 °C and 217 °C for Eu-1 and Tb-2, respectively, representing the Tm of the complexes (Fig. S5 and S6, ESI†). The higher Td and Tm arise presumably due to the rigid structure of the ancillary DPEPO ligand, making the complexes suitable for device fabrication by the thermal evaporation method. Furthermore, TGA profiles of Eu-1 and Tb-2 do not display any weight loss in the temperature region 60–180 °C and this suggests that the complexes do not have any water or solvent molecules, further attesting to the results of IR spectra.
3.2. Molecular structure determination by single-crystal X-ray crystallography
The crystal and molecular structures of [Ln(tfac)3(DPEPO)] (Ln: Eu(Eu-1) and Tb(Tb-2)) have been determined using single-crystal X-ray diffraction techniques. The two complexes are isomorphous and isostructural, crystallizing in the triclinic space group P![[1 with combining macron]](https://www.rsc.org/images/entities/char_0031_0304.gif) with one molecule in the asymmetric unit. Within each crystal structure the complexes are separated by van der Waals distances and there are no significant short contacts between the molecules.
with one molecule in the asymmetric unit. Within each crystal structure the complexes are separated by van der Waals distances and there are no significant short contacts between the molecules.
The Eu and Tb centers, in the two structures, are eight coordinate, bonded to three bidentate trifluoroacetate groups and a bidentate bis(2-(diphenylphosphino)phenyl)ether oxide ligand. The molecular structure of the Eu complex is shown in Fig. 2 (with that of the isostructural Tb complex in Fig. S7, ESI†). Because of the chelating nature of the four ligands the coordination geometry around the metal is distorted from the possible limiting geometries,22 however it approximates most closely to a trigonal dodecahedron.
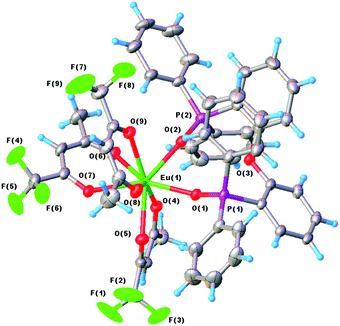 | ||
| Fig. 2 The molecular structure of Eu-1 with displacement ellipsoids drawn at the 50% probability level. | ||
The three tfac ligands coordinate fairly symmetrically with Eu–O ranging from 2.373(2) to 2.437(2) Å and Tb–O from 2.347(2) to 2.410(2) Å, respectively. The chelating DPEPO ligand also coordinates symmetrically with the Eu–O bond lengths of 2.361(2) and 2.377(2) Å and those for Tb–O of 2.334(2) and 2.357(2) Å. The slightly shorter distances for the Tb complex are consistent with the slight reduction of the Tb covalent radius compared to that of Eu, consistent with the effect of the lanthanide contraction, in moving from left to right across the lanthanide series. The Eu–O(DPEPO) distances are similar to those in related eight coordinate Eu(III) phosphine oxide complexes (2.345–2.446 Å)23 as are the Tb–O(DPEPO) bond lengths (2.265–2.355 Å).24 The other molecular parameters within the structures are unremarkable and full listing of the structural parameters for the two complexes are presented in Tables S2–S15, ESI.†
3.3. Photophysical properties of Eu-1 and Tb-2 complexes
The optical absorption spectra of the free DPEPO ligand, Eu-1 and Tb-2 complexes were obtained in dichloromethane (DCM:CH2CL2) solution (c ≈ 5 × 10⁻⁵ M) at room temperature shown Fig. S8, ESI.† The free ligand displayed two major absorption peaks at 228 nm (ε ≈ 48![[thin space (1/6-em)]](https://www.rsc.org/images/entities/char_2009.gif) 506 M−1 cm−1) and 290 nm (ε ≈ 8863 M−1 cm−1). The spectra of Eu-1 and Tb-2 complexes are identical in shape and showed combined absorption peaks of both β-diketone and ancillary DPEPO ligand with ε ≈ 51
506 M−1 cm−1) and 290 nm (ε ≈ 8863 M−1 cm−1). The spectra of Eu-1 and Tb-2 complexes are identical in shape and showed combined absorption peaks of both β-diketone and ancillary DPEPO ligand with ε ≈ 51![[thin space (1/6-em)]](https://www.rsc.org/images/entities/char_2009.gif) 314 M−1 cm−1 for Eu-1 and ε ≈ 50
314 M−1 cm−1 for Eu-1 and ε ≈ 50![[thin space (1/6-em)]](https://www.rsc.org/images/entities/char_2009.gif) 270 M−1 cm−1 for Tb-2 at 291 nm, respectively. For an efficient sensitization of Ln(III) ion emissions in organo-lanthanide complexes, an appropriate energy difference (ΔE) between the triplet state of organic ligands and the emitting levels of Ln(III) ions must exist. For Eu(III) it should be higher than 2500 cm−1
270 M−1 cm−1 for Tb-2 at 291 nm, respectively. For an efficient sensitization of Ln(III) ion emissions in organo-lanthanide complexes, an appropriate energy difference (ΔE) between the triplet state of organic ligands and the emitting levels of Ln(III) ions must exist. For Eu(III) it should be higher than 2500 cm−1![[thin space (1/6-em)]](https://www.rsc.org/images/entities/char_2009.gif) 25 while for Tb(III) it should be in the range of 2500–4000 cm−1.26 In our present study there are two types of organic ligands with triplet states (3ππ*) at 22
25 while for Tb(III) it should be in the range of 2500–4000 cm−1.26 In our present study there are two types of organic ligands with triplet states (3ππ*) at 22![[thin space (1/6-em)]](https://www.rsc.org/images/entities/char_2009.gif) 720 cm−1 and 24
720 cm−1 and 24![[thin space (1/6-em)]](https://www.rsc.org/images/entities/char_2009.gif) 116 cm−1 for tfac and DPEPO, respectively.15,27 The 3ππ* of the organic ligands are well above the 5D0 (17
116 cm−1 for tfac and DPEPO, respectively.15,27 The 3ππ* of the organic ligands are well above the 5D0 (17![[thin space (1/6-em)]](https://www.rsc.org/images/entities/char_2009.gif) 500 cm−1) emitting state of Eu(III); with ΔE(3ππ*–5D0) ≈ (5220 cm−1)tfac, an efficient ET can be observed. However, for the 5D4 (20
500 cm−1) emitting state of Eu(III); with ΔE(3ππ*–5D0) ≈ (5220 cm−1)tfac, an efficient ET can be observed. However, for the 5D4 (20![[thin space (1/6-em)]](https://www.rsc.org/images/entities/char_2009.gif) 500 cm−1) emitting state of Tb(III), this difference is 2220 cm−1 and perhaps could lead to back ET.
500 cm−1) emitting state of Tb(III), this difference is 2220 cm−1 and perhaps could lead to back ET.
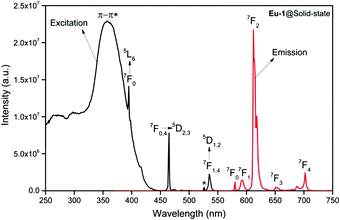
In view of this, we first analyzed the PL properties of the Eu-1 complex in the solid-state and in DCM solution, which are depicted in Fig. 3 and Fig. S9, ESI.† The excitation spectra in both cases were obtained by monitoring the 5D0 → 7F2 emission transition and is composed of broad band that covers the region between 250–400 nm with maxima at 359 nm and 340 nm for solid and DCM solution, respectively. The spectrum in the solid-state is also composed of Eu(III) centered excitation transitions i.e., intra-configurational f–f transition and are assigned to the transition as shown in Fig. 3. Moreover, the intensity of the broad band is almost three times higher than 7F0 → 5D2 (21![[thin space (1/6-em)]](https://www.rsc.org/images/entities/char_2009.gif) 505 cm−1; 465 nm) excitation transitions and can be taken as evidence in favor of the antenna mechanism.3a,20 The emission spectra of Eu-1 in the solid-state and in DCM solution recorded by exciting it at λExmax displayed typical well-resolved Eu(III) emission transitions3a,20,28 corresponding to 5D0 → 7F0,1,2,3,4 as shown in Fig. 3 and Fig. S9, ESI.† The relevant data such as peak positions and intensity relative to 5D0 → 7F1 transition are gathered in Table S16, ESI.† In both cases, the spectra do not show any residual ligand-based emission suggesting an efficient intramolecular energy transfer from the ligands to Eu(III) center.3a,20,28a
505 cm−1; 465 nm) excitation transitions and can be taken as evidence in favor of the antenna mechanism.3a,20 The emission spectra of Eu-1 in the solid-state and in DCM solution recorded by exciting it at λExmax displayed typical well-resolved Eu(III) emission transitions3a,20,28 corresponding to 5D0 → 7F0,1,2,3,4 as shown in Fig. 3 and Fig. S9, ESI.† The relevant data such as peak positions and intensity relative to 5D0 → 7F1 transition are gathered in Table S16, ESI.† In both cases, the spectra do not show any residual ligand-based emission suggesting an efficient intramolecular energy transfer from the ligands to Eu(III) center.3a,20,28a
A narrow (FWHM ≈ 7.84 nm and 10.21 nm for the solid-state and in DCM solution, respectively, Table 1) hypersensitive 5D0 → 7F2 (accounting ≈ 79.50–82.41% of total integral intensity, Table S16, ESI†) transition dominates the spectra, which is responsible for the bright red emission (CIE, x = 0.664; y = 0.324 for solid-state), Table S16 and Fig. S10 (ESI†). Apart from this intense emission transition, the spectra displayed some weak transitions 5D0 → 7F1, 5D0 → 7F3 and 5D0 → 7F4 with total integral contribution of 16.39–19.82% towards the entire emission. The magnetic-dipole (MD) 5D0 → 7F0 emission transition showed a well-resolved single peak (Fig. 3 and Fig. S9, ESI†) with FWHM ≈ (1.09 nm)solid-state and (1.60 nm)DCMTable 1, suggesting a single chemical environment around the Eu(III) ion.3a,20,28b The steady-state emission spectra were used to obtain the Ω2 and Ω4 intensity parameters using eqn (1) above and the results obtained are shown in Table 1. For comparison excitation and emission spectra of [Eu(tfac)3(H2O)2] were obtained under the same experimental condition and the results are shown in Fig. S11 and Tables S16 and S17 (ESI†). Eu-1 shows a high value of Ω2 ≈ 21.94 × 10⁻²⁰ cm2, indicative of lower symmetry with increased covalency between the Eu(III) ion and coordinated ligand29 compared to [Eu(tfac)3(H2O)2] (Ω2 ≈ 18.60 × 10⁻²⁰ cm2, Table S3, ESI†). The luminescence lifetime (τobs) of the 5D0 excited state in both the solid-state and in solution were determined by exciting the Eu-1 complex at λExmax and fitting of the decay profiles (Fig. S12 and S13, ESI†). The decay profiles could be fitted to mono-exponential function,τobs ≈ 960 ± 2.96 μs and 987 ± 1.06 μs, respectively, for the solid-state and DCM solution (Table 1) and is consistent with single major emitting species and attests to the results of steady-state measurement where only one line is observed for the 5D0 → 7F0 emission transition. The τobs for Eu-1 is almost 2.5- and 3.88-fold longer than [Eu(tfac)3(H2O)2] (τobs ≈ 384 μs for the solid-state and 254 μs for DCM solution, Table S17 and Fig. S14, S15, ESI†). This experimental fact could be related to the increase or decrease in the radiative (AR) and non-radiative (ANR) decay rates after coordination of the rigid ancillary DPEPO ligand. The values of AR and ANR are calculated using eqn (2)–(4) and the obtained data is shown in Table 1 and Table S17 (ESI†). The 2.5- and 3.88-fold increase in τobs for Eu-1 is due to the reduction in ANR ≈ 226.28–229.76 s−1 from 1844.87–3305.38 s−1. The other parameters for Eu-1 in DCM solution such as radiative lifetime (τrad) of 1276 μs, intrinsic quantum yield (QEuEu), of 77.32%, quantum yield (QLEu) of 55.00% and sensitization efficiency (ηsen) of 70% are calculated with the help of eqn (5)–(7) and are gathered in Table 1.
| Ω 2 (×10−20 cm2) | Ω 4 (×10−20 cm2) | FWHMb (nm) | τ obs (μs) | τ rad (μs) | A R (s−1) | A NR (s−1) | Q EuEu (%) | Q LEu (%) | η sen (%) | |
|---|---|---|---|---|---|---|---|---|---|---|
| a Calculated using eqn (1). b FWHM = Full Width at Half Maxima (5D0 → 7F0; 5D0 → 7F2). c Calculated using eqn (5). d Calculated using eqn (2) and (3). e Calculated using eqn (4); QEuEu is calculated using eqn (6); ηsen is calculated using eqn (7). | ||||||||||
| Solid-state | 21.94 | 6.06 | 1.09; 7.84 | 960 ± 2.96 | 1227 | 814.81 | 226.86 | 78.22 | — | — |
| DCM | 24.29 | 8.15 | 1.60; 10.21 | 987 ± 1.06 | 1276 | 783.41 | 229.76 | 77.32 | 55 | 70 |
The PL excitation and emission spectra of Tb-2 complex in the solid-state and in DCM solution together with those of [Tb(tfac)3(H2O)2] are shown in Fig. 4 and Fig. S16 (ESI†). The excitation spectra of Tb-2 show almost similar broad bands as observed in the case of Eu-2; however, the intensity is more than 7 times lower hinting at an inefficient ET from the organic ligand(s) to the central Tb(III) ion. The emission spectra shown in Fig. 4, display main emission transitions at 487 nm, 545 nm, 586 nm, 623 nm (values are for Tb-2 complex in the solid-state) which are assigned to 5D4 → 7FJ as shown in Fig. 4. The emission spectra are dominated by a 5D4 → 7F5 transition; however, the intensity of this transition in the case of Tb-2 (greenish-yellow emission, Fig. S17, ESI†) in the solid-state is marginally lower compared to [Tb(tfac)3(H2O)2] (green emission, Fig. S17, ESI†) suggesting that the replacement of the water molecules by DPEPO has a detrimental effect on the emission intensity. Furthermore, the emission of Tb-2 in DCM solution decreased dramatically (6.32 times) compared to the emission in the solid-state. The τobs of 5D4 were determined by the decay profiles of the Tb-2 and [Tb(tfac)3(H2O)2] (Fig. S18–S20, ESI†). The lifetime of Tb-2 [τobs ≈ (268.12 μs)solid-state and (24.32 μs)DCM] is shorter than that of [Tb(tfac)3(H2O)2] (384.45 μs). The QLTb of Tb-2 in the solid-state and in DCM solution were determined using the calibrated integrating sphere method and the experimental details are provided in the ESI.† Despite the short lifetime of Tb-2, its QLTb in the solid-state and in DCM solution is 53.00% and 48.00%, respectively. A plausible explanation could be due to the electronic structure of Tb(III) that has many levels including a relatively low-lying 4f–5d state, which can combine with the ligand wave functions. This explains the relatively short lifetime of Tb-2.30
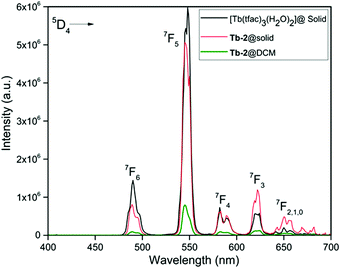 | ||
| Fig. 4 Corrected emission spectra of Tb-2 complex in the solid-state and in DCM together with that of [Tb(tfac)3(H2O)2] (solid-state) at room temperature. | ||
3.4. Electroluminescence performance and chromaticity of OLEDs
To characterize EL properties of the Eu-1 and Tb-2 complexes, a series of single- and double- light-emitting layer devices with the following structure were fabricated;The doping concentration for Eu-1 complex was modulated to be 1.0 wt%, 2.0 wt%, 3.0 wt%, 4.0 wt%, 5.0 wt%, and 6.0 wt%, respectively, while the doping concentration for Tb-2 complex was 8.0 wt%, 10.0 wt%, 12.0 wt%, 14.0 wt%, and 16.0 wt%, respectively. As the doping concentration increases, the evaporation temperature increases gradually from 131 to 137 °C and 138 to 146 °C for Eu-1 and Tb-2, respectively. The low thermal evaporation temperature of the complexes thus ensures negligible decomposition of the complexes during the thermal evaporation process (Td ≈ 287 °C as determined by the TGA, Fig. 1).
For Eu-1, as listed in Table 2, single-EML devices displayed relatively higher EL performances compared with double-EMLs devices; however, the devices displayed color tunability from bluish-magenta (CIE, x: 0.444; y: 0.218) to light red (CIE, x: 0.574; y: 0.275) as shown Table 2 and in Fig. S21 (ESI†). The 5.0 wt% single-EML device obtained the highest current efficiency and power efficiency of 0.95 cd A−1 and 0.78 lm W−1, respectively, while the 3.0 wt% single-EML device obtained the highest brightness of 1358 cd m−2. Increasing the doping concentration of Eu-1 in both single- and double-EML devices increases the relative intensity of Eu(III) emission (≈612 nm) as shown in Fig. 5 and Fig. S22 (ESI†). However, pure monochromatic Eu(III) emission was not realized due to the presence of host emission (exciplex emission originating from the recombination of accumulated holes on TAPC and accumulated electrons on 26DCzPPy molecules), though the 4.0 wt% single-EML device displays light red (CIE, x: 0.574; y: 0.275) emission with brightness of 1274 cd m−2, current efficiency and power efficiency of 0.58 cd A−1 and 0.68 lm W−1, respectively. This could be attributed to the inefficient carriers trapping or the incomplete ET. It is important to emphasize that these EL performances are remarkably at very low Vturn-on ≈ 3.1–3.8 V, and therefore, advantageous in lowering the power consumption of the OLED display, which is an important issue. The EL performances of the devices compare well with the similar type of Eu(III) complexes with P![[double bond, length as m-dash]](https://www.rsc.org/images/entities/char_e001.gif) O ligands.15,31
O ligands.15,31
| Device | V turn-on (V) | B (cd m−2) | η c (cd A−1) | η p (lm W−1) | EQEd (%) | CIEx,ye |
|---|---|---|---|---|---|---|
| The values in the square brackets are properties of double EML devices at different concentration.a The data for maximum brightness (B).b Maximum current efficiency (ηc).c Maximum power efficiency (ηp).d Maximum external quantum efficiency (EQE).e CIEx,y at 10 mA cm−2. | ||||||
| 1.0 wt% | 3.1 [3.3] | 1286 [1244] | 0.53 [0.74] | 0.46 [0.63] | 0.4 [0.9] | (0.375, 0.196); [0.444, 0.218] |
| 2.0 wt% | 3.3 [3.3] | 1281 [1011] | 0.67 [0.90] | 0.57 [0.78] | 0.5 [1.1] | (0.462, 0.230); [0.533, 0.253] |
| 3.0 wt% | 3.4 [3.8] | 1358 [1058] | 0.69 [0.63] | 0.48 [0.48] | 0.6 [0.8] | (0.511, 0.257); [0.539, 0.256] |
| 4.0 wt% | 3.4 [3.6] | 1274 [566] | 0.84 [0.58] | 0.68 [0.68] | 0.7 [0.7] | (0.526, 0.257); [0.574, 0.275] |
| 5.0 wt% | 3.5 [3.7] | 1272 [676] | 0.95 [0.59] | 0.78 [0.43] | 0.8 [0.7] | (0.560, 0.273); [0.554, 0.268] |
| 6.0 wt% | 3.8 [3.6] | 980 [565] | 0.51 [0.69] | 0.41 [0.53] | 0.4 [0.9] | (0.494, 0.244); [0.557, 0.257] |
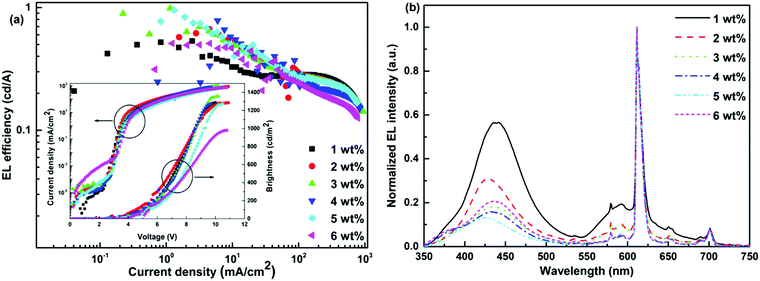
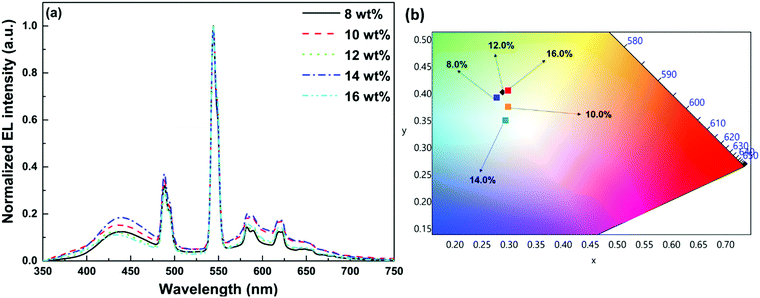
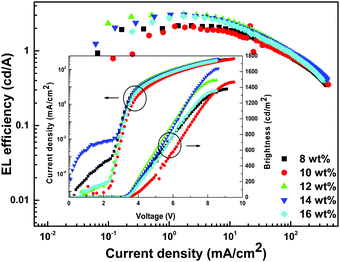
In order to establish proof of concept that we should be able to generate white-light from Tb-2 complex in the EL devices, we have used Tb-2 complex as EML to fabricate single- as well as double-EMLs devices with the same structure as Eu-1 but different doping concentrations. Normalized EL spectra of single- and double-EML devices are shown in Fig. 6a and Fig. S23 (ESI†). The emitting color of the double-EML devices displayed light cyan (CIE, x: 0.262; y: 0.408) to celeste (CIE, x: 0.252; y: 0.456) as shown in Fig. S24 (ESI†). The EL efficiency and current density curves together with the voltage (V)–brightness and current density curves as an inset is shown Fig. 7 and Fig. S25 (ESI†). The detailed performances of the single- and double-EML devices are shown in Table 3 and Table S18, ESI.† As shown in Table 3 and Table S18 (ESI†), single-EML devices displayed relatively higher brightness while double-EMLs devices displayed relatively higher EL efficiencies. The double-EML device with 12.0 wt% obtained a brightness of 1341 cd m−2, ηc ≈ 11.96 cd A−1, and ηp ≈ 11.02 lm W−1, respectively at low Vturn-on ≈ 3.3 V. Interestingly, as expected the single-EML devices with different doping concentration of Tb-2 complex displayed white-light emission with CIE color coordinates as shown in Fig. 6b and Table 3 at with low Vturn-on ≈ 2.9–3.3 V. The optimized single-EML device with 14.0 wt% doping concentration showed an impressive EL performances with the brightness of 1637 cd m−2, ηc ≈ 3.05 cd A−1, ηp ≈ 2.80 lm W−1 and Vturn-on ≈ 3.1 V, respectively. To the best of our knowledge a single-component W-OLED with a Tb(III) complex has not been reported previously.
| Device | V turn-on (V) | B a (cd m−2) | η c b (cd A−1) | η p c (lm W−1) | EQEd (%) | CIEx,ye |
|---|---|---|---|---|---|---|
| The superscripts have the same meaning as discussed in Table 2. | ||||||
| 8.0 wt% | 2.9 | 1378 | 2.16 | 1.94 | 0.9 | (0.277, 0.393) |
| 10.0 wt% | 3.3 | 1466 | 2.09 | 1.70 | 0.9 | (0.298, 0.376) |
| 12.0 wt% | 3.2 | 1491 | 3.06 | 2.83 | 1.2 | (0.288, 0.403) |
| 14.0 wt% | 3.1 | 1637 | 3.05 | 2.80 | 1.4 | (0.293, 0.351) |
| 16.0 wt% | 3.3 | 1357 | 2.89 | 2.53 | 1.2 | (0.298, 0.406) |
4. Conclusion
In summary, two new complexes [Eu(tfac)3(DPEPO)] and [Tb(tfac)3(DPEPO)] have been successfully synthesized on the gram scale and characterized. The EL devices fabricated from the new Eu-1 and Tb-2 complexes as EML displayed good performance. Double EML devices with Eu-1 as an EML displayed color-tunability from bluish-pink (CIE, x: 0.375; y: 0.196) to light pinkish-red (CIE, x: 0.574; y: 0.275). Single EML device with 3.0 wt% doping concentration displayed a brightness of 1358 cd m−2, current efficiency and power efficiency of 0.69 cd A−1 and 0.48 lm W−1, respectively, at very low Vturn-on ≈ 3.4 V. Single EML device with 14.0 wt% of Tb-2 exhibited impressive white EL (CIE, x: 0.293; y: 0.351) with brightness of 1637 cd m−2, ηc, ηp and EQE of 3.05 cd A−1, 2.80 lm W−1, 1.4%, respectively, at very low Vturn-on ≈ 3.1 V. To the best of our knowledge, this is the first report of a single component Tb(III) based W-OLED with impressive EL performances compared to Eu(III) based single component W-OLEDs (Table 4). Presently, synthesis of stable organo-lanthanide complexes containing a range of P![[double bond, length as m-dash]](https://www.rsc.org/images/entities/char_e001.gif) O and N,N-donors ligands to improve the EL properties are in progress in our laboratory. Some of the preliminary results are encouraging. Moreover, we are also exploring other organo-Tb(III) complexes to achieve high performance single component W-OLEDs.
O and N,N-donors ligands to improve the EL properties are in progress in our laboratory. Some of the preliminary results are encouraging. Moreover, we are also exploring other organo-Tb(III) complexes to achieve high performance single component W-OLEDs.
| Complex | B a (cd m−2) | V turn-on (V) | η p c (lm W−1) | CIEe | Ref. |
|---|---|---|---|---|---|
| Superscripts a, c an e have the same meanings as in Table 2. | |||||
| Tb-2 | 1637 | 3.1 | 2.80 | 0.293; 0.351 | This work |
| [Eu(TCPD)3Phen] | 229 | 20.5 | 0.2 (10.5 V) | 0.333; 0.348 | 11 |
| [Eu(tta)3L] | 945.1 | 16 | — | 0.337; 0.362 | 12 |
| [Eu2(tta)6]bpm | 19.7 | 7.6 | — | 0.350; 0.330 | 13 |
| NBu4[Eu(L1)4] | 1547 (13.1 V) | 2.53 (6.4 V) | 0.337; 0.328 (8 V) | 14 | |
Conflicts of interest
The authors declare no conflicting interests.Acknowledgements
MSK acknowledges His Majesty's Trust Fund for Strategic Research (Grant No. SR/SQU/SCI/CHEM/16/02) for funding. RI thanks HM's Trust Fund for a post-doctoral fellowship. PRR is grateful to the Engineering and Physical Sciences Research Council (EPSRC, UK) for funding (EP/K004956/1). WYW thanks the Hong Kong Polytechnic University (1-ZE1C) and the Endowed Professorship in Energy from Ms Clarea Au (847S) for the financial support. LZ is grateful to the financial aid from National Natural Science Foundation of China (21771172), Youth Innovation Promotion Association of Chinese Academy of Sciences (2013150).References
- (a) M. Pan, W.-M. Liao, S.-Y. Yin, S.-S. Sun and C.-Y. Su, Chem. Rev., 2018, 118, 8889–8935 CrossRef CAS PubMed; (b) S. SeethaLekshmi, A. R. Ramya, M. L. P. Reddy and S. Varughese, J. Photochem. Photobiol., C, 2017, 33, 109–131 CrossRef CAS; (c) G. M. C. K. Anne and M. Klaus, Adv. Mater., 2011, 23, 233–248 CrossRef PubMed; (d) G. M. Farinola and R. Ragni, Chem. Soc. Rev., 2011, 40, 3467–3482 RSC; (e) L. Ying, C.-L. Ho, H. Wu, Y. Cao and W.-Y. Wong, Adv. Mater., 2014, 26, 2459–2473 CrossRef CAS PubMed.
- (a) X. Ma, J. Li, C. Lin, G. Chai, Y. Xie, W. Huang, D. Wu and W. Y. Wong, Phys. Chem. Chem. Phys., 2019, 21, 14728–14733 RSC; (b) C. L. Ho and W. Y. Wong, Top. Curr. Chem., 2016, 374, 64 CrossRef; (c) A. Zhang, B. Wang, Q. Yan, Y. Wang, J. Jia, H. Jia, B. Xu and W.-Y. Wong, Opt. Mater. Express, 2018, 8, 3635–3652 CrossRef CAS; (d) Y. He, L. Liu, G. Fu, W. Li, X. Lü, H. He and W.-Y. Wong, J. Mater. Chem. C, 2019, 7, 4800–4807 RSC.
- (a) R. Ilmi, M. S. Khan, Z. Li, L. Zhou, W.-Y. Wong, F. Marken and P. R. Raithby, Inorg. Chem., 2019, 58, 8316–8331 CrossRef CAS PubMed; (b) J.-C. G. Bünzli, in Handbook on the Physics and Chemistry of Rare Earths, ed. J.-C. G. Bünzli and V. K. Pecharsky, Elsevier, 2016, vol. 50, pp. 141–176 Search PubMed.
- (a) X. Yao, P. Yan, G. An, Y. Li, W. Li and G. Li, Dalton Trans., 2018, 47, 3976–3984 RSC; (b) J. Long, Y. Guari, R. A. S. Ferreira, L. D. Carlos and J. Larionova, Coord. Chem. Rev., 2018, 363, 57–70 CrossRef CAS.
- (a) Y. Yang, H. Huang, Y. Wang, F. Qiu, Y. Feng, X. Song, X. Tang, G. Zhang and W. Liu, Dalton Trans., 2018, 47, 13384–13390 RSC; (b) J. Rocha, C. D. S. Brites and L. D. Carlos, Chem. – Eur. J., 2016, 22, 14782–14795 CrossRef CAS; (c) C. D. S. Brites, A. Millán and L. D. Carlos, in Handbook on the Physics and Chemistry of Rare Earths, ed. B. Jean-Claude and P. Vitalij, Elsevier, 2016, vol. 49, pp. 339–427 Search PubMed.
- (a) W.-H. Huang, J. Ren, Y.-H. Yang, X.-M. Li, Q. Wang, N. Jiang, J.-Q. Yu, F. Wang and J. Zhang, Inorg. Chem., 2019, 58, 1481–1491 CrossRef CAS; (b) J. A. Smith, M. A. Singh-Wilmot, K. P. Carter, C. L. Cahill and J. A. Ridenour, Cryst. Growth Des., 2018, 19, 305–319 CrossRef.
- (a) H. Xu, K. Yin and W. Huang, Chem. – Eur. J., 2007, 13, 10281–10293 CrossRef CAS PubMed; (b) G. Yu, F. Ding, H. Wei, Z. Zhao, Z. Liu, Z. Bian, L. Xiao and C. Huang, J. Mater. Chem. C, 2016, 4, 121–125 RSC; (c) J. Wang, C. Han, G. Xie, Y. Wei, Q. Xue, P. Yan and H. Xu, Chem. – Eur. J., 2014, 20, 11137–11148 CrossRef CAS PubMed.
- J. Kido, W. Ikeda, M. Kimura and K. Nagai, Jpn. J. Appl. Phys., 1996, 35, L394–L396 CrossRef CAS.
- W. G. Quirino, C. Legnani, M. Cremona, P. P. Lima, S. A. Junior and O. L. Malta, Thin Solid Films, 2006, 494, 23–27 CrossRef CAS.
- P. P. Lima, F. A. A. Paz, C. D. S. Brites, W. G. Quirino, C. Legnani, M. Costa e Silva, R. A. S. Ferreira, S. A. Junior, O. L. Malta, M. Cremona and L. D. Carlos, Org. Electron., 2014, 15, 798–808 CrossRef CAS.
- S. Li, G. Zhong, W. Zhu, F. Li, J. Pan, W. Huang and H. Tian, J. Mater. Chem., 2005, 15, 3221–3228 RSC.
- G.-L. Law, K.-L. Wong, H.-L. Tam, K.-W. Cheah and W.-T. Wong, Inorg. Chem., 2009, 48, 10492–10494 CrossRef CAS.
- G. Zucchi, T. Jeon, D. Tondelier, D. Aldakov, P. Thuery, M. Ephritikhine and B. Geffroy, J. Mater. Chem., 2010, 20, 2114–2120 RSC.
- S. Biju, L.-J. Xu, C.-Z. Sun and Z.-N. Chen, J. Mater. Chem. C, 2015, 3, 5775–5782 RSC.
- H. Xu, L.-H. Wang, X.-H. Zhu, K. Yin, G.-Y. Zhong, X.-Y. Hou and W. Huang, J. Phys. Chem. B, 2006, 110, 3023–3029 CrossRef CAS PubMed.
- (a) E. Busby, J. Xia, Q. Wu, J. Z. Low, R. Song, J. R. Miller, X. Y. Zhu, L. M. Campos and M. Y. Sfeir, Nat. Mater., 2015, 14, 426 CrossRef CAS; (b) Q. Zhang, B. Li, S. Huang, H. Nomura, H. Tanaka and C. Adachi, Nat. Photonics, 2014, 8, 326 CrossRef CAS.
- M. C. Burla, R. Caliandro, M. Camalli, B. Carrozzini, G. L. Cascarano, L. De Caro, C. Giacovazzo, G. Polidori, D. Siliqi and R. Spagna, J. Appl. Crystallogr., 2007, 40, 609–613 CrossRef CAS.
- G. Sheldrick, Acta Crystallogr., Sect. A: Found. Adv., 2015, 71, 3–8 CrossRef PubMed.
- O. V. Dolomanov, L. J. Bourhis, R. J. Gildea, J. A. K. Howard and H. Puschmann, J. Appl. Crystallogr., 2009, 42, 339–341 CrossRef CAS.
- R. Ilmi, S. Kansız, N. Dege and M. S. Khan, J. Photochem. Photobiol., A, 2019, 377, 268–281 CrossRef CAS.
- T. Koizuka, M. Yamamoto, Y. Kitagawa, T. Nakanishi, K. Fushimi and Y. Hasegawa, Bull. Chem. Soc. Jpn., 2017, 90, 1287–1292 CrossRef CAS.
- (a) J. L. Hoard and J. V. Silverton, Inorg. Chem., 1963, 2, 235–242 CrossRef CAS; (b) E. L. Muetterties and C. M. Wright, Q. Rev., Chem. Soc., 1967, 21, 109 RSC.
- (a) K. L. Nash, R. D. Rogers, J. Ferraro and J. Zhang, Inorg. Chim. Acta, 1998, 269, 211–223 CrossRef CAS; (b) U. Englert, B. Ganter, T. Wagner and W. Kläui, Z. Anorg. Allg. Chem., 1998, 624, 970–974 CrossRef CAS.
- (a) J. Huang, H.-M. Ding, Y. Xu, D. Zeng, H. Zhu, D.-M. Zang, S.-S. Bao, Y.-Q. Ma and L.-M. Zheng, Nat. Commun., 2017, 8, 2131 CrossRef; (b) K. H. Zangana, E. M. Pineda and R. E. P. Winpenny, Dalton Trans., 2014, 43, 17101–17107 RSC.
- M. Latva, H. Takalo, V. M. Mukkala, C. Matachescu, J. C. RodriguezUbis and J. Kankare, J. Lumin., 1997, 75, 149–169 CrossRef CAS.
- S. Sato and M. Wada, Bull. Chem. Soc. Jpn., 1970, 43, 1955–1962 CrossRef CAS.
- Y. Zheng, J. Lin, Y. Liang, Y. Yu, Y. Zhou, C. Guo, S. Wang and H. Zhang, J. Alloys Compd., 2002, 336, 114–118 CrossRef CAS.
- (a) R. Ilmi, A. Haque and M. S. Khan, J. Photochem. Photobiol., A, 2019, 370, 135–144 CrossRef CAS; (b) R. Ilmi, S. Anjum, A. Haque and M. S. Khan, J. Photochem. Photobiol., A, 2019, 383, 111968 CrossRef CAS.
- C. Görller-Walrand and K. Binnemans, in Handbook on the Physics and Chemistry of Rare Earths, Elsevier, 1998, vol. 25, pp. 101–264 Search PubMed.
- S. Biju, M. L. P. Reddy, A. H. Cowley and K. V. Vasudevan, J. Mater. Chem., 2009, 19, 5179–5187 RSC.
- (a) H. Xu, K. Yin and W. Huang, J. Phys. Chem. C, 2010, 114, 1674–1683 CrossRef CAS; (b) H. Xu, K. Yin, L. Wang and W. Huang, Thin Solid Films, 2008, 516, 8487–8492 CrossRef CAS.
Footnote |
| † Electronic supplementary information (ESI) available. CCDC 1942486 and 1942487. For ESI and crystallographic data in CIF or other electronic format see DOI: 10.1039/c9tc04653d |
| This journal is © The Royal Society of Chemistry 2019 |

