
 Open Access Article
 This Open Access Article is licensed under a
 Creative Commons Attribution 3.0 Unported Licence
Fluorescent chemodosimeters for fluoride ions via silicon-fluorine chemistry: 20 years of progress
Pengpeng
Chen
a,
Wei
Bai
b and
Yinyin
Bao
 *c
*c
aSchool of Chemistry & Chemical Engineering, Anhui University, Hefei 230601, China
bInstitute of Physical Science and Information Technology, Anhui University, Hefei 230601, China
cInstitute of Pharmaceutical Sciences, Department of Chemistry and Applied Biosciences, ETH Zurich, 8093 Zurich, Switzerland. E-mail: yinyin.bao@pharma.ethz.ch
First published on 6th September 2019
Abstract
Since the first report of an F− fluorescent chemodosimeter based on Si–F chemistry, this sensing strategy will have reached two decades of progress by 2020; especially in the last ten years an explosion of the research in this field was observed. In this review, we will emphasize representative examples during different important stages in this field, provide critical commentary on the sensing performance of various developed chemodosimeters, imaging agents and nanosensors, point out the shortcomings and limitations of current systems, and give a perspective on possible future research directions after twenty years of evolvement.
 Pengpeng Chen | Pengpeng Chen is an associate professor in the School of Chemistry & Chemical Engineering at Anhui University. He received his PhD degree in Polymer Chemistry and Physics (2013) from Nanjing University. From 2013 he became a lecturer in Anhui University, and he was promoted to associate professor from January 2017. His research focus is on functional polymer nanocomposites, plastic modification, functional microspheres and microcapsules, and fluorescent materials. |
 Wei Bai | Dr Wei Bai has been a Professor at the Institute of Physical Science and Information Technology of Anhui University since 2018. He received his PhD (2014) from the Department of Chemistry of Louisiana State University – Baton Rouge and worked as a Postdoctoral Research Associate at the University of Massachusetts and the University of Tennessee for three years before joining the Anhui University. His area of interest focuses on the synthesis of novel polymeric and supramolecular materials, especially organic 2D polymers and functional fluorescent molecules. |
 Yinyin Bao | Yinyin Bao is a group leader in the Institute of Pharmaceutical Science at ETH Zürich. He received a PhD degree in Polymer Chemistry from the University of Science and Technology of China (2012). After he completed postdoctoral research at KU Leuven, and he became a Marie Curie IntraEurapean Fellow at CNRS & University of Paris Sud. In 2016 he joined ETH Zürich, and he was promoted to a Senior Scientist position in late 2018. His research interest remains the application of synthetic molecules and polymers in biomedical areas, such as fluorescent sensing and imaging, drug delivery, 3D printed medical devices, etc. |
Introduction
The detection and analysis of anions have been extensively used in various fields including environmental science, pharmaceutical science, and biomedical science.1 As the smallest and an extremely electronegative anion, fluoride has a high charge density and unique chemical properties.2 Fluoride is widely applied in dental healthcare and the pharma industry, however, F− with concentrations above 1.5 mg L−1 (79 μM) in drinking water can cause dental fluorosis and/or skeletal fluorosis, as defined by the WHO.2b The presence of F− ions in soil can also cause a negative influence on the size of the microbial community.2c Therefore, F− sensing and detection is no doubt of great importance for both human health and environment protection. Numerous analytical methods have been developed for the detection of fluoride, including mass spectrometry, atomic absorption spectrophotometry, ion selective electrode analysis, 19F NMR spectral analysis and ion chromatography.3 Apparently, these methods require cumbersome equipment and/or complicated procedures at high cost. On the contrary, the sensing signal based on absorption or fluorescence can be easily captured, which can even be detected by the “naked eye”.4 Particularly, fluorescent chemosensors have attracted much attention due to their simplicity, high sensitivity and selectivity, and real-time detection, which enable the in vitro and in vivo sensing of fluoride ions in the biological environment.5In general, three main strategies have been employed for the design of fluorescent and chromogenic F− sensors. The first one is to synthesize F− receptors based on Lewis-acidic boron owing to the strong affinity of boron–fluorine,6,7 and the second one is to develop synthetic molecules that can form strong hydrogen-bonds with fluoride.8–10 However, their sensing performance usually dramatically declines for detection in aqueous environments, due to the competition of water molecules for the interaction with F−. In addition, these methods also suffer from interference from other anions.1 Compared with simple complexation and hydrogen bonding, chemical reaction-based fluorescent sensors, so called fluorescent chemodosimeters, exhibit higher sensing selectivity and stronger resistance in aqueous environments.11,12 Organosilicon groups have been extensively used as protective groups for alcohols and phenols in organic chemistry, while fluoride is the most efficient deprotection reagent working at very mild conditions, via the formation of strong Si–F bonds.13 Benefiting from this significant reaction, more and more fluorescent chemodosimeters for fluoride ions have been developed, which evolved from detection in organic solvents, to detection in water, to in vitro sensing, and even to in vivo imaging. Since the first report of a fluoride sensor based on Si–F chemistry by K. Tamao and coworkers,14 this sensing strategy will have reached two decades of progress by 2020, with an explosion of the research in this field observed in the last ten years. As a witness of and also a contributor to the development in such an exciting research area, we take this precious opportunity to give a summary of and perspective on the twenty years of evolvement (Scheme 1). We would like to emphasize representative examples during different important stages in this field, instead of listing all of the published chemical sensors. Two more comprehensive reviews relevant to this topic can be found somewhere else,5a,b which comprise most of the chemical structures that have been used as the fluorophore scaffold for F− chemodosimeters. In this review, we will provide a critical commentary on the sensing performance of selected typical chemodosimeters, imaging agents and nanosensors that will help readers better recognize the shortcomings and limitations of current systems, and also identify possible future research directions.
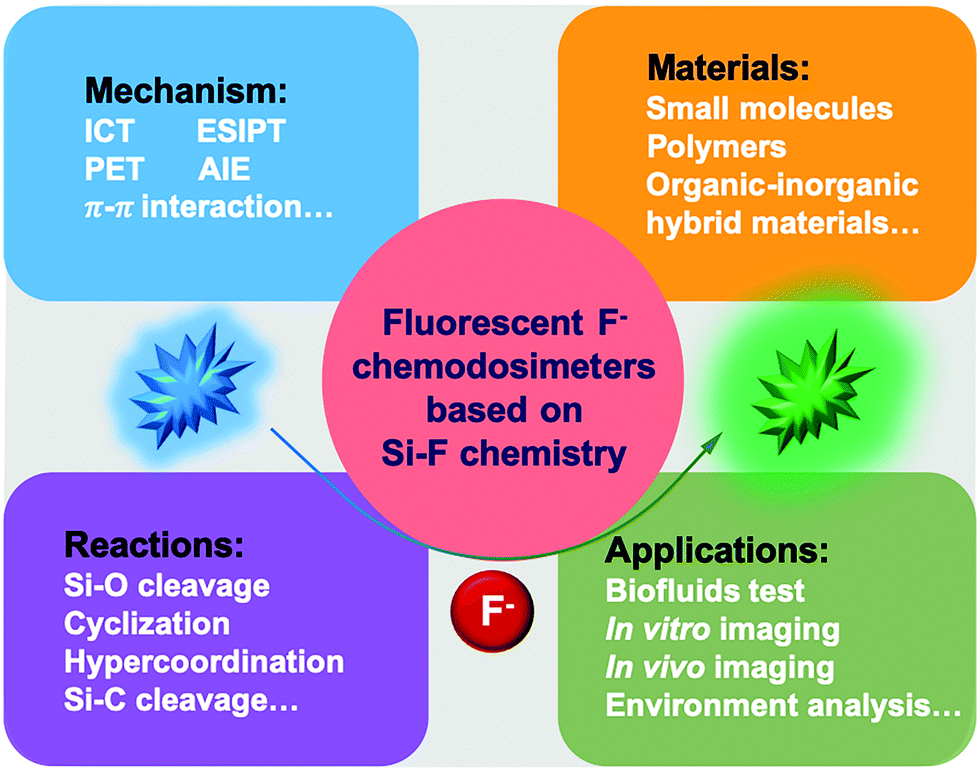 | ||
| Scheme 1 Schematic overview of fluorescent F− chemodosimeters based on Si–F chemistry involving the mechanism, materials, reactions and applications. | ||
The early stage
In 2000, Tamao and coworkers14 reported an organosilicon compound, trianthrylfluorosilane 1, which can be reacted into a difluoro compound in the presence of KF/[2.2.2]cryptand. They compared two compounds by single crystal analysis, and the product revealed obvious structure changes owing to the hypercoordination caused by additional fluoride (Fig. 1). Then they directly added n-Bu4NF (TBAF) into the THF solution of 1, a new band appeared in the UV-Vis absorption spectra, and the fluorescence intensity dramatically increased with the quantum yield Φf reaching 0.64 from 0.033. This notable fluorescence change can be observed by the “naked eye” under UV irradiation. As the very first example of fluorescent chemodosimeters for fluoride, this work opened new perspectives for the design of unprecedented F− chemical sensors.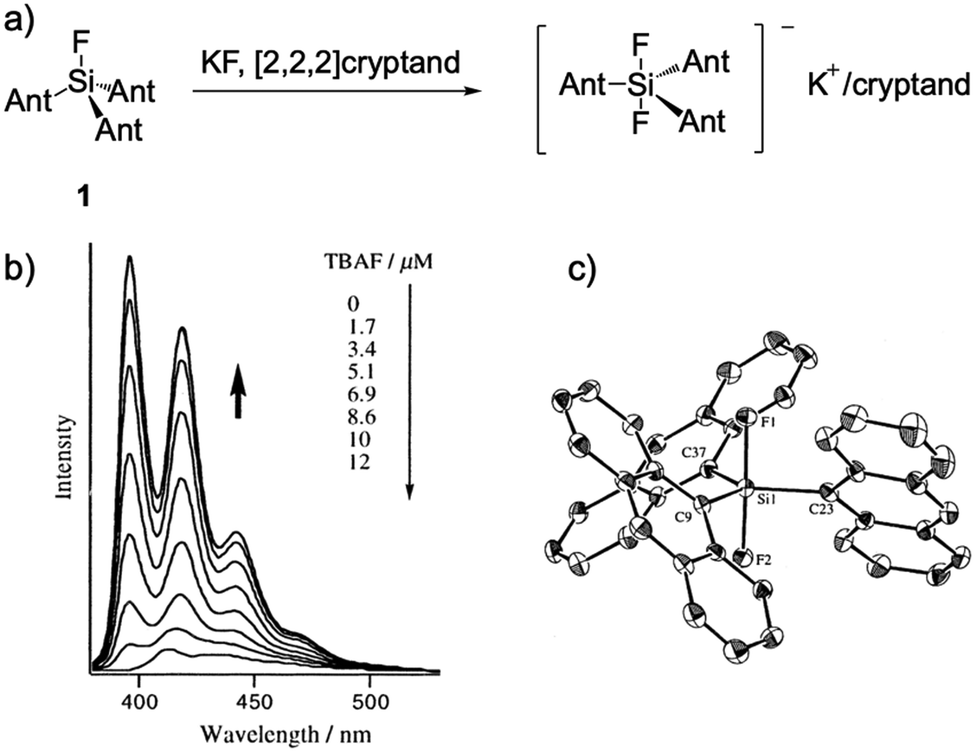 | ||
| Fig. 1 (a) Reaction scheme of F− sensor 1. (b) Fluorescence titration of 1 with TBAF in THF, [1] = 0.2 μM. (c) Single crystal structure of the complex, K+/[2.2.2]cryptand is omitted for clarity. Reproduced with permission from ref. 14. Copyright 2000, American Chemical Society. | ||
Two years later, Martínez-Máñez and coworkers15 prepared a series of fluorescent dye-immobilized mesoporous silica materials as F− sensors (2, 3 and 4). In the presence of fluoride ions, the Si–O bond of the silica materials can be hydrolyzed due to the formation of HF in low pH conditions, then the dye molecules can be released into the solution. By measurement of the absorption or fluorescence intensity changes, the environmental F− concentration can be calculated. They successfully applied this method to determine the F− amount in a commercial toothpaste sample. The detection was carried out in out in strongly acidic CH3CN–water (70/30, v/v) solutions with pH 2.5, which enabled the formation of HF (pKa = 3.2) to accelerate the hydrolysis. Due to the limitation of the process, the response time is quite long (2 h of stirring) and the detection limit is higher than the micromolar level (Fig. 2).
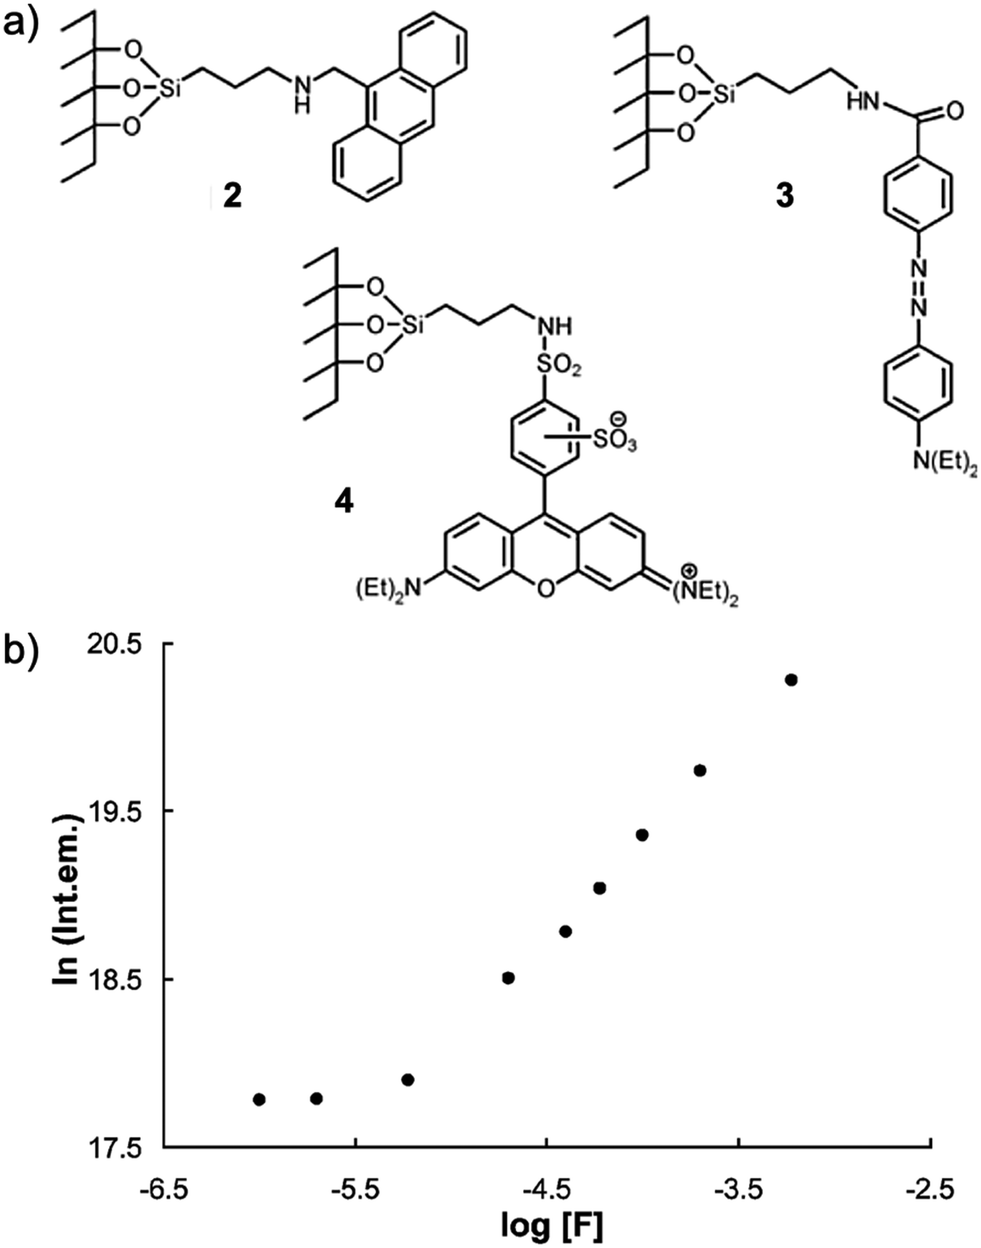 | ||
| Fig. 2 (a) Structures of F− sensors 2, 3 and 4 after functionalization of an MCM-41 matrix firstly with 3-aminopropyltriethoxysilane and then with 9-anthraldehyde, lissamine rhodamine B sulfonyl chloride and 4-{2-[4-(dimethylamino)phenyl]diazenyl}benzoic acid, respectively. (b) Evolution of the fluorescence intensity of anthracene in the final solution (after fluoride attack on sensor 1) vs. the concentration of fluoride in the initial solution. Reproduced with permission from ref. 15. Copyright 2002, Royal Society of Chemistry. | ||
Since E. J. Corey16 introduced tert-butyldimethylsilyl (TBDMS) as an efficient protective group for the first time, TBDMS has been widely used for the synthesis of derivatives of phenol and alcohol, together with its analogues the tert-butyldiphenylsilyl (TBDPS) and triisopropylsilyl (TIPS) groups. In 2003, Swager and coworkers17 synthesized a π-conjugated polymer 5 containing the TIPS group, which underwent a ring-closing reaction induced by F−, showing variations of both emission intensity and wavelength (Fig. 3). The polymer had a much faster signal response compared to its monomer analogue, benefiting from the “molecular wire” effect.18 However, a reaction time of 2 h was still needed to achieve the saturation of the fluorescence intensity. Even though the sensing performance is far from satisfactory, this work represented the first example of an organosilyl ether-based fluorescent chemodosimeter for F−, and no doubt this polymer is also the first polymeric F− sensor based on a Si–F chemical reaction (Fig. 3).
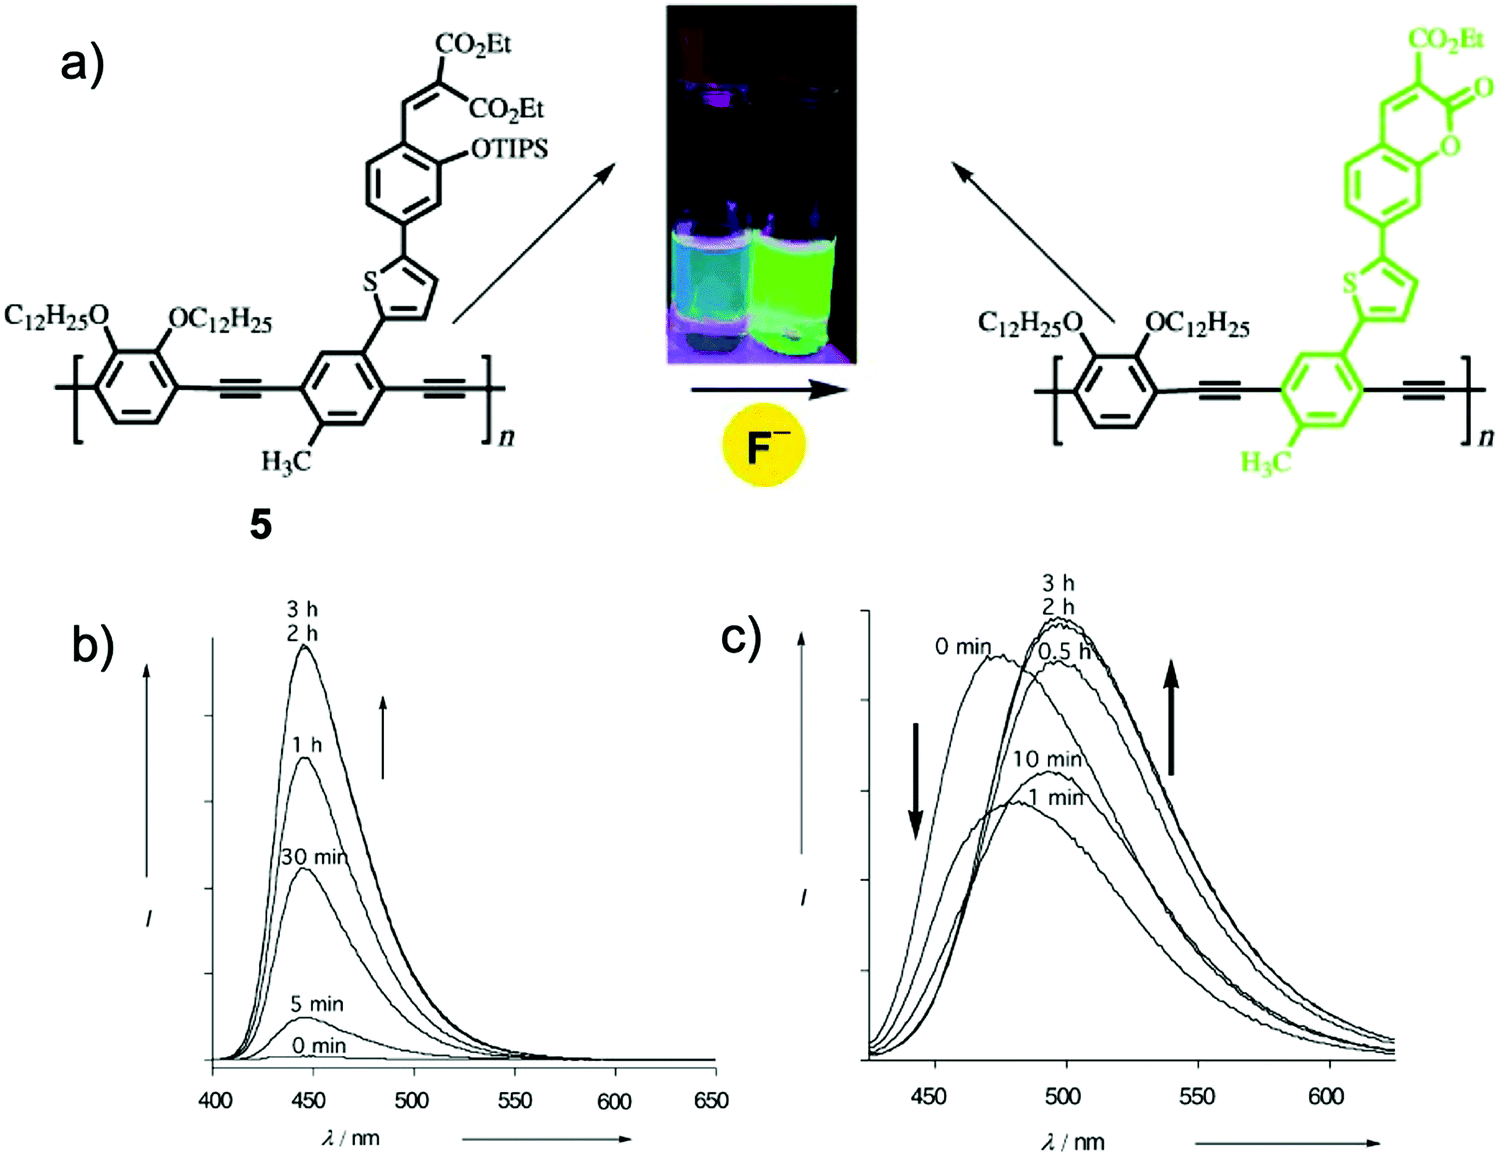 | ||
| Fig. 3 (a) Reaction scheme of polymer sensor 5 with F−. Inset: Photos of the polymer solution under UV before and after addition of F−. (b) Emission spectra changes of the monomer analogue (MA), [MA] = 3.2 μM in THF with TBAF (33 μM). (c) Emission spectra changes of the polymer, [5] = 1.5 μM in CH2Cl2 (repeating group concentration) with TBAF (0.16 μM). Reproduced with permission from ref. 17. Copyright 2003, John Wiley and Sons. | ||
In 2005, Xu and coworkers19 synthesized a TBDMS-protected cyanine dye 6, which exhibited excellent sensing properties for NaF in THF–water (70/30, v/v, pH = 9.0). From a UV-vis absorption titration experiment, the detection limit was determined to be 0.1 μM and a clear color change of the solution can be observed. The authors assigned this phenomenon to an intramolecular charge transfer (ICT) transition, for the first time. Note that the introduction of the TBDMS group greatly reduced the impact of pH on the absorption signal. Although the fluorescence properties were not recorded, this work unveiled the development of F− chemodosimeters based on organosilyl-containing small organic molecules (Fig. 4).
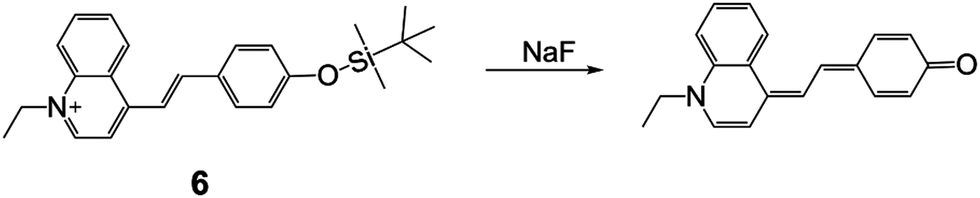 | ||
| Fig. 4 Reaction scheme of sensor 6 with NaF. | ||
Colorimetric and fluorescent F− chemodosimeters
Among all of the F− chemodosimeters based on organosilicon compounds, molecular sensors based on Si–O bond cleavage have exhibited great advantages and attracted most attention, which are usually based on the deprotection of TBDMS, TBDPS and TIPS groups. From 2007, a rapid growth of F− chemodosimeters based on organosilicon compounds appeared, which started from the first dual-modal chemodosimeter for detection of fluoride with both colorimetric and fluorescent responses, reported by the Hong group.20 This sensor showed both dramatic color changes (pale yellow to pink) and fluorescence switching behavior (200-fold enhancement) upon the addition of F− in CH3CN-HEPES buffer (50![[thin space (1/6-em)]](https://www.rsc.org/images/entities/char_2009.gif) :50, v/v, pH = 7.4) solutions, as shown in Fig. 5. Importantly, NaF can cause a similar signal output to that of TBAF, which is a great advantage for potential environmental or biological applications.
:50, v/v, pH = 7.4) solutions, as shown in Fig. 5. Importantly, NaF can cause a similar signal output to that of TBAF, which is a great advantage for potential environmental or biological applications.
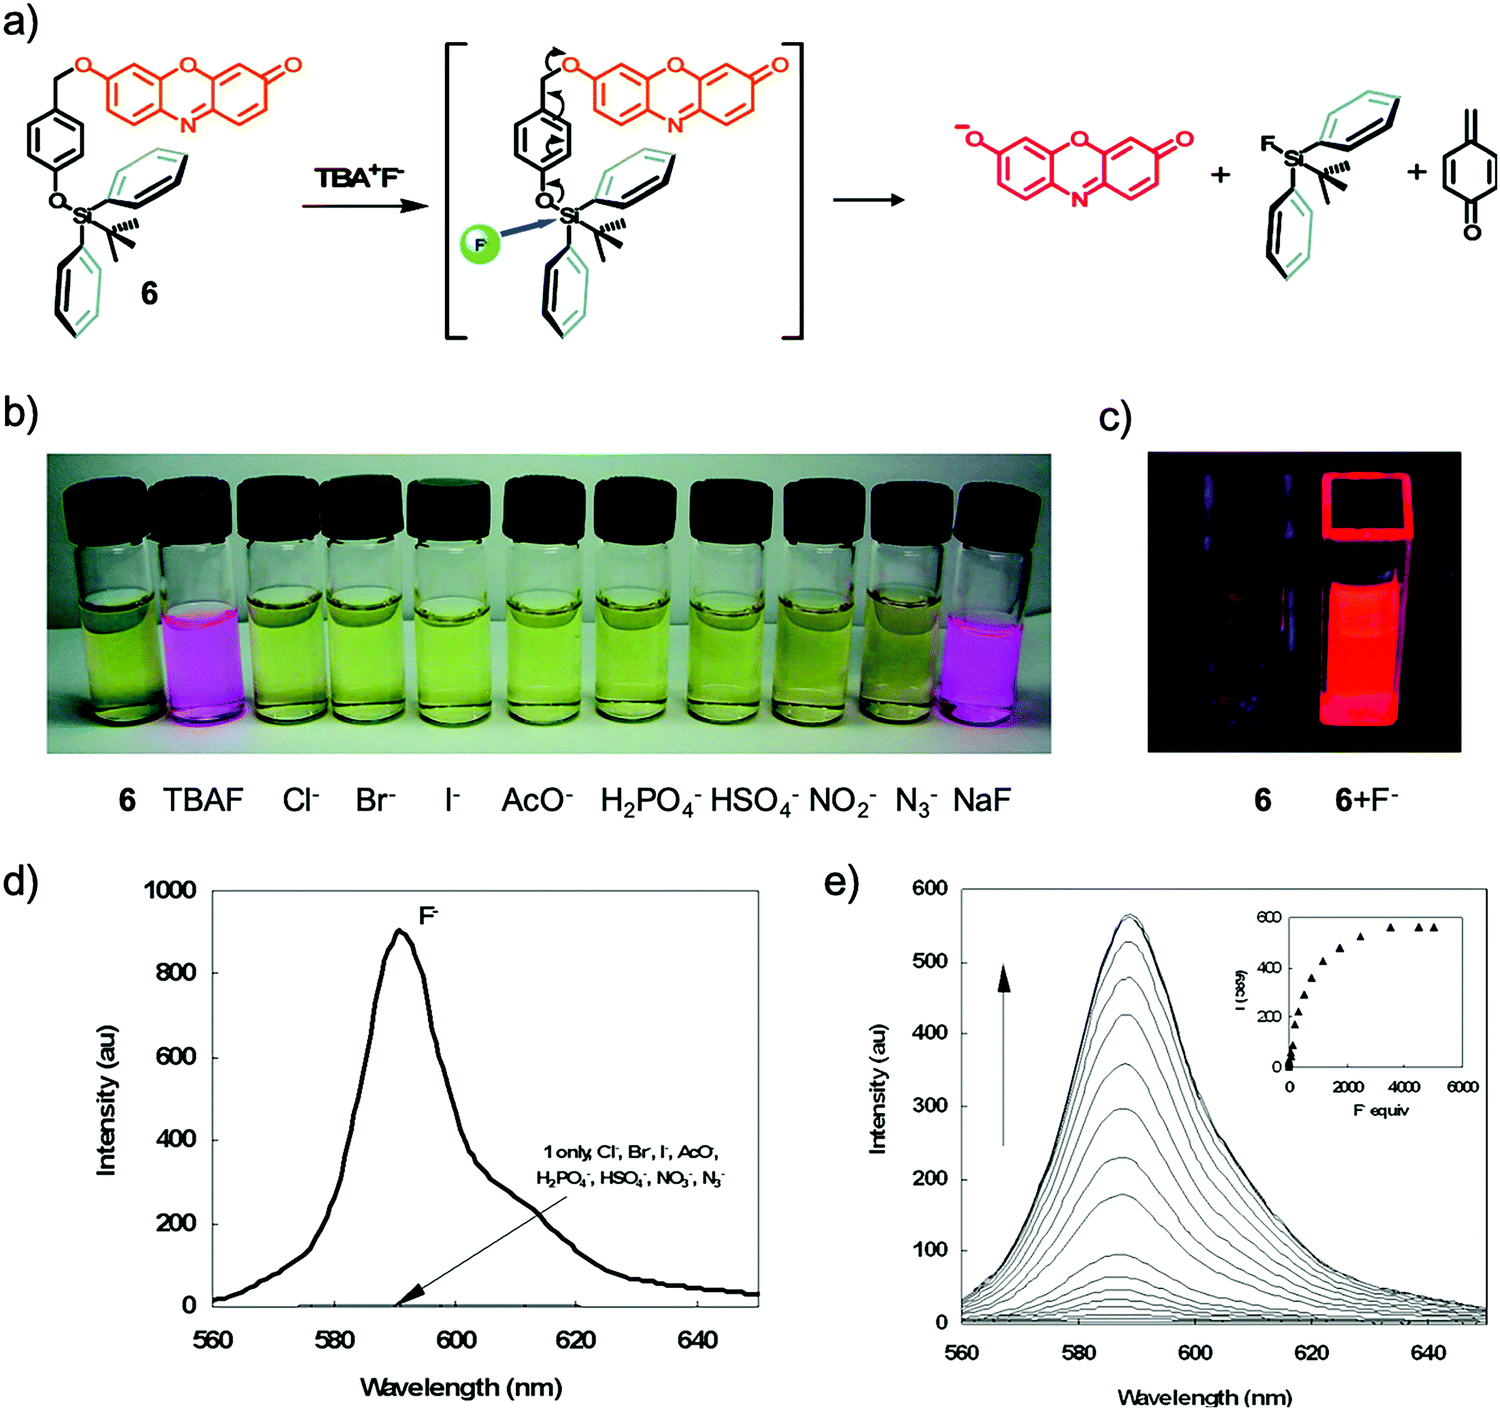 | ||
| Fig. 5 Sensing mechanism and performance of 6. (a) Reaction scheme of 6 with TBAF. (b) Color changes of 6 (5 μM) in CH3CN/H2O (50:50, v/v) after the addition of 3000 equiv. various anions. (c) Solution of 6 before and after addition of F− under a UV lamp (365 nm). (d) Comparison of the fluorescence emission spectra of 6 (0.5 μM) in acetonitrile after the addition of 1400 equiv. of various anions. (e) Fluorescence titration of 6 (5 μM) upon the addition of TBAF in CH3CN/H2O (50:50, v/v). Inset: Emission intensity change of 6 upon the addition of F− at 589 nm. Reproduced with permission from ref. 20. Copyright 2007, American Chemical Society. | ||
As shown in Fig. 5a, a feasible mechanism for the dual spectroscopic changes was proposed. When silicon atoms of the TBDPS group were selectively attacked by fluoride, the negative charge on the phenolate oxygen atom was increased after a cascade reaction, which resulted in the release of a resorufin anion. This mechanism was confirmed by identifying the same fluorescence emission of 7 + F− as that of resorufin Na+ salt in acetonitrile. The specific silicon–fluorine chemistry enables the high selectivity of 7 to F− against all the other anions. The authors claimed that the cleavage reaction in aqueous solution showed a time-dependent dosimetric response, however, the relevant data were not provided.
Two years later, the same group successfully developed another fluoride ion probe 8 with an ICT mechanism, based on the derivative of TBDPS-protected 7-hydroxycoumarin.21 This time the sensing can be carried out in pure water buffered by HEPES (pH = 7.4), while the emission enhancement induced by fluoride was recorded to be dependent on time, which required 4 h to reach saturation. They found the analogue with TBDMS as the protective group showed less significant performance in aqueous solution, which can be attributed to the lower steric effect to reduce the accessibility of water molecules to the silicon atom. The sensor 8 was successfully used for in vitro bioimaging of A549 human lung carcinoma cells, and no cytotoxicity was observed. Despite the fact that the imaging can only be performed when the cells were treated with a very high concentration of fluoride ions (50 mM NaF), and blue emission is not desirable in bioimaging, this work is the first example of an F− chemodosimeter realizing live cell imaging.
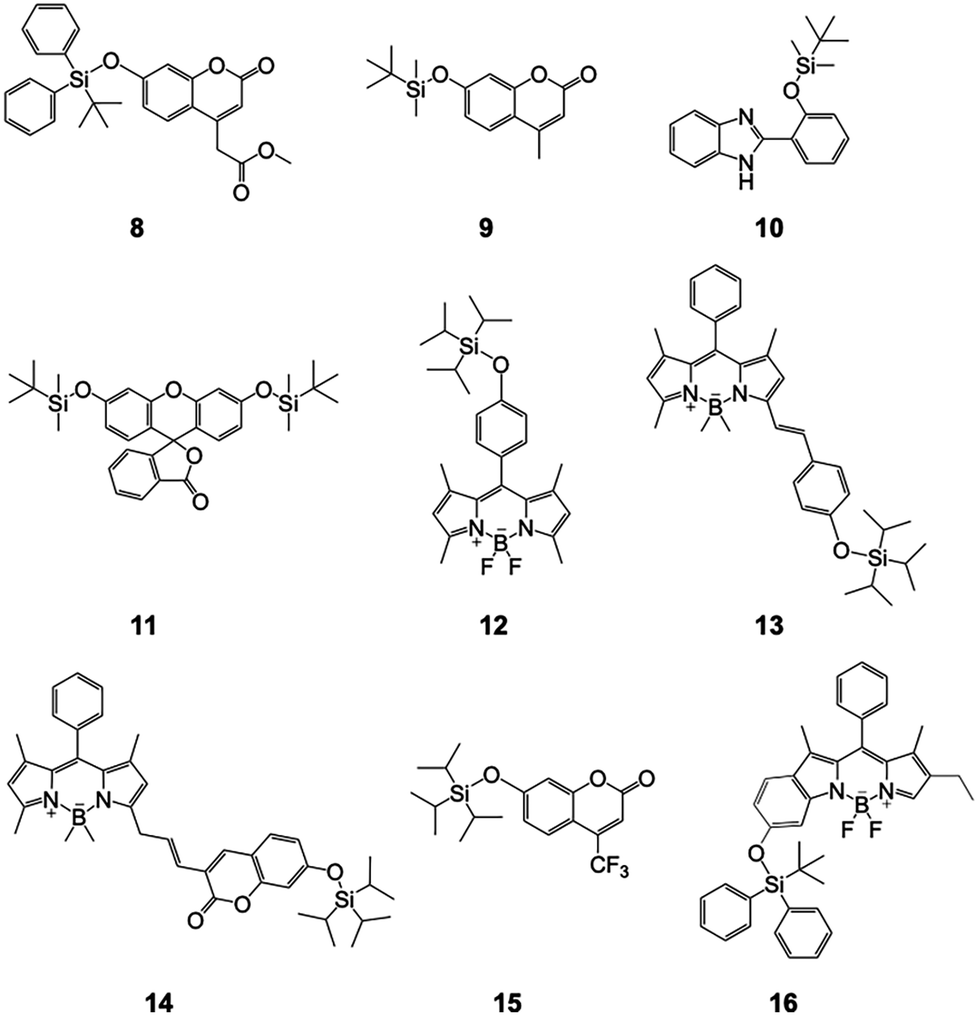
During this period, a series of F− chemodosimeters derivatized from coumarin (9, 14 and 15), boron-dipyrromethene (BODIPY, 12–14 and 16), and fluorescein (11) were reported, based on the above-mentioned anion release, ICT, or photoinduced electron transfer (PET) mechanisms.22–27 Distinct from these organosilicon compounds, sensor 10 with an excited-state intramolecular proton transfer (ESIPT) process was developed.28 A distinguished ratiometric fluorescence response to fluoride was observed, for the first time. Upon reaction with F− ions, the Si–O bond of 10 can be cleaved, with a phenolic hydroxyl group formed in aqueous solutions. The proton of the hydroxyl group can undergo a transfer to the unsaturated nitrogen on the benzimidazole group, in the excited state. This sensor molecule is apparently different from ICT-based ratiometric probes, which required two fluorophores as the donor and acceptor (like sensor 14), respectively.25 However, the detection still suffered from a long reaction time (>1.5 h) and the emission lies in the purple-to-blue range, which is not advantageous for measurement and observation (Fig. 6).
 | ||
| Fig. 6 Chemical structures of sensors 8–16. | ||
In 2010, Yang and coworkers29 designed a new F− chemodosimeter 17 based on an ESIPT mechanism. With the help of a surfactant, cetyltrimethylammonium bromide (CTAB), the sensor encapsulated in nanoaggregates showed a significant ratiometric fluorescence output in response to fluoride. As shown in Fig. 7, the fluorescence color change (blue-violet to yellow) can be observed by the “naked eye”, while the sensing process in pure water has almost no time-dependence (<200 s). The detection limit was determined to be about 100 ppb, indicating high sensitivity. To facilitate the use of this sensor, 17 was successfully applied to prepare test paper for the detection of fluoride in water, which can also be observed by the “naked eye”. This work provided a versatile method for F− sensing by a combination of an efficient organosilicon molecule and nanosized micelles (Fig. 7).
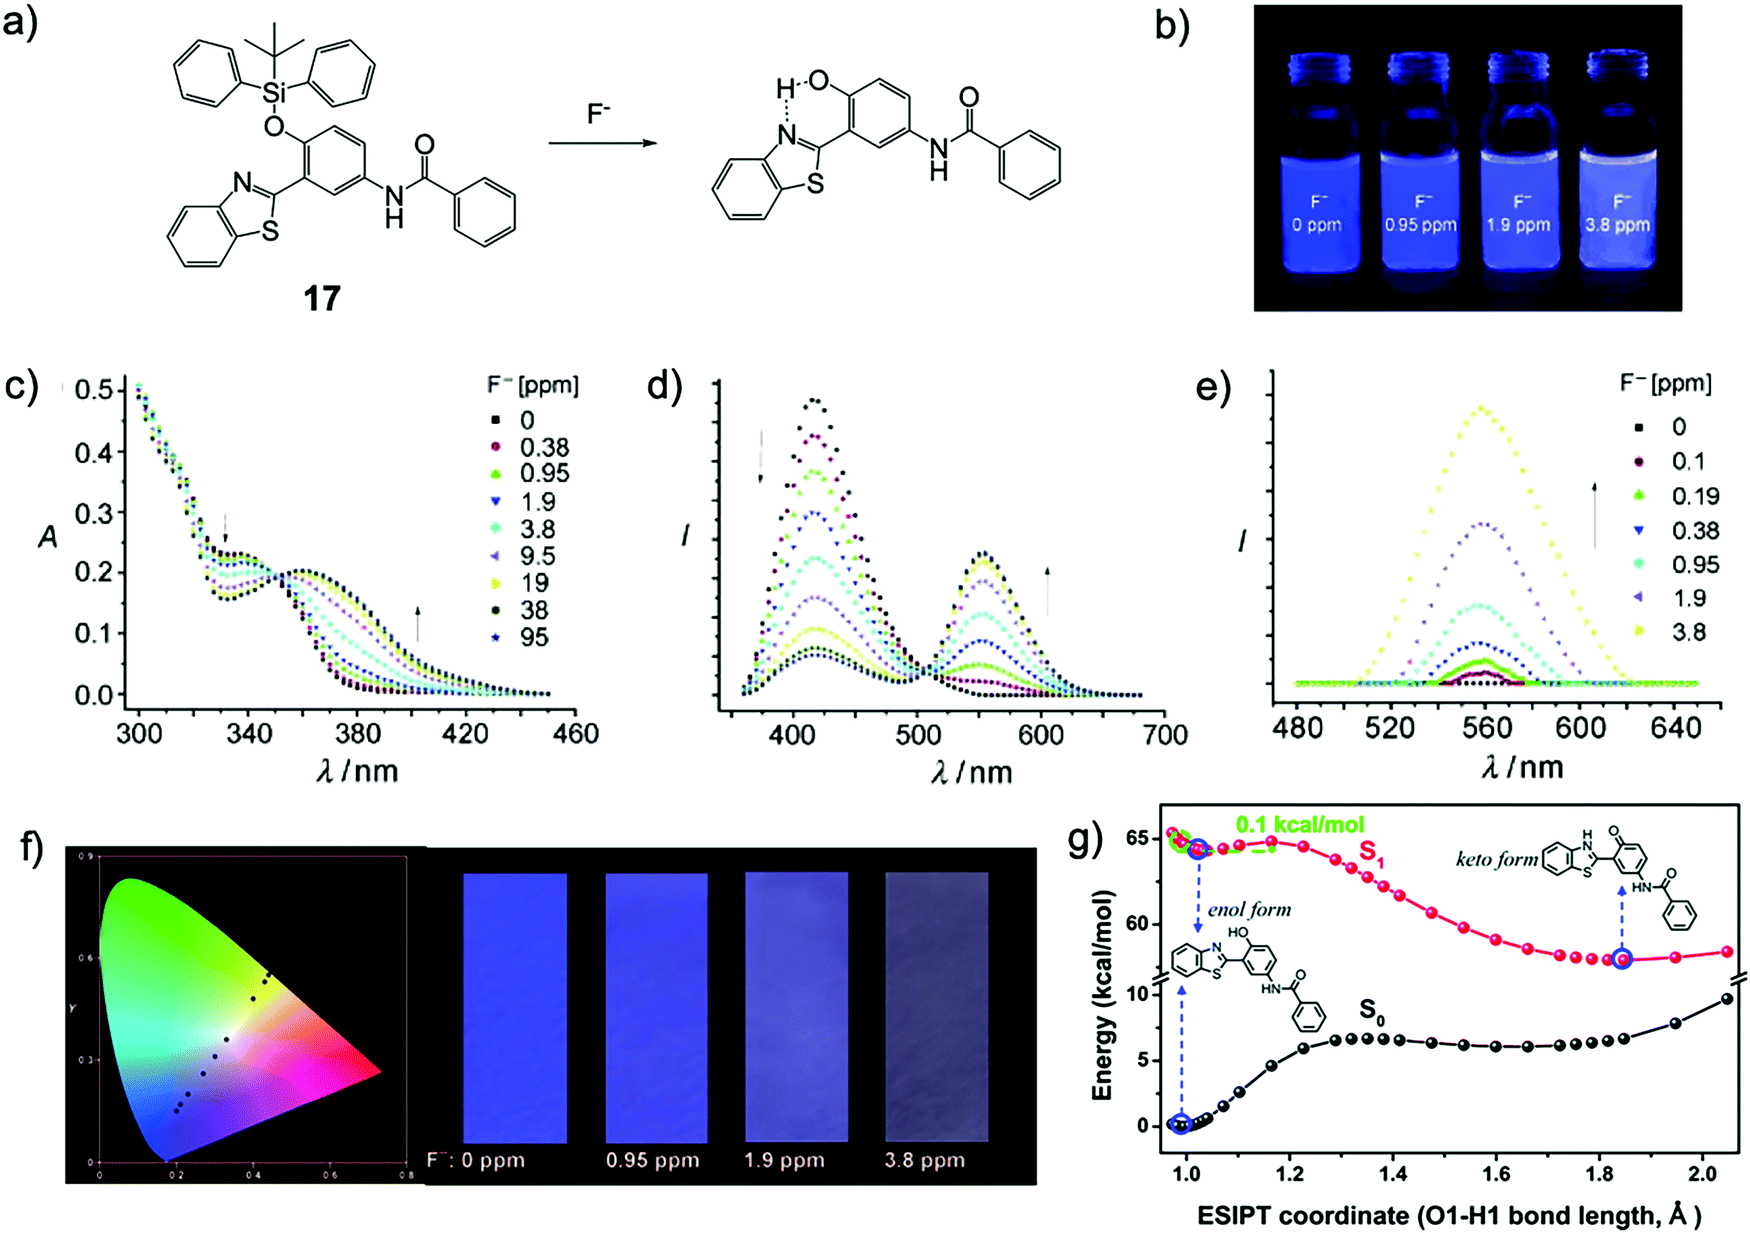 | ||
| Fig. 7 Sensing mechanism and performance of 7. (a) Reaction scheme of 7 with F−. (b) Pictures of dispersions of 7 upon addition of NaF under a UV lamp. (c) Absorption and (d and e) fluorescence spectra of the dispersions of 7 200 s after addition of NaF, λex = 350 nm (d) and 385 nm (e). (f) CIE 1931 (x,y) chromaticity diagram of the test papers for the detection of NaF at different concentrations derived from the fluorescence spectra (black circles); NaF concentration from left to right: 0, 0.38, 0.95, 1.9, 3.8, 9.5, 19, 38, and 95 ppm (left); images of the test papers after immersion into solutions with different concentrations of NaF (right). Reproduced with permission from ref. 29. Copyright 2010, John Wiley and Sons. (g) The calculated potential energy curve of the S1 state for the desilylated product of 7 computed by the TDDFT/B3LYP/TZVP method. The energies of the S0 state were calculated under the geometries of the corresponding S1 state. Reproduced with permission from ref. 30. Copyright 2014, Royal Society of Chemistry. | ||
The sensing mechanism was confirmed later by another group30 using density functional theory (DFT)/time-dependent DFT calculations. The constructed potential energy curves among the optimized deprotected product geometries (in the keto form or enol form, with or without ESPIT) in the S0 and S1 states indicated that the ESIPT is a low barrier process (0.1 kcal mol−1), and the energies of the optimized geometries showed that the ESIPT process is exothermic. The result suggested that the ESIPT is very likely to proceed via a tunneling process or an inertia limited process or a combination, which can induce a distinct red shift in the fluorescence emission spectrum (Fig. 7g). Subsequently, the Yang group also synthesized another similar ESIPT molecule, but employed a poly(N-vinyl-2-pyrrolidone) (PVP) hydrogel as the sensing matrix. The detection process showed even higher efficiency, which can be done in 15 s.31
At the same time, Bai and coworkers reported a ratiometric chemodosimeter 18 with dual output for F− sensing, which is based on a very simple brominated 8-hydroquinoline structure.32 Upon addition of TBAF to the probe in THF or DMF–H2O (5–10% H2O), a dramatic fluorescence color change from blue to yellow-green was immediately observed under UV light, and the solutions also turned yellow-green from transparent. This phenomenon was quite surprising because conventional 8-hydroqunoline derivatives are usually non-emissive in organic solvents or aqueous solutions.33,34 The author assumed there was an ESIPT process from the molecule to fluoride, however, this was proven to be not the case later by another group.35 DFT and time-dependent DFT calculations indicated the emission variation was due to the intramolecular charge transfer (ICT) of the desilylated product as an anion form. The calculated UV-Vis absorption spectra fit well with the experiment results. That means the proton on 8-hydroquinoline was directly captured by fluoride, rather than just forming a hydrogen bond, even in the presence of 5–10% water (Fig. 8a–d).
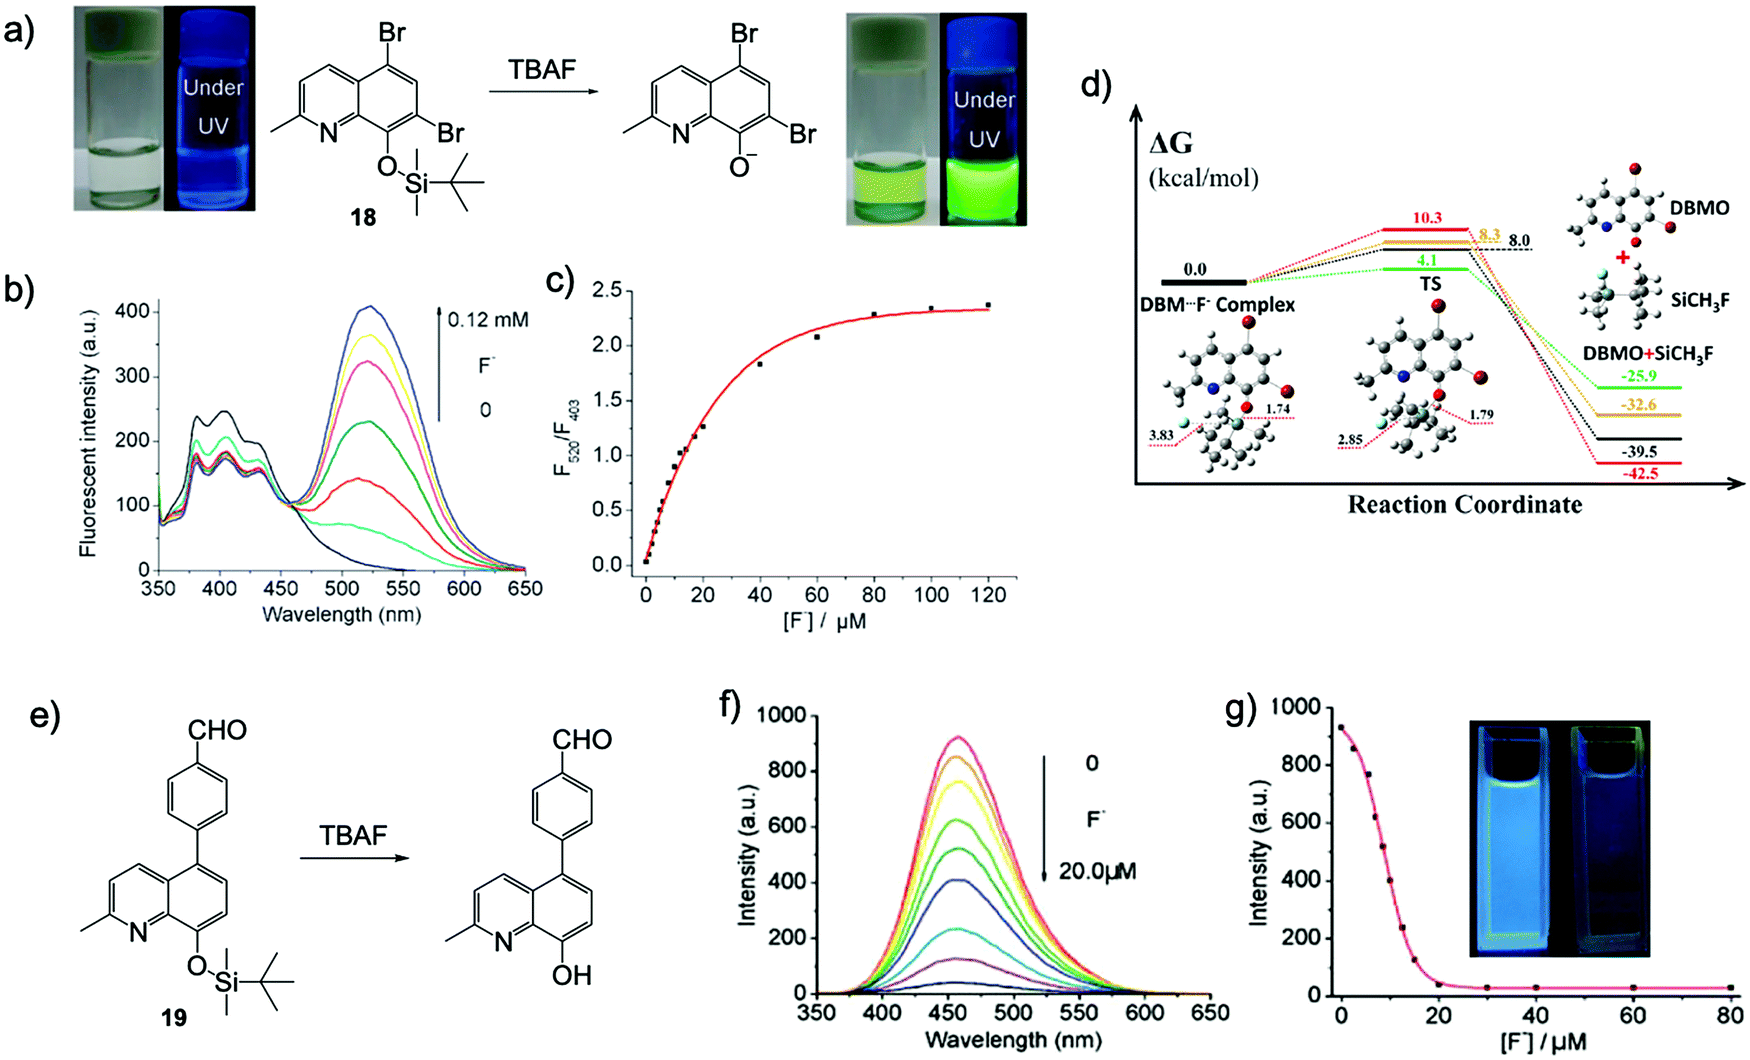 | ||
| Fig. 8 Sensing mechanism and performance of 18 and 19. (a) Reaction scheme of 18 with TBAF. Photos: Naked eye colour changes and under UV lamp fluorescent colour changes observed for 18 upon addition of 1 equiv. F− in THF. [18] = 200 μM. (b) Fluorescence spectra of 18 + TBAF in THF with increasing F− concentrations. (c) Ratiometric calibration curves F520nm/F403nm as a function of F− concentration. [18] = 20 μM, λex = 335 nm. Reproduced with permission from ref. 32. Copyright 2011, Royal Society of Chemistry. (d) Free energy profiles for the desilylation reaction mechanism: DFT gas phase (black line), DFT solvent (red line), RI-CC2 gas phase (green line) and CCSD solvent (orange line). All free energies are in kcal mol−1; all bond lengths are in Å; DBM refers to 18 and DBMO refers to the desilylated product. Reproduced with permission from ref. 35. Copyright 2013, Royal Society of Chemistry. (e) Reaction scheme of 19 with TBAF. (f) Fluorescence spectra of sensor 19 + TBAF in CH3CN with increasing F− concentration. (g) Emission intensity at 458 nm as a function of F− concentration. [19] = 20 μM, λex = 340 nm. Inset: Under UV lamp fluorescent colour changes observed for 19 before and after addition of TBAF. Reproduced with permission from ref. 36. Copyright 2012, Royal Society of Chemistry. | ||
Subsequently, Bai and others synthesized another 8-hydroxyquinoline-based sensor 19, with an extended π-conjugation structure (Fig. 8e–g).36 It emitted moderate blue fluorescence in CH3CN (λem = 458 nm, Φf = 0.023) but showed very weak emission in THF (λem = 418 nm, Φf = 0.006). Interestingly, the fluorescence of the sensor in CH3CN was greatly quenched upon addition of F−, while in THF, a new emission peak emerged (λem = 520 nm) in response to F− ions. This is similar to that observed for sensor 18, however, the intensity of the new peak is much lower. The phenomenon may be due to the fact that F− ions have a much stronger ability to capture the proton of the desilylation product in THF, compared with that in CH3CN. Unfortunately, in this case, the sensor cannot maintain its sensing behavior in the presence of water. Therefore, both the chemical structure and the sensing medium have a significant impact on the performance of the detection.37 After that, another F− probe was also reported based on an 8-hydroxyquinoline structure with a hydrophilic substituent, which achieved F− sensing in aqueous solutions.38
Kim and coworkers39 developed a TIPS-capped ratiometric chemodosimeter 20 based on the versatile 1,8-naphthalimide scaffold40 with an intramolecular charge transfer (ICT) effect. Upon reaction with F− ions, the desilylation caused a cascade reaction, resulting in the product N-butyl-4-amino-1,8-naphthalimide. The fluorescence of 20 in CH3CN dramatically changed from a bright blue color (λem = 449 nm) to deep green (λem = 508 nm) with no response time. However, when they performed the detection in CH3CN–HEPES buffer solution (80/20, v/v, pH = 7.4), the full reaction of 20 with F− required 3–8 h, which was attributed to the strong solvation of F− by water. Owing to the large two-photon cross section of the naphthalimide group, they also investigated the fluoride sensing properties of 20 by two-photon fluorescence spectroscopy, which is similar to the result under one-photon conditions (Fig. 9).
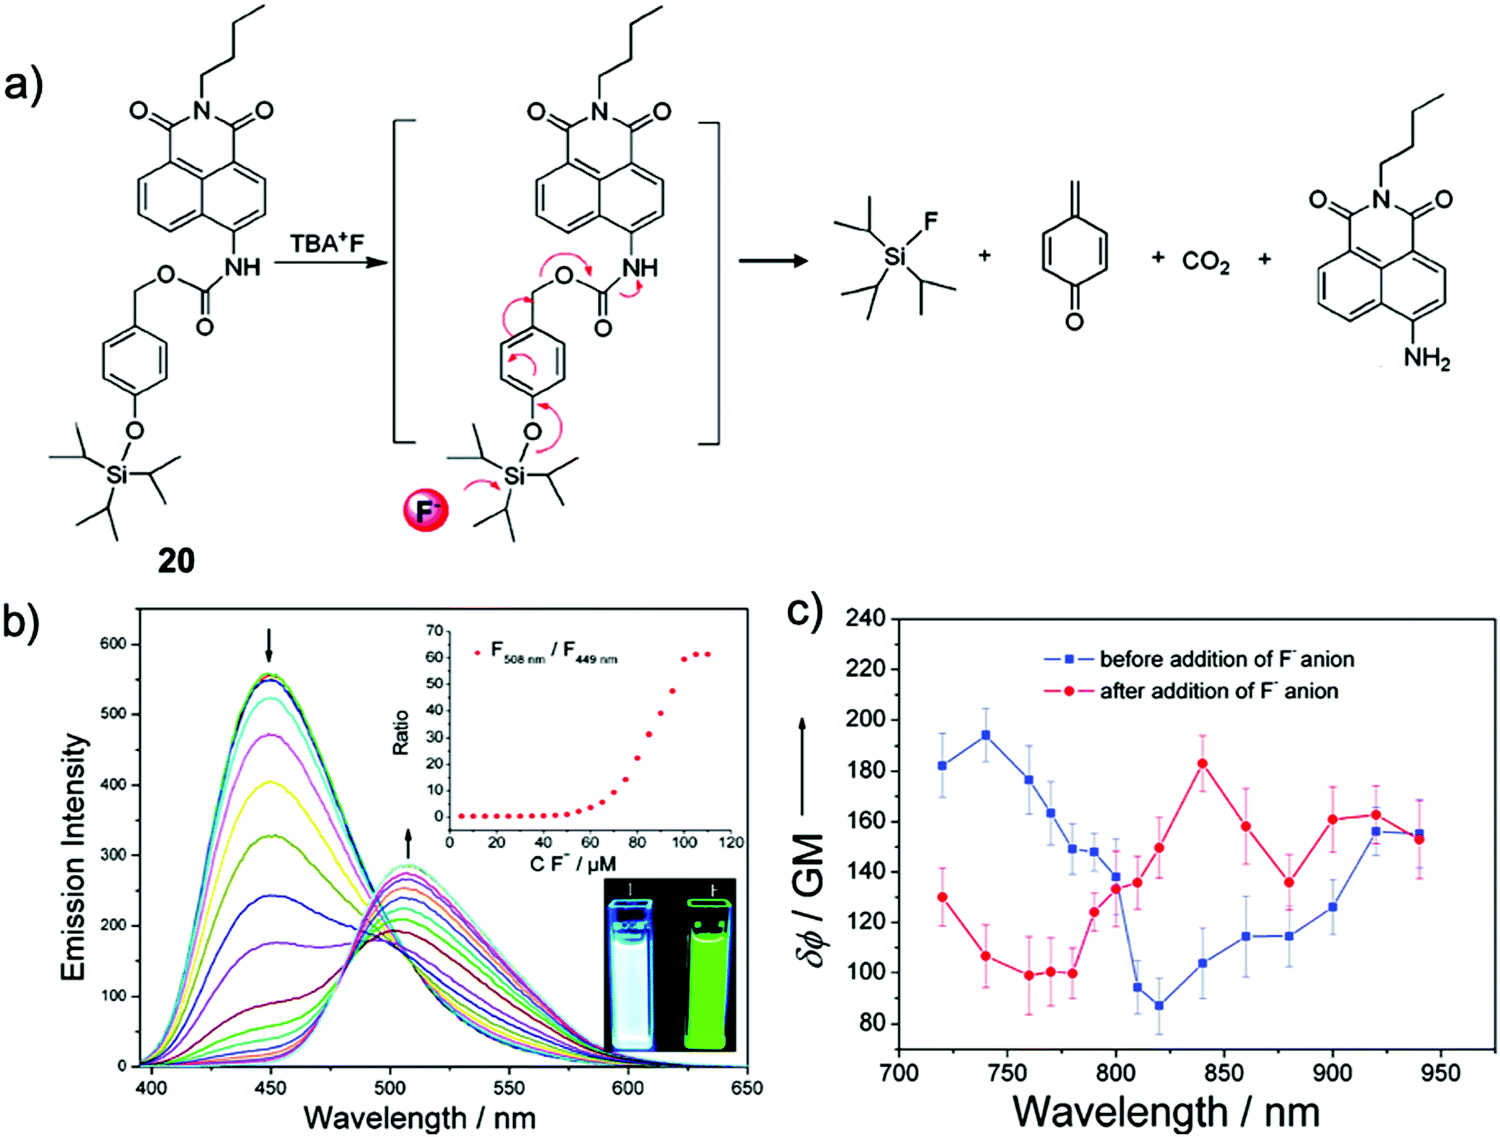 | ||
| Fig. 9 Sensing mechanism and performance of 20. (a) Reaction scheme of 20 with TBAF. (b) Fluorescence spectra of 20 (10 μM) in CH3CN in the presence of TBAF (0–110 μM). Insets: (upper) Ratios of fluorescent intensities at 508 and 449 nm as a function of F− concentration; (lower) fluorescence images of 20 (10 μM) before and after addition of TBAF (110 μM) in CH3CN. λex = 365 nm. (c) Two-photon action spectra of 20 (10 μM solution in CH3CN) before (blue line) and after (red line) addition of TBAF (110 μM). Error bars represent the standard deviation from replicate experiments (n = 10). Reproduced with permission from ref. 39. Copyright 2011, American Chemical Society. | ||
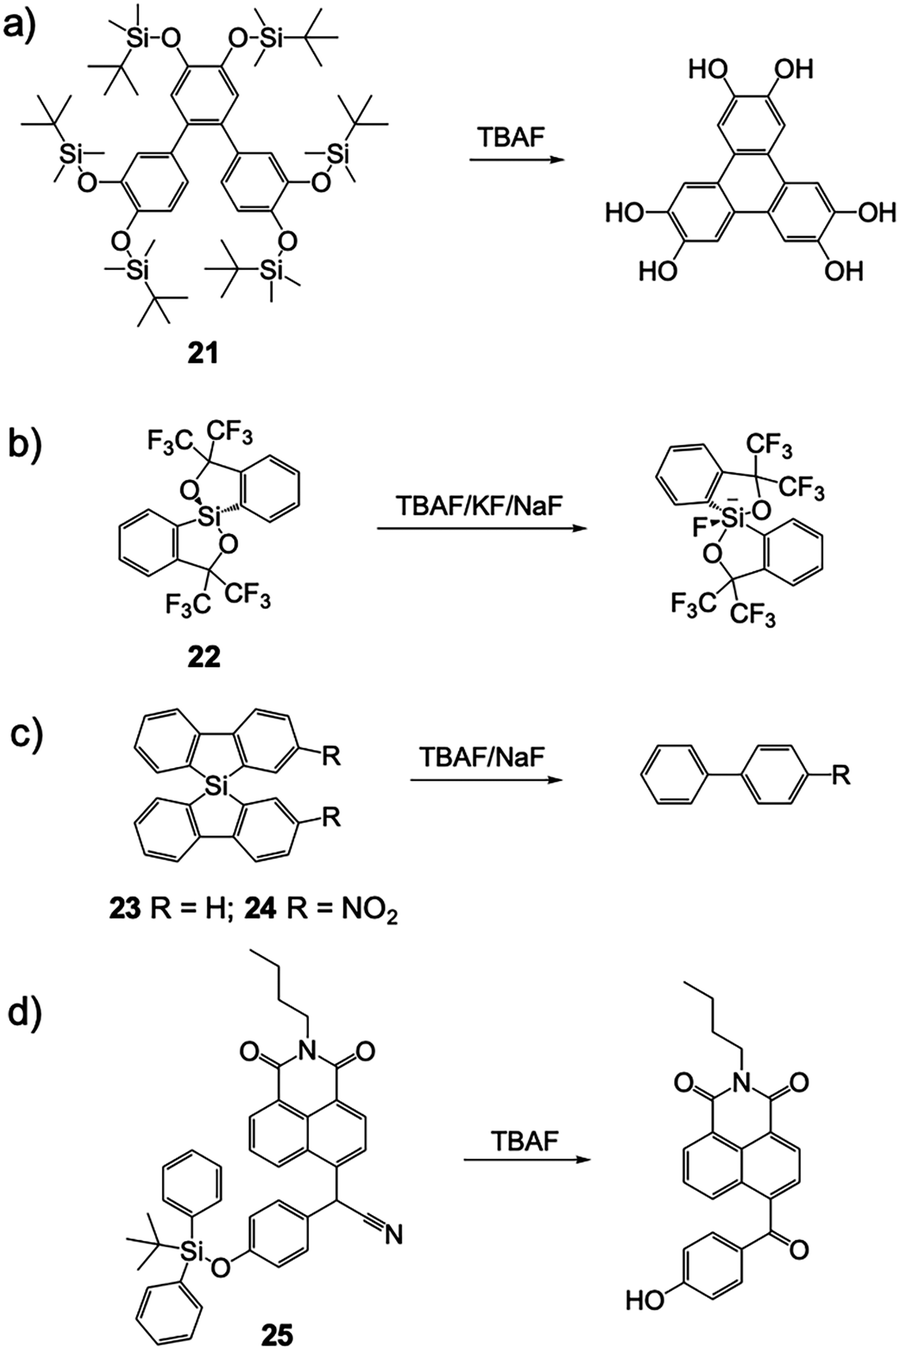
Besides the typical desilylation mechanism for deprotection reactions, there were also other F− chemodosimeters reported with unique Si–F interactions. In 2010, Kumar and coworkers41 synthesized a terphenyl derivative 21via Suzuki–Miyaura coupling. This molecule underwent unprecedented irreversible cyclization to symmetrically substituted triphenylenes when deprotected by fluoride, thus a significant color change and fluorescence variation were observed in THF solutions due to the extended π-conjugation and increased negative charge. Probably owing to the strongly hydrophobic structure, the sensing in aqueous solutions was not studied (Fig. 10a).
 | ||
| Fig. 10 Reaction schemes of 21–25 with F−. | ||
In 2013, Fensterbank and coworkers42 reported a series of spirosilane derivatives 22, 23 and 24. These molecules can form stable complexes after reaction with fluoride, depending on the different cations used for the F− source. Due to the great variation of the molecular structure, all of the sensor molecules showed large fluorescence changes, including an emission red-shift and intensity increase. Unfortunately, these compounds only emitted in the UV light range (300–350 nm), which is not suitable for “naked eye” detection and further biomedical applications (Fig. 10b and c).
Liu and coworkers43 synthesized a naphthalimide-based F− chemodosimeter 25 bearing a secondary nitrile C–H group. After the cleavage of the TBDPS group by F−, oxidation of the C–H group to a rigid carbonyl group was observed. Unfortunately, the authors didn’t give a clear explanation of how the transformation occurred and what the source of oxygen is. The fluorescence of the oxidation product in CH3CN was strongly quenched due to the enhanced photoinduced electron transfer (PET) by an increased negative charge on the phenolate oxygen atom, as well as a potential conjugate effect induced by the oxidation. However, the addition of 5% H2O caused a significant influence on the molecule's fluorescence and sensing behavior, indicated that the application might be restricted in the presence of water (Fig. 10d).
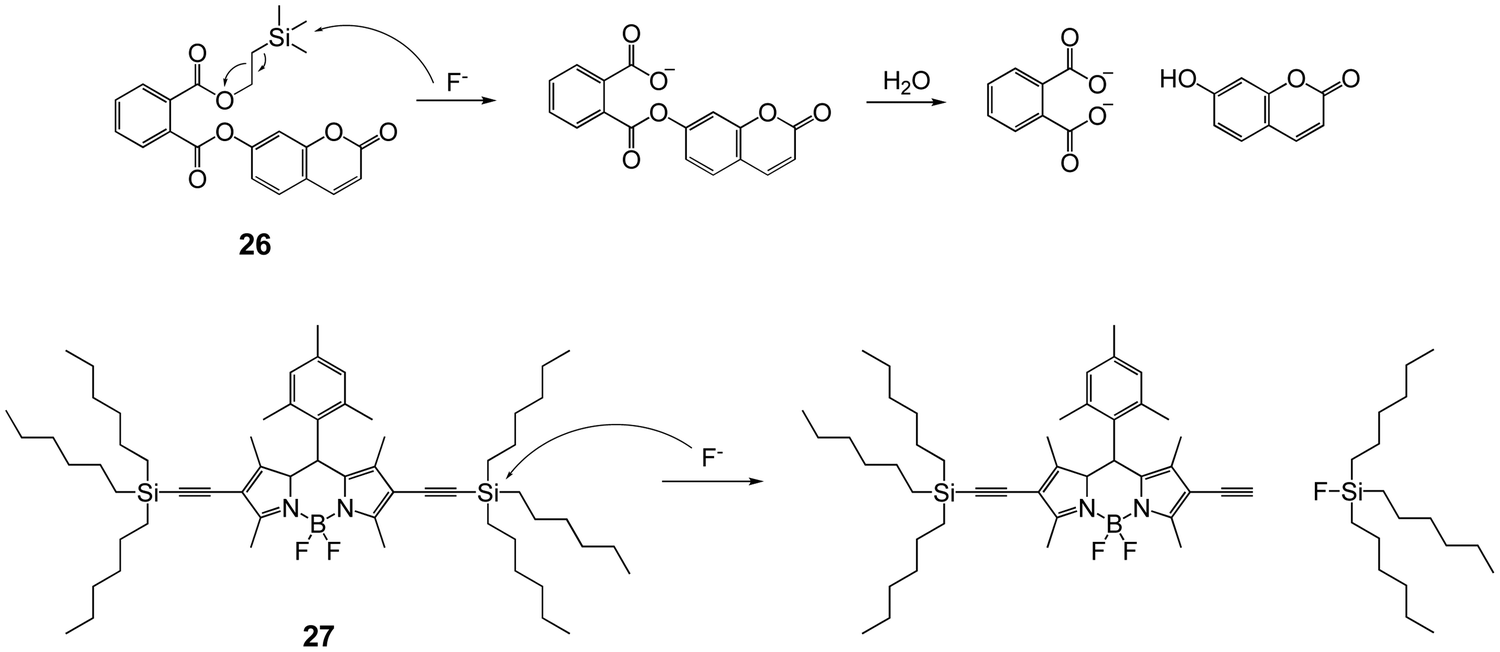
Winter and coworkers44 developed a series of F− probes based on aryl phthalate esters, with a self-immolative linker. This linker is easy to conjugate with the release of phenol derivatives. Taking 26 for example, desilylation by F− can induce the output of highly emissive 7-hydroxycoumarin in phosphate buffer (pH = 7.0), upon cleaving a fluoride-sensitive mask to yield a benign phthalic acid byproduct (Fig. 11). This strategy was also applied to different fluorophores by other groups.45–47
 | ||
| Fig. 11 Reaction schemes of 26 and 27 with F−. | ||
Besides Si–O bond cleavage, the Si–C bond has also been introduced to design fluorescent chemodosimeters for detection of fluoride. In 2011, Liu and coworkers48 synthesized a trihexylsilylacetylene-containing BODIPY dye 27, the fluorescence of which in acetone changed from an orange color to a green color after reaction with fluoride, with a 17 nm blue shift of the maximum emission wavelength, as a result of the Si–C cleavage reaction. However, the performance of chemical sensors based on Si–C cleavage usually suffers in the presence of water, probably due to the large π-conjugated structure and strong hydrophobicity. Also, the fluorescence variation is not as significant as that for silylated phenol derivatives.49–51 Thus, Si–C cleavage-based F− chemodosimeters have attracted less interest compared to Si–O cleavage-based ones.
In vitro and in vivo F− imaging
Based on the promising results on fluorescent chemodosimeters for fluoride detection, great effort was devoted to exploring new molecules for in vitro and in vivo F− imaging. Employing an ICT mechanism, Zhang and coworkers52 chose hydrophilic benzothiazolium hemicyanine as the fluorophore to synthesize a ratiometric fluorescent chemodosimeter 28 for fluoride ion sensing (Fig. 12). They successfully carried out F− ratiometric fluorescence imaging of RAW 264.7 macrophage cells, although the incubation concentration of fluoride was still quite high (3 mM). The cell viability was not recorded in this case. Subsequently, a few other F− chemodosimeters based on organosilicon compounds were also developed, but mainly based on the emission intensity mode, rather than the ratiometric response.45,46,53,54 Moreover, there was no significant improvement in the sensitivity of in vitro sensing.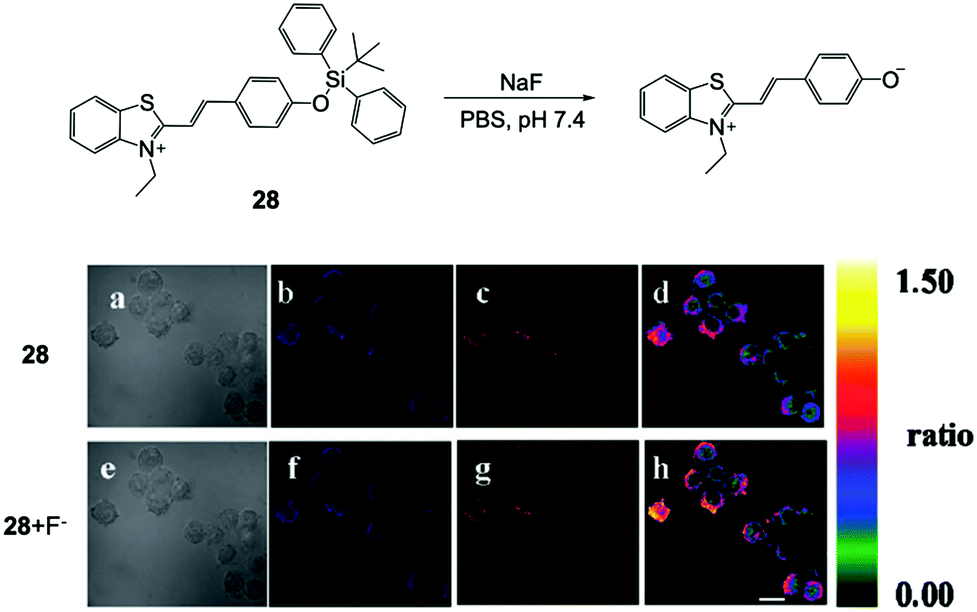 | ||
| Fig. 12 Reaction scheme of 28 and in vitro imaging of RAW 264.7 macrophage cells. The cells were incubated with 28 (5 μM) for 5 min and 3 mM NaF for another 20 min. (a and e) Bright-field transmission images, (b and f) blue channel at 490 ± 20 nm, (c and g) orange channel at 560 ± 20 nm, and (d and h) ratio images. Scale bar = 20 μm. Reproduced with permission from ref. 52. Copyright 2011, Royal Society of Chemistry. | ||
In 2015, Zhang and coworkers55 developed a F− ratiometric sensor 29 based on a simple naphthalimide structure. The molecule exhibited a typical blue-to-green fluorescence response to F− in DMF–HEPES buffer solution (30/70, v/v, pH = 7.4), while a long reaction time was needed to reach a stable intensity (∼150 min). Surprisingly, when they used 29 for in vitro imaging of the HeLa cell line, a significant ratiometric response to F− was observed with an incubation time of only 20 min for fluoride ions (Fig. 13). Importantly, only 15 μM of NaF was used for the live cell experiment ([29] = 10 μM), indicated high imaging sensitivity under intracellular conditions. No cytotoxicity profiles of the sensor were provided in this work. They further investigated the imaging ability of 29 in mice tumor tissue by two-photon imaging, and a bright signal was obtained at a 250 μm penetration depth with no auto-fluorescence existing. Most recently, a series of other F− probes for in vitro imaging were also developed,56–61 including near-infrared emissive molecules.60,61 However, no one showed more advanced performance in terms of sensitivity and imaging quality.
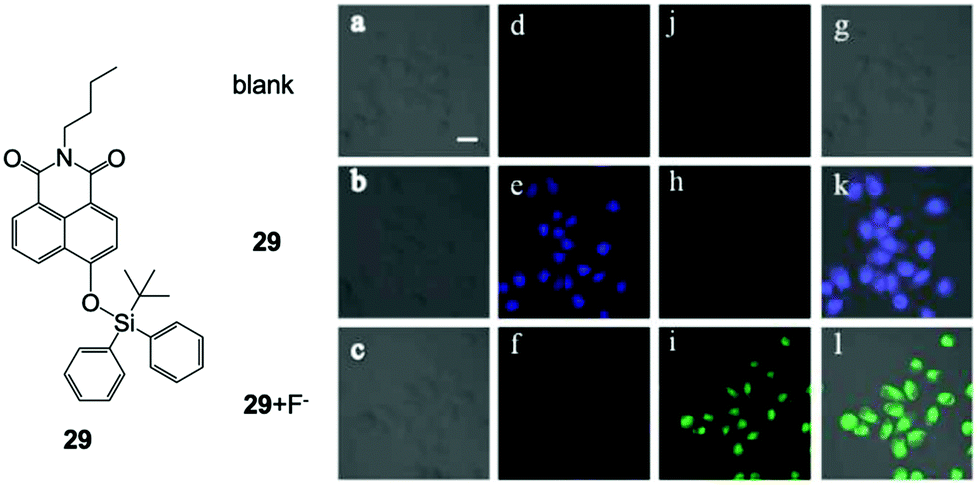 | ||
| Fig. 13 Chemical structure of 29 and in vitro imaging of HeLa cells by two-photon microscopy. The cells were incubated with 29 (10 μM) for 20 min and then treated with F− (15 μM) for another 20 min. (a–c) Bright-field transmission images, (d–f) blue channel at 400–450 nm, (j, h and i) green channel at 500–550 nm and (g, k and l) overlay channel. Scale bar = 20 μm. Reproduced with permission from ref. 55. Open access, MDPI. | ||
In 2016, a new F− chemosensor 3062 was synthesized based on derivatized tetraphenylethylene, which is a typical aggregation-induced emission (AIE)-active molecule, first developed by Tang in 2001.63 Sensor 30 bears a positively charged pyridinium pendant, which gave the molecule high solubility in water. Upon reaction with fluoride ions, 30 underwent a cascade reaction, eventually producing a highly emissive product due to the decreased solubility and thus enhancement of the aggregation level. Benefiting from the high sensitivity of this F− sensor, they also successfully conducted in vitro F− imaging by 30 on HeLa cells, and the NaF concentration for incubation was as low as 20 μM (Fig. 14). The IC50 (half maximal inhibitory concentration) value of 30 was estimated to be 15 μM for HeLa cells, which is higher than the working concentration.
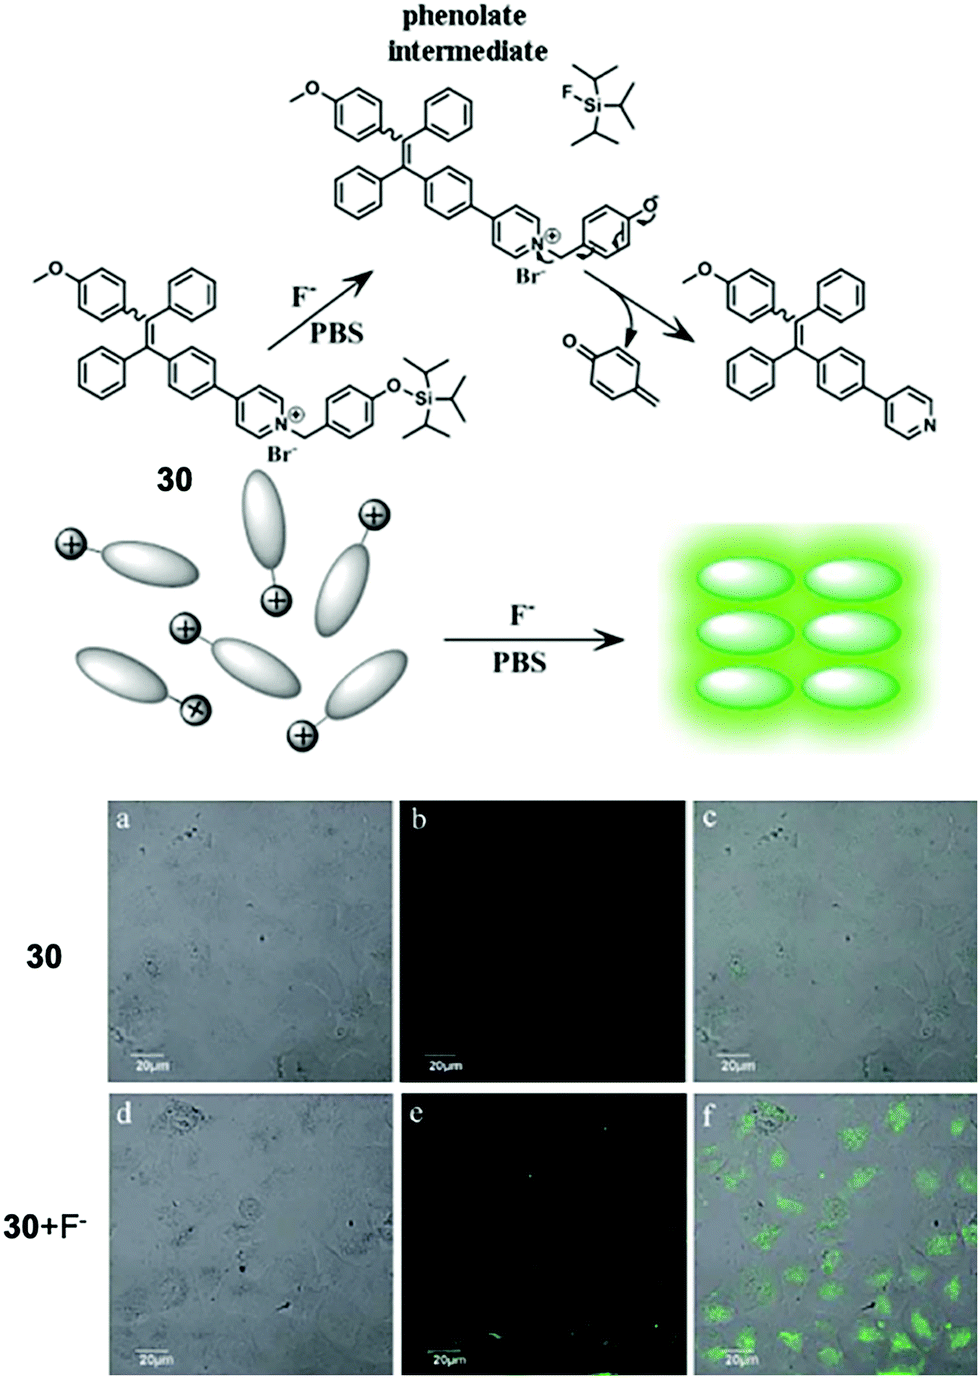 | ||
| Fig. 14 Reaction scheme of 30 and in vitro imaging of HeLa cells by confocal microscopy. For probe only imaging, the cells were incubated with 30 for 50 min at 37 °C. For F− imaging, the cells were incubated with 30 for 30 min at 37 °C and then further incubated with F− for 20 min. (a and d) Bright-field transmission images, (b and e) fluorescence channel and (c and f) overlay channel. Reproduced with permission from ref. 62. Open access, Royal Society of Chemistry. | ||
Although a number of F− chemodosimeters for fluorescence imaging of live cells or even of zebrafish61,64 have been reported, in vivo imaging of a mammal animal model is much more challenging and rarely studied. In 2015, Tang and coworkers65 described two naphthalimide-based ratiometric probes 31 and 32 with positively charged functional groups as target moieties for subcellular mitochondria and lysosomes, respectively. For the first time, in vivo imaging of fluoride ions in living mice was successfully achieved by probe 31. In this work, it was found that the positive charges of probes under physiological pH could sequester F− and promote the desilylation reaction. Thus, probes 31 and 32 showed a more significant fluorescence change and faster response to F−, compared to that of the control molecule with the alkyl moiety. They first carried out the in vitro imaging of F− with 31 and 32, respectively, and excellent ratiometric images were obtained for both molecules (Fig. 15A–D). Both of the two molecules exhibited low in vitro cytotoxicity on HeLa cells. The in vivo imaging was subsequently performed on a small animal in vivo imaging system with a 430 nm excitation laser and a 535 nm emission filter. As shown in Fig. 15E and F, the control mice showed very weak background fluorescence while the mice with NaF injection showed much stronger fluorescence according to the pseudocolor. However, the result only demonstrated that excess taken up fluoride ions could accumulate in living mice. The impact of the F− injection concentration on the imaging performance was not further investigated. To date, this work is still the only example of a fluorescent chemodosimeter for in vivo fluoride imaging of a mammal animal model until now, despite the existence of a TBDMS-containing bioluminescent probe for in vivo study.66
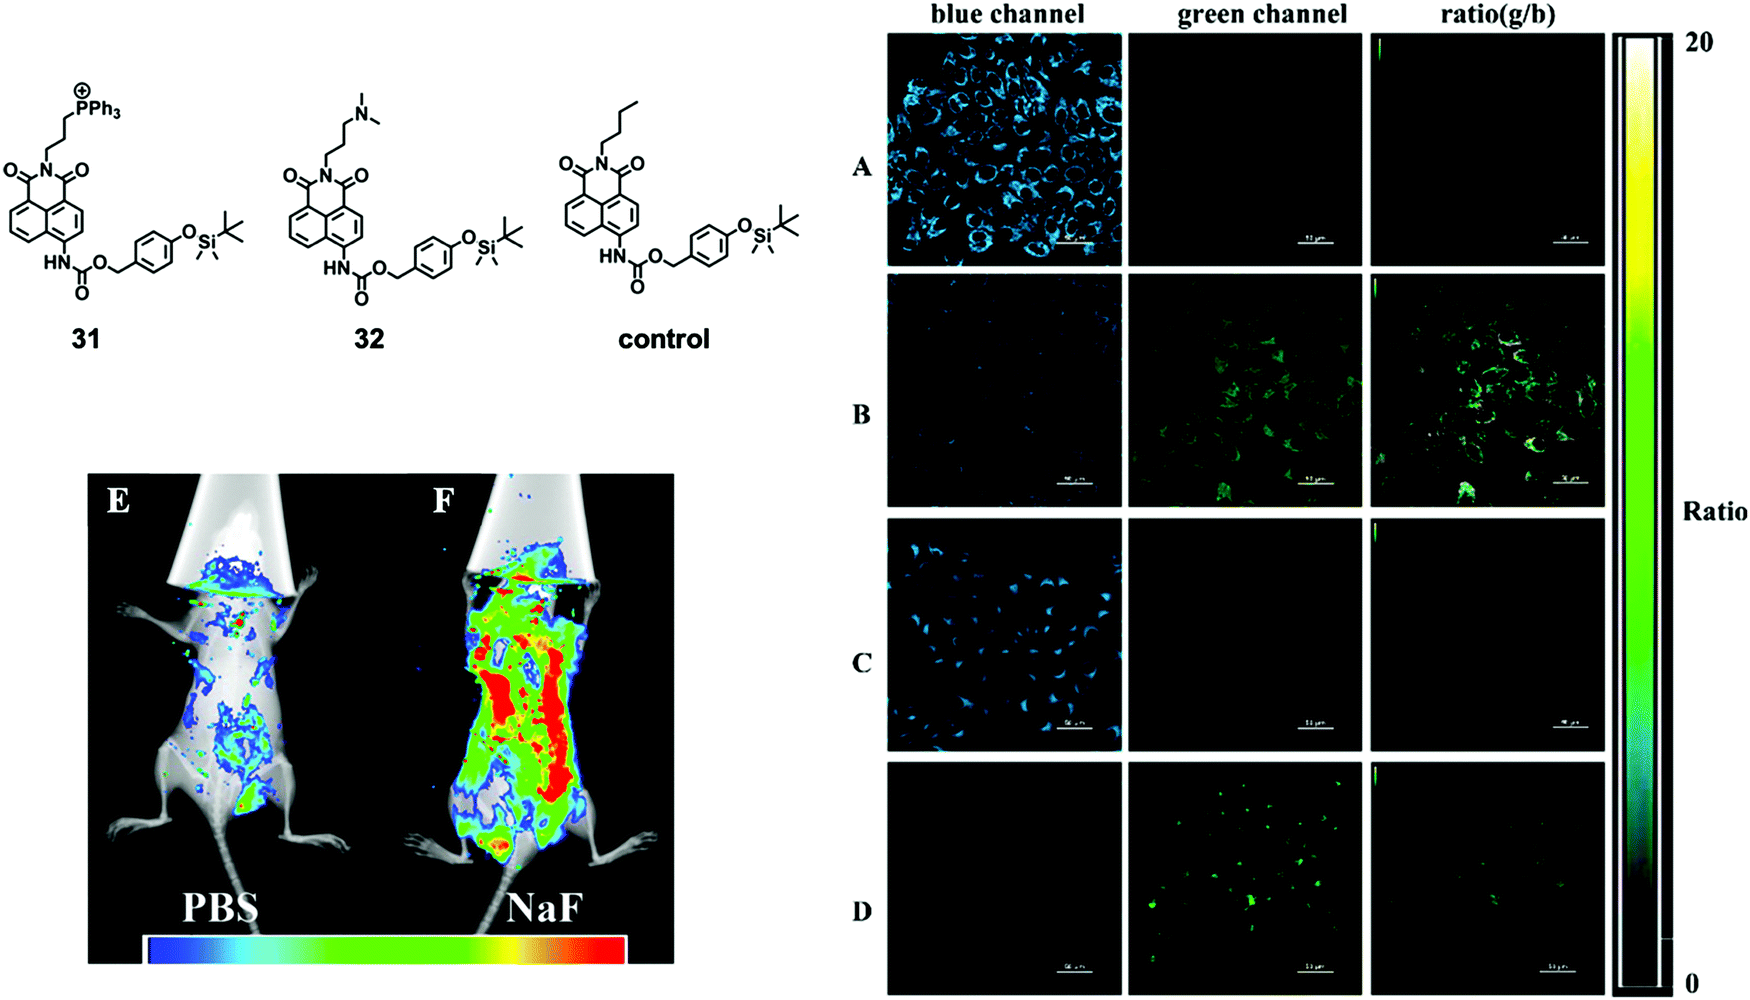 | ||
| Fig. 15 Chemical structures of 31 and 32, and their in vitro and in vivo imaging. Ratiometric imaging of F− was conducted on HeLa cells. (A) Cells were incubated with 10 μM 31 only; (B) cells were treated with 1 mM F− after incubation with probe 31; (C) cells were incubated with 10 μM 32 only; (D) cells were treated with 1 mM F− after incubation with 32. Scale bar = 50 μm. Fluorescence imaging of F− was conducted on living mice. The mice were first injected with (E) PBS (10 mM, 200 μL) or (F) NaF (0.5 mM, in 10 mM PBS, 200 μL) once a day for 4 consecutive days. Both mice were then injected with 50 μM 31 on the fifth day and imaged after anesthesia. Reproduced with permission from ref. 65. Copyright 2015, American Chemical Society. | ||
Fluorescent nanoprobes and hybrid systems
Besides small molecule-based F− chemodosimeters, a series of fluorescent nanoprobes have also been developed in combination with polymeric materials or inorganic nanomaterials. In 2011, Liu and coworkers67 synthesized a responsive double hydrophilic block copolymer, employing a TBDMS-containing fluorophore on the side groups, which can undergo spontaneous cyclization induced by F− as reported before.17 The polymer exhibited a dramatic “turn on” fluorescence response to F− ions in H2O, in both unimer and micelle states, depending on the environment temperature. The polymeric nanosensor showed high sensitivity with a detection limit of 50 ppb to NaF, however, the emission intensity required more than 7 h to reach saturation.Wu and coworkers68 reported a very simple polymeric F− sensor 33 based on PEGylated fluorescein capped with two TBDPS groups (Fig. 16). The PEG2000 chain can greatly improve the water solubility and biocompatibility of the small molecule. This polymer sensor showed a significant emission enhancement upon the addition of NaF in H2O, and the detection limit was determined to be 19 ppb. Interestingly, the response time in this case was only 15 min to obtain a maximum signal, which enabled the in vitro imaging of fluoride in HeLa and L929 cells (100 μM NaF was used). The cytotoxicity of the PEGylated molecule was determined to be very low towards the L929 cell line (>90% viability after 24 h). The authors also investigated F− sensing in biological fluids such as urine and serum, and the performance was at the same level as that in pure water. The chemical structures of the fluorescent polymer before and after reaction with fluoride were confirmed by NMR and MALDI-TOF.
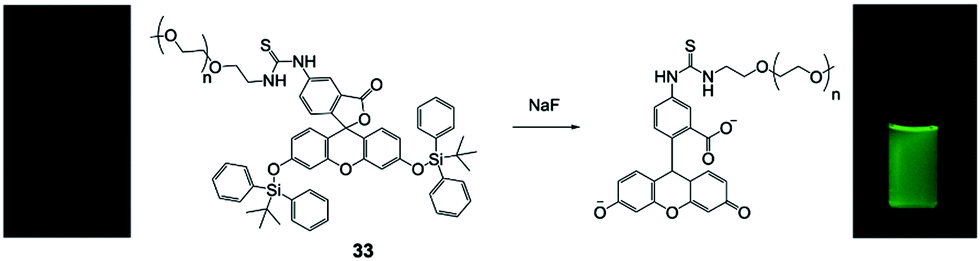 | ||
| Fig. 16 Reaction scheme of polymer 33 with NaF. Photos: 33 in HEPES buffer pH 7.4 under a UV lamp before and after addition of NaF. Reproduced with permission from ref. 68. Copyright 2013, John Wiley and Sons. | ||
In 2013, Bai and coworkers69 developed a novel PEGylated polyhedral oligomeric silsesquioxane (POSS) bridged by a perylene diimide (PDI) scaffold (34, Fig. 17), which can form small spherical nanoparticles in water with core diameters around 10 nm. Owing to the strong steric effect of the POSS group, the self-quenching of PDI, commonly observed in the aggregated state because of the π–π stacking, can be restricted. A fluorescence quantum yield of 26% was obtained from the hybrid system in aqueous solutions, with excimer-like emission at 660 nm. Upon addition of fluoride ions, a dramatic decrease of the emission intensity was observed. It was envisioned that F− ions could cause the decomposition of the POSS cages in the particle cores, and again induce the aggregation of PDI groups, resulting in quenched fluorescence. Interestingly, the amphiphilic hybrid system played the role of a nanoreactor which can accelerate the Si–F reaction in the hydrophobic core, thus the response time for the sensing process was measured to be less than 10 s. Note that the detection of NaF can only be performed in the presence of organic cations such as tetrabutylammonium; the reason for this phenomenon requires further investigation. This work represented a new strategy for F− sensing by organic–inorganic hybrid nanomaterials. Recently, another POSS-based F− sensor70b employing the pyrene excimer/monomer transformation70a was also reported, using a similar mechanism.
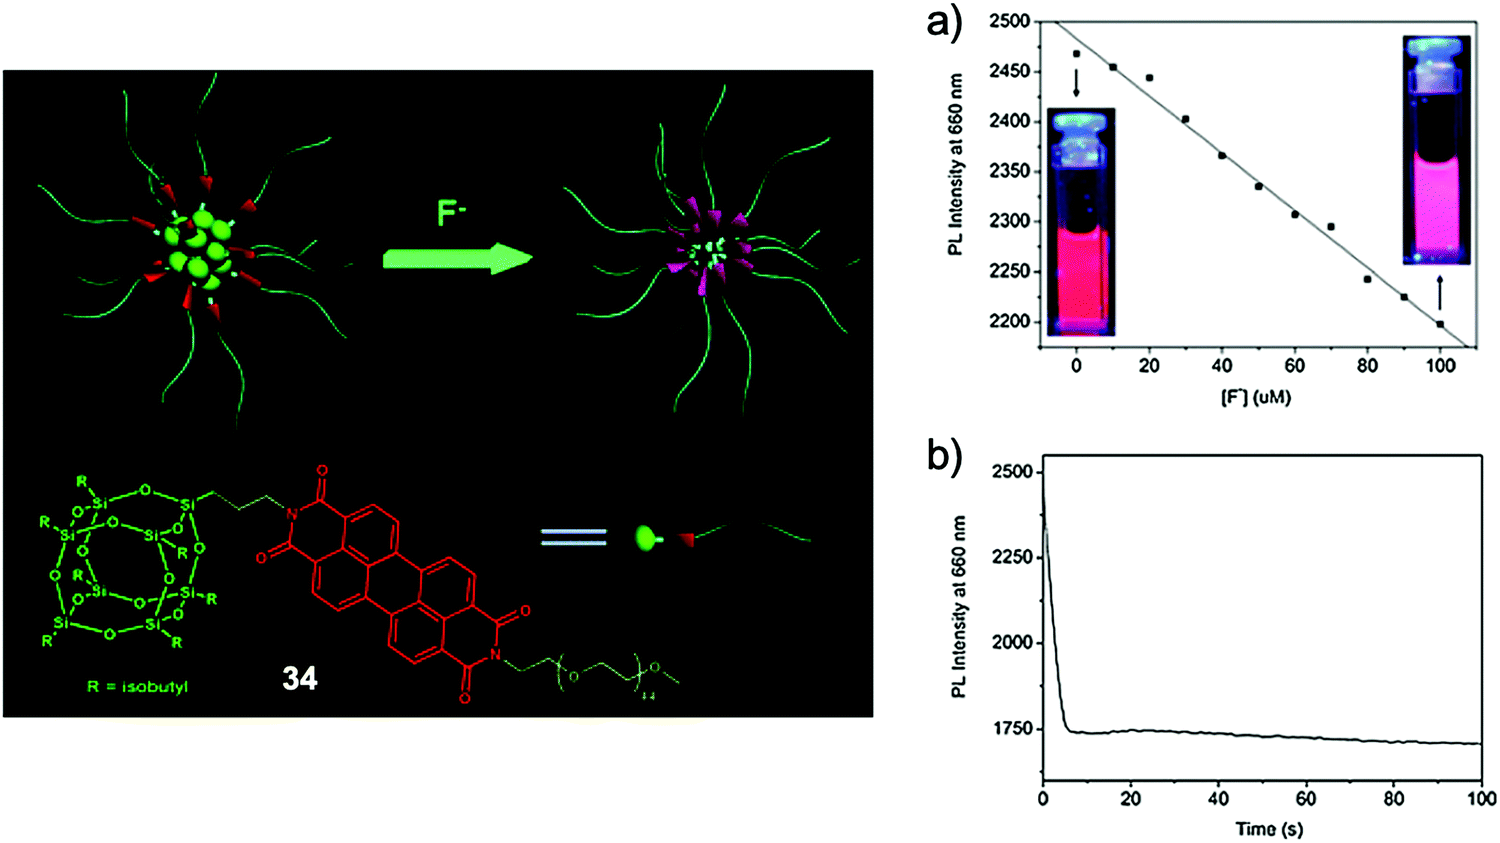 | ||
| Fig. 17 Sensing mechanism and performance of hybrid nanosensor 34. (a) Plot of the fluorescence intensity at 660 nm of 34 in the presence of different concentrations of F− ions (inset: fluorescence changes under a UV lamp). (b) The effect of reaction time on the fluorescence intensity at 660 nm of 34 by 0.3 mM F− ions. Conditions: 0.1 g L−1 of 34 in aqueous solution, λex = 450 nm, TBA salts. Reproduced with permission from ref. 69. Copyright 2013, Royal Society of Chemistry. | ||
Chan and coworkers71 described a ratiometric F− nanosensor 35 based on semiconducting polymer dots with an encapsulated coumarin dye containing a TBDPS group. As shown in Fig. 18, the polymer dots were prepared from the poly(phenylene-ethynylene) (PPE) type of π-conjugated polymers, which emitted strong blue fluorescence, while green emission of the coumarin group can be recovered after deprotection by fluoride. To improve the stability and provide further functionality for bioconjugation, a carboxyl-functionalized diacetylene (10,12-pentacosadiynoic acid) was introduced onto the surface of the polymer dots, followed by the polymerization of diacetylenes via topochemical 1,4-addition. The average diameter of the polymer dots increased from 9 to 17 nm, and this design enabled in vitro F− imaging of HeLa cells. However, because the emission peaks from PPE and coumarin were too close to each other, the sensitivity of 35 was not advantageous, thus the incubation concentration of NaF was as high as 1 mM. The cytotoxicity of the polymer sensor was not reported.
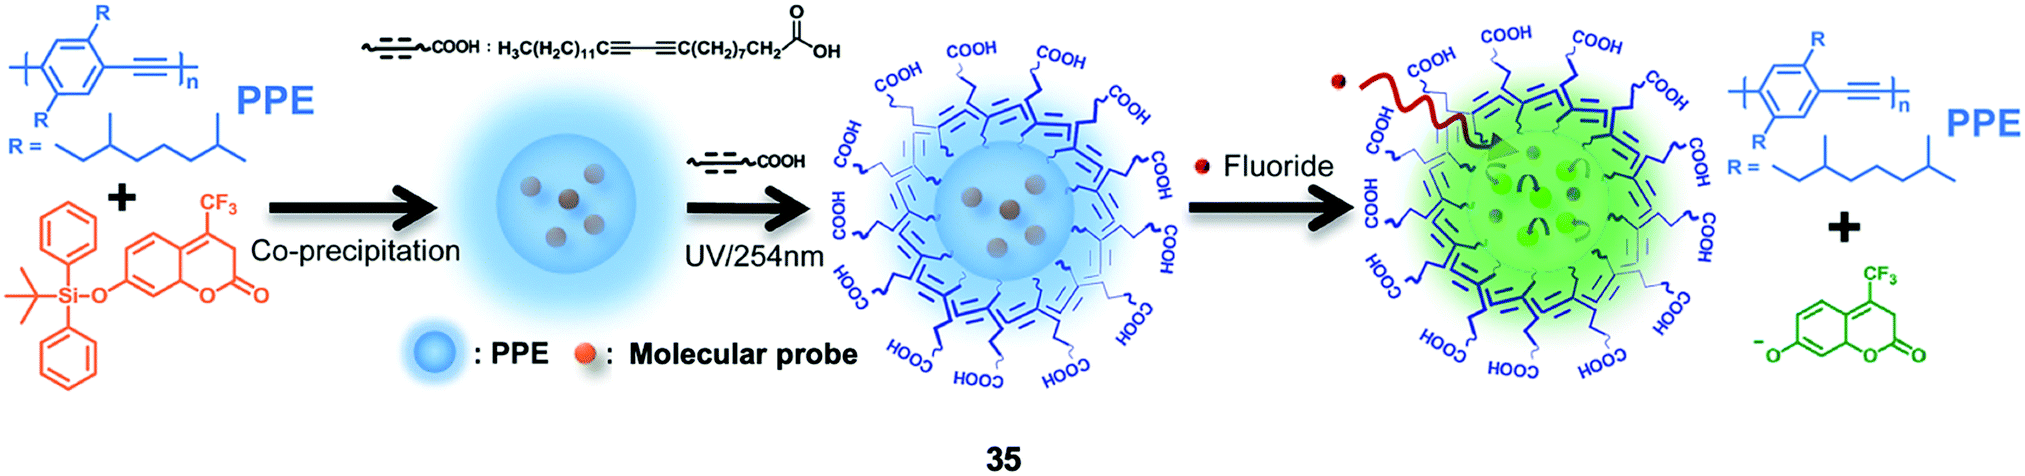 | ||
| Fig. 18 Schematic showing the sensing of fluoride by ratiometric nanosensor 35 using molecular probe-doped PPE dots. Reproduced with permission from ref. 71. Copyright 2014, Royal Society of Chemistry. | ||
In 2015, Huang and coworkers72 fabricated a phosphorescent nanosensor employing mesoporous silica nanoparticles, with an embedded yellow phosphorescent Ir(III) complex containing the TBDPS group and a blue phosphorescent Ir(III) complex as a reference (Fig. 19). Upon interaction with F− ions in aqueous solutions, a significant ratiometric phosphorescence response was observed, thanks to the quenched yellow emission induced by desilylation. The high sensitivity facilitated a successful in vitro study on the HepG2 cell line, by both fluorescence imaging and phosphorescence lifetime imaging, with a low incubation concentration of NaF (15 μM). After incubation with the nanosensor at 400 μg mL−1 for 24 h, the HepG2 cells showed viability >80%, indicating relatively low cytotoxicity. At the same time, the same group also reported another ratiometric F− nanosensor73 based on emission lifetime imaging, which was designed in combination with semiconductive polymers and TBDPS-capped Ir(III) complexes, where the emission of the polymers was used as a reference. These studies are the first examples realizing phosphorescence lifetime imaging for fluoride.
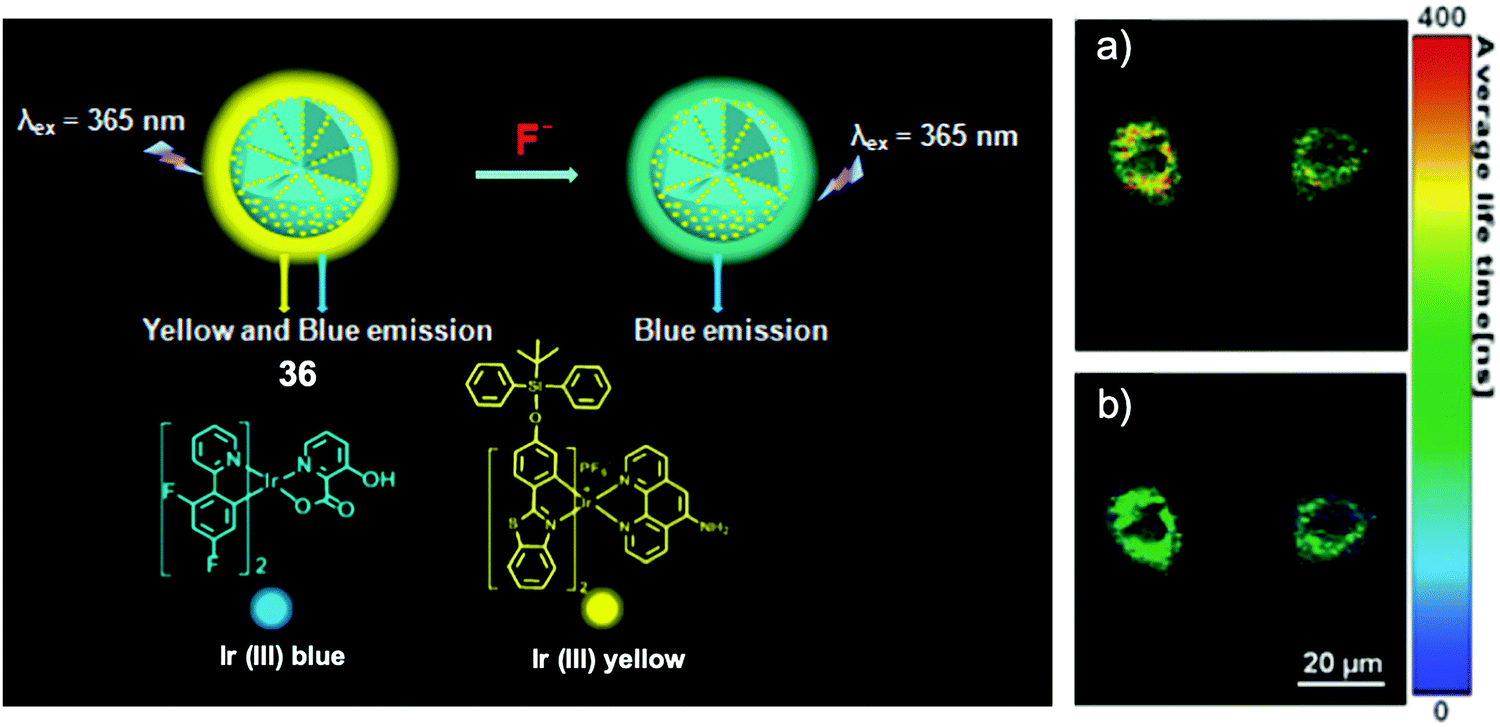 | ||
| Fig. 19 Schematic of ratiometric nanosensor 36 and in vitro imaging. Phosphorescence lifetime images (λex = 405 nm) of HepG2 cells incubated with the nanosensor (a) before and (b) after treatment with 15 μM of NaF. Reproduced with permission from ref. 72. Copyright 2015, Royal Society of Chemistry. | ||
Yang and coworkers74 introduced graphene oxide to improve the sensing performance of a small molecule probe, by self-assembly of a TBDMS group-protected dye molecule on the surface of graphene oxide. In the presence of this type of nanomaterial with excellent chemical catalysis and nanocarrier functions, the reaction rate constant for F− increased 4 times compared to that of the molecular probe, and the response time was shortened from 4 h to about 30 min. The sensitivity of the detection and bioimaging ability were also improved. Despite this, the in vitro study on HeLa cells was only conducted with the F− concentration at 2 mM, which was higher than the value in most of the literature. Recently, another group also reported a graphene oxide-based F− chemodosimeter.75 Unfortunately, no further improvement was achieved.
Besides graphene materials, quantum dots with bright emission were also used to construct composite sensors for fluoride ions. In 2017, Zhang and coworkers76 prepared a ratiometric fluorescent probe by mixing CdTe quantum dots and TIPS-protected 7-hydroxycoumarin, which showed a gradual red-to-blue fluorescence response upon interaction with F− ions in alcohol aqueous solutions. This distinct phenomenon can be clearly observed by the “naked eye” (Fig. 20). Taking this feature, more importantly, the authors further fabricated F− test paper by direct inkjet-printing of the as-prepared “ink” onto filter paper. The test paper maintained excellent sensing performance, with distinguishable fluorescence colors at varied fluoride concentrations. The detection limit was determined to be 0.285 μM, which is much lower than the World Health Organization (WHO) defined limit. The test paper was successfully applied to the analysis of F− in real life samples including tap water, lake water, well water, and human urine. Importantly, the test paper remained stable after storage at 4 °C for 1 month. Despite the outstanding sensing ability, it should be pointed out that the toxicity of CdTe was not considered in this work, as cadmium is a known heavy metal that can cause severe diseases.77 Other quantum dots based on non-toxic metals could be taken into consideration as alternatives.
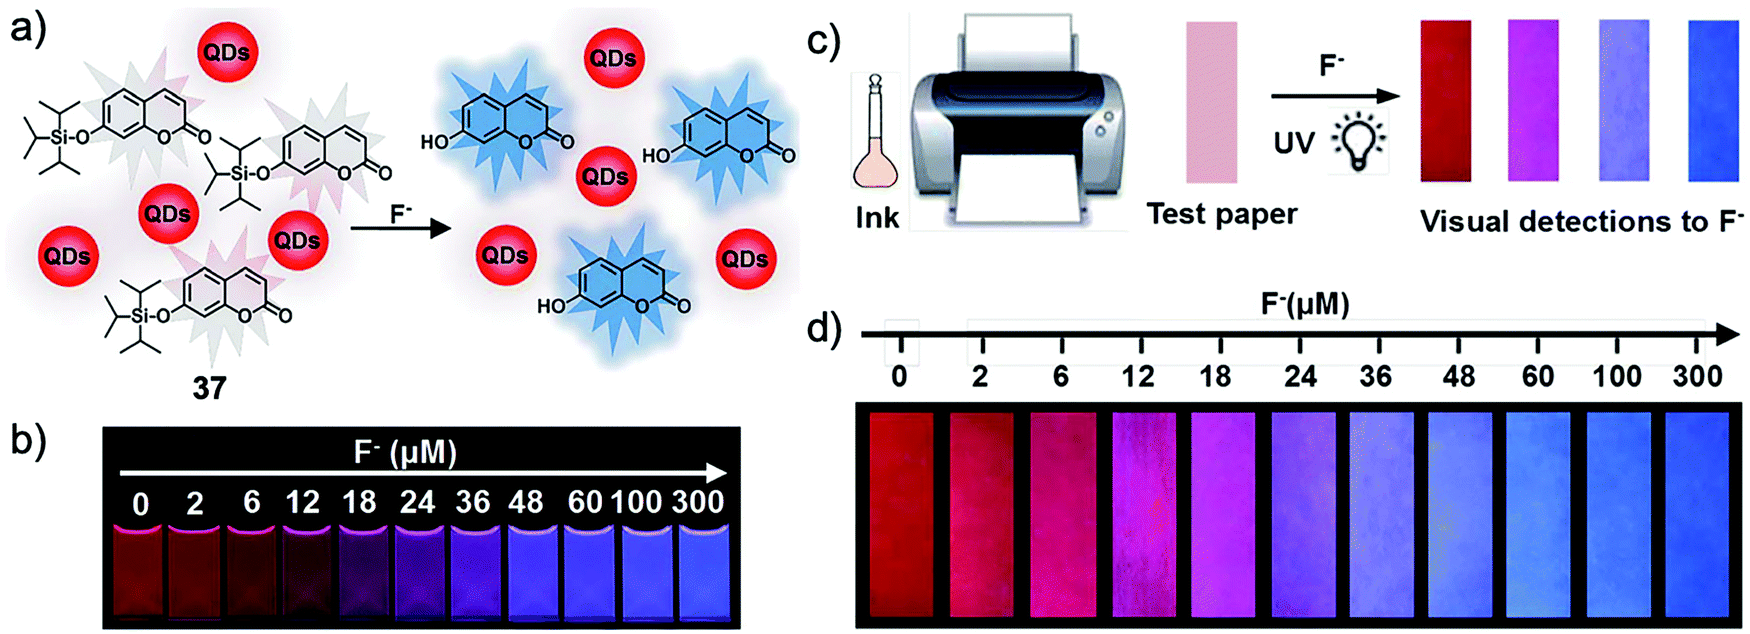 | ||
| Fig. 20 Schematic of the ratiometric nanosensor 37 (a and c) and the sensing performance in solution as well as on test paper (b and d). The sensing was performed in EtOH-H2O (70/30, v/v) or on test paper after the addition of different concentrations of F− for 20 min. The corresponding photos were taken under a 365 nm UV lamp. Reproduced with permission from ref. 76. Open access, Royal Society of Chemistry. | ||
Conclusions and perspectives
During the past two decades, significant progress has been achieved on the research of fluorescent chemodosimeters for fluoride ions via silicon–fluorine chemistry. (i) Thanks to the distinct reaction mechanism of F− sensors based on Si–F interactions, they usually displayed ultrahigh selectivity over other anions; that's why this point was not mentioned above for most of the introduced samples. However, there was recently an exceptional report78 showing that cyanide ions can induce an even stronger fluorescence response than fluoride due to Si–O cleavage. The interference from CN− should be paid attention in some specific situations, as for a number of F− chemodosimeters it was not included as a competing anion. (ii) The F− chemodosimeters also exhibited ultrahigh sensitivity, with a detection limit much lower than the WHO-defined limit value in most cases. This enabled in vitro and in vivo imaging of different cell lines in the presence of F− ions at the micromolar level. (iii) More and more probes were designed for detection of fluoride in aqueous solutions with NaF as the target, so that TBAF analysis in organic solvents has become history. Also, the response time was greatly shortened, located in the minute range, instead of hours. (iv) A series of ratiometric sensors were developed, which gave detection with a recognizable signal by the “naked eye”, as well as more reliable and precise analysis for F− concentration calculation. In vitro ratiometric fluorescence imaging can be performed, providing more accurate information than intensity-dependent imaging. (v) Moreover, in combination with polymeric or inorganic nanomaterials, the sensing performance of the molecular probes can be further enhanced. Particularly, fluorescence lifetime imaging by phosphorescent chemodosimeters provided a new paradigm for in vitro F− study.Despite the distinguished achievements, these F− chemodosimeters still didn’t come into our real life. When we want to check the F− concentration in aqueous solutions, our first choice might still be ion selective electrode analysis. What's the reason? Is the sensing performance not superior enough, or the analysis not so cost-effective? The answer depends on the concrete application. The two main applications of F− fluorescent chemodosimeters are environment protection and human health monitoring. In the case of detection in drinking water or soil, there is usually a maximum value that is allowed, which can be easily achieved by most of the sensors. Thus, to decrease the cost of the synthesis could be more important for this type of application, especially for less developed districts.79 In the case of detection in biofluids like blood or urine, the analysis should be more precise and reliable, at the same time as having the ability to prevent the interference of other biomolecules. Furthermore, for in vitro and especially in vivo detection or imaging, the research is still in its infancy. Most of the studies were done on a few typical cancer cells or preliminary mouse models, which are probably not relevant to real applications, and far from complex human systems. In addition, only a few probes with NIR emission were reported.
The chemical design of efficient organosilicon-based F− fluorescent chemodosimeters has nearly reached a mature stage, but how to use them in the biomedical field has not been well explored. It could be a promising option to collaborate with biochemists or pharmacists, in order to figure out the possible usefulness of these sensor molecules or materials. Recently, a TBDMS-capped fluorescein has been used as a tool to develop a fluorescence assay for γ-butyrobetaine hydroxylase, which is an enzyme playing important biological roles in animals, plants and bacteria.80 This work represented a good example of the F− chemosodimeter's application in biochemistry. Interestingly, a simple TBDMS-coumarin was also used for screening glycosynthase libraries,81 which provided new perspectives on the applications of these molecular probes. On the other hand, a new mechanism such as AIE in the developing process of fluorescent materials can also bring new opportunities for probe design, just like the progress based on ESIPT and ICT. Nowadays, with the help of computational modeling and artificial intelligence, the design of outstanding fluorescent chemodosimeters, not just for F− but also for other analytes, could be much easier than ever before. This is currently happening in the field of drug discovery, thus it won’t be far for the development of bioimaging agents and molecular probes.
Conflicts of interest
There are no conflicts to declare.Acknowledgements
This work is dedicated to Prof. Ruke Bai on the occasion of his recent retirement, from the University of Science and Technology of China.References
- P. D. Beer and P. A. Gale, Angew. Chem., Int. Ed., 2001, 40, 486 CrossRef CAS PubMed.
- (a) S. Xu, K. Chen and H. Tian, J. Mater. Chem., 2005, 15, 2676 RSC; (b) H. Deng and X. Yu, Ind. Eng. Chem. Res., 2012, 51, 2419 CrossRef CAS; (c) P. Miretzky and A. F. Cirelli, J. Fluorine Chem., 2011, 132, 231 CrossRef CAS.
- A. Dhillon, M. Nair and D. Kumar, Anal. Methods, 2016, 8, 5338 RSC.
- J. L. Sessler and J. M. Davis, Acc. Chem. Res., 2001, 34, 989 CrossRef CAS PubMed.
- (a) L. Gai, J. Mack, H. Lu, T. Nyokong, Z. Li, N. Kobayashid and Z. Shen, Coord. Chem. Rev., 2015, 285, 24 CrossRef CAS; (b) J. Han, J. Zhang, M. Gao, H. Hao and X. Xu, Dyes Pigm., 2019, 162, 412 CrossRef CAS; (c) Y. Jiao, B. Zhu, J. Chen and X. Duan, Theranostics, 2015, 5, 173 CrossRef CAS PubMed; (d) Y. Zhou, J. F. Zhang and J. Yoon, Chem. Rev., 2014, 114, 5511 CrossRef CAS PubMed.
- C. R. Wade, A. E. J. Broomsgrove, S. Aldridge and F. P. Gabbaï, Chem. Rev., 2010, 110, 3958 CrossRef CAS PubMed.
- E. Galbraith and T. D. James, Chem. Soc. Rev., 2010, 39, 3831 RSC.
- T. Gunnlaugsson, M. Glynn, G. M. Tocci, P. E. Kruger and F. M. Pfeffer, Coord. Chem. Rev., 2006, 250, 3094 CrossRef CAS.
- L. E. Santos-Figueroa, M. E. Moragues, E. Climent, A. Agostini, R. Martinez-Manez and F. Sancenon, Chem. Soc. Rev., 2013, 42, 3489 RSC.
- P. A. Gale, E. N. W. Howe and X. Wu, Chem, 2016, 1, 351 CAS.
- Y. Yang, Q. Zhao, W. Feng and F. Li, Chem. Rev., 2013, 113, 192 CrossRef CAS PubMed.
- J. Du, M. Hu, J. Fan and X. Peng, Chem. Soc. Rev., 2012, 41, 4511 RSC.
- M. Lalonde and T. H. Chan, Synthesis, 1985, 817 CrossRef CAS.
- S. Yamaguchi, S. Akiyama and K. Tamao, J. Am. Chem. Soc., 2000, 122, 6793 CrossRef CAS.
- A. B. Descalzo, D. Jiménez, J. El Haskouri, D. Beltrán, P. Amorós, M. D. Marcos, R. Martinez-Mañez and J. Soto, Chem. Commun., 2002, 562 RSC.
- E. J. Corey and A. Venkateswarlu, J. Am. Chem. Soc., 1972, 94, 6190 CrossRef CAS.
- T. H. Kim and T. M. Swager, Angew. Chem., Int. Ed., 2003, 42, 4803 CrossRef CAS PubMed.
- (a) S. W. Thomas III, G. D. Joly and T. M. Swager, Chem. Rev., 2007, 107, 1339 CrossRef PubMed; (b) Y. Bao, Q. Li, B. Liu, F. Du, J. Tian, H. Wang, Y. Wang and R. Bai, Chem. Commun., 2012, 48, 118 RSC; (c) Y. Bao, H. Wang, Q. Li, B. Liu, Q. Li, W. Bai, B. Jin and R. Bai, Macromolecules, 2012, 45, 3394 CrossRef CAS; (d) Y. Bao, T. Wang, Q. Li, F. Du, R. Bai, M. Smet and W. Dehaen, Polym. Chem., 2014, 5, 792 RSC; (e) T. Wang, N. Zhang, Q. Li, Z. Li, Y. Bao and R. Bai, Sens. Actuators, B, 2015, 225, 81 CrossRef; (f) T. Wang, N. Zhang, R. Bai and Y. Bao, J. Mater. Chem. C, 2018, 6, 266 CAS.
- C.-Q. Zhu, J.-L. Chen, H. Zheng, Y.-Q. Wu and J.-G. Xu, Anal. Chim. Acta, 2005, 539, 311 CrossRef CAS.
- S. Y. Kim and J. I. Hong, Org. Lett., 2007, 9, 3109 CrossRef CAS PubMed.
- S. Y. Kim, J. Park, M. Koh, S. B. Park and J. I. Hong, Chem. Commun., 2009, 4735 RSC.
- X. F. Yang, S. J. Ye, Q. Bai and X. Q. Wang, J. Fluoresc., 2007, 17, 81 CrossRef CAS PubMed.
- X. F. Yang, Spectrochim. Acta, Part A, 2007, 67, 321 CrossRef PubMed.
- O. A. Bozdemir, F. Sozmen, O. Buyukcakir, R. Guliyev, Y. Cakmak and E. U. Akkaya, Org. Lett., 2010, 12, 1400 CrossRef CAS PubMed.
- X. Cao, W. Lin, Q. Yu and J. Wang, Org. Lett., 2011, 13, 6098 CrossRef CAS PubMed.
- P. Sokkalingam and C. H. Lee, J. Org. Chem., 2011, 76, 3820 CrossRef CAS PubMed.
- J. Cao, C. Zhao, P. Feng, Y. Zhang and W. Zhu, RSC Adv., 2012, 2, 418 RSC.
- X. F. Yang, H. Qi, L. Wang, Z. Su and G. Wang, Talanta, 2009, 80, 92 CrossRef CAS PubMed.
- R. Hu, J. Feng, D. Hu, S. Wang, S. Li, Y. Li and G. Yang, Angew. Chem., Int. Ed., 2010, 49, 4915 CrossRef CAS PubMed.
- J. Chen, P. Zhou, L. Zhao and T. Chu, RSC Adv., 2014, 4, 254 RSC.
- L. Xiong, J. Feng, R. Hu, S. Wang, S. Li, Y. Li and G. Yang, Anal. Chem., 2013, 85, 4113 CrossRef CAS PubMed.
- Y. Bao, B. Liu, H. Wang, J. Tian and R. Bai, Chem. Commun., 2011, 47, 3957 RSC.
- (a) M. Goldman and E. L. Wehry, Anal. Chem., 1970, 42, 1178 CrossRef CAS; (b) E. Bardez, I. Devol, B. Larrey and B. Valeur, J. Phys. Chem. B, 1997, 101, 7786 CrossRef CAS.
- (a) Y. Bao, B. Liu, H. Wang, F. Du and R. Bai, Anal. Methods, 2011, 3, 1274 RSC; (b) F. Du, H. Wang, Y. Bao, B. Liu, H. Zheng and R. Bai, J. Mater. Chem., 2011, 21, 10859 RSC.
- J. S. Chen, P. W. Zhou, S. Q. Yang, A. P. Fu and T. S. Chu, Phys. Chem. Chem. Phys., 2013, 15, 16183 RSC.
- Y. Bao, B. Liu, F. Du, J. Tian, H. Wang and R. Bai, J. Mater. Chem., 2012, 22, 5291 RSC.
- Y. Bao and R. Bai, Prog. Chem., 2013, 25, 288 CAS.
- X. Q. Zhou, R. Lai, H. Li and C. I. Stains, Anal. Chem., 2015, 87, 4081 CrossRef CAS PubMed.
- J. F. Zhang, C. S. Lim, S. Bhuniya, B. R. Cho and J. S. Kim, Org. Lett., 2011, 13, 1190 CrossRef CAS PubMed.
- (a) Y. Bao, E. Guégain, V. Nicolas and J. Nicolas, Chem. Commun., 2017, 53, 4489 RSC; (b) Y. Bao, E. Guegain, J. Mougin and J. Nicolas, Polym. Chem., 2018, 9, 687 RSC; (c) Y. Bao and J. Nicolas, Polym. Chem., 2017, 8, 5174 RSC; (d) Y. Bao, H. D. Keersmaecker, S. Corneillie, F. Yu, H. Mizuno, G. F. Zhang, J. Hofkens, B. Mendrek, A. Kowalczuk and M. Smet, Chem. Mater., 2015, 27, 3450 CrossRef CAS.
- V. Bhalla, H. Singh and M. Kumar, Org. Lett., 2010, 12, 628 CrossRef CAS PubMed.
- H. Lenormand, J. P. Goddard and L. Fensterbank, Org. Lett., 2013, 15, 748 CrossRef CAS.
- B. Li, C. Zhang, C. Liu, J. Chen, X. Wang, Z. Liu and F. Yi, RSC Adv., 2014, 4, 46016 RSC.
- K. M. Mahoney, P. P. Goswami and A. H. Winter, J. Org. Chem., 2013, 78, 702 CrossRef CAS PubMed.
- A. Roy, D. Kand, T. Saha and P. Talukdar, Chem. Commun., 2014, 50, 5510 RSC.
- A. Roy, D. Kand, T. Saha and P. Talukdar, RSC Adv., 2014, 4, 33890 RSC.
- X.-Y. Wang, F.-J. Guan, B. Li, H. Zhang, H.-W. Wu, K. Ji and C.-X. Liu, Chin. Chem. Lett., 2016, 27, 211 CrossRef CAS.
- L. Fu, F.-L. Jiang, D. Fortin, P. D. Harvey and Y. Liu, Chem. Commun., 2011, 47, 5503 RSC.
- M. Kaur, M. J. Cho and D. H. Choi, Dyes Pigm., 2014, 103, 154 CrossRef CAS.
- M. R. Rao, S. M. Mobin and M. Ravikanth, Tetrahedron, 2010, 66, 1728 CrossRef CAS.
- D. Buckland, S. V. Bhosale and S. J. Langford, Tetrahedron Lett., 2011, 52, 1990 CrossRef CAS.
- B. Zhu, F. Yuan, R. Li, Y. Li, Q. Wei, Z. Ma, B. Du and X. Zhang, Chem. Commun., 2011, 47, 7098 RSC.
- B. Ke, W. Chen, N. Ni, Y. Cheng, C. Dai, H. Dinh and B. Wang, Chem. Commun., 2013, 49, 2494 RSC.
- P. Hou, S. Chen, H. Wang, J. Wang, K. Voitchovsky and X. Song, Chem. Commun., 2014, 50, 320 RSC.
- X. Zhu, J. Wang, J. Zhang, Z. Chen, H. Zhang and X. Zhang, Sensors, 2015, 15, 1611 CrossRef CAS PubMed.
- S. Goswami, A. K. Das, A. Manna, A. K. Maity, H. Fun, C. K. Quah and P. Saha, Tetrahedron Lett., 2014, 55, 2633 CrossRef CAS.
- X.-M. Shi, W.-L. Fan, C.-H. Fan, Z.-L. Lu, Q.-B. Bo, Z. Wang, F.-F. Wang and Y.-Q. Wang, Dyes Pigm., 2017, 140, 109 CrossRef CAS.
- Y. Shen, X. Zhang, Y. Zhang, H. Li and Y. Chen, Sens. Actuators, B, 2018, 258, 544 CrossRef CAS.
- Y. Zheng, Y. Duan, K. Jia, R. L. Wang and B. Wang, RSC Adv., 2016, 6, 25242 RSC.
- B. Zou, H. Liu, J. Mack, S. Wang, J. Tian, H. Lu, Z. Li and Z. Shen, RSC Adv., 2014, 4, 53864 RSC.
- A. Feng, Y. Jia, L. Huang, L. Wang, G. Zhou, S. Wang and P. Liu, Spectrochim. Acta, Part A, 2019, 220, 117108 CrossRef CAS PubMed.
- G. Jiang, X. Liu, Y. Wu, J. Wang, X. Dong, G. Zhang, Y. Li and X. Fan, RSC Adv., 2016, 6, 59400 RSC.
- (a) J. Luo, Z. Xie, J. W. Y. Lam, L. Cheng, H. Chen, C. Qiu, H. S. Kwok, X. Zhan, Y. Liu, D. Zhu and B. Z. Tang, Chem. Commun., 2001, 1740 RSC; (b) Y. Hong, J. W. Y. Lam and B. Z. Tang, Chem. Soc. Rev., 2011, 40, 5361 RSC.
- (a) D. Kim, S. Singha, T. Wang, E. Seo, J. H. Lee, S. J. Lee and K. H. Ahn, Chem. Commun., 2012, 48, 10243 RSC; (b) W. Hu, L. Zeng, Y. Wang, Z. Liu, X. Ye and C. Li, Analyst, 2016, 141, 5450 RSC.
- Z. Wu and X. Tang, Anal. Chem., 2015, 87, 8613 CrossRef CAS PubMed.
- W.-X. Wu, J. Li, L.-Z. Chen, Z. Ma, W. Zhang, Z.-Z. Liu, Y.-N. Cheng, L.-P. Du and M.-Y. Li, Anal. Chem., 2014, 86, 9800 CrossRef CAS PubMed.
- Y. Y. Jiang, X. L. Hu, J. M. Hu, H. Liu, H. Zhong and S. Y. Liu, Macromolecules, 2011, 44, 8780 CrossRef CAS.
- F. Zheng, F. Zeng, C. Yu, X. Hou and S. Wu, Chem. – Eur. J., 2013, 19, 936 CrossRef CAS PubMed.
- F. Du, Y. Bao, B. Liu, J. Tian, Q. Li and R. Bai, Chem. Commun., 2013, 49, 4631 RSC.
- (a) L. Gai, H. Chen, B. Zou, H. Lu, G. Lai, Z. Li and Z. Shen, Chem. Commun., 2012, 48, 10721 RSC; (b) S. Chanmungkalakul, V. Ervithayasuporn, S. Hanprasit, M. Masik, N. Prigyai and S. Kiatkamjornwong, Chem. Commun., 2017, 53, 12108 RSC.
- Y. Huang, C. Chen, P. Wu, S. Kuo and Y. Chan, J. Mater. Chem. B, 2014, 2, 6188 RSC.
- S. Liu, J. Zhang, D. Shen, H. Liang, X. Liu, Q. Zhao and W. Huang, Chem. Commun., 2015, 51, 12839 RSC.
- Q. Zhao, C. Zhang, S. Liu, Y. Liu, K. Y. Zhang, X. Zhou, J. Jiang, W. Xu, T. Yang and W. Huang, Sci. Rep., 2015, 5, 16420 CrossRef CAS PubMed.
- C. Wang, S. Yang, M. Yi, C. Liu, Y. Wang, J. Li, Y. Li and R. Yang, ACS Appl. Mater. Interfaces, 2014, 6, 9768 CrossRef CAS PubMed.
- Y. Xu, Q. Yang, D. Cao, Z. Liu, S. Zhao, R. Guan, Y. Wang, Q. Wu and X. Yu, Spectrochim. Acta, Part A, 2017, 182, 37 CrossRef CAS PubMed.
- X. Yu, L. Yang, T. Zhao, R. Zhang, L. Yang, C. Jiang, J. Zhao, B. Liu and Z. Zhang, RSC Adv., 2017, 7, 53379 RSC.
- W. Maret and J.-M. Moulis, The Bioinorganic Chemistry of Cadmium in the Context of its Toxicity, in Cadmium: From Toxicology to Essentiality. Metal Ions in Life Sciences, ed. A. Sigel, H. Sigel and R. K. O. Sigel, Springer, 2013, ch. 1, vol. 11, pp. 1–30 Search PubMed.
- Y. Y. Chen, L. T. Zhao, H. H. Fu, C. H. Rao, Z. Y. Li and C. X. Liu, New J. Chem., 2017, 41, 8734 RSC.
- C. M. Lopez-Alled, A. Sanchez-Fernandez, K. J. Edler, A. C. Sedgwick, S. D. Bull, C. L. McMullin, G. Kociok-Kohn, T. D. James, J. Wenk and S. E. Lewis, Chem. Commun., 2017, 53, 12580 RSC.
- A. Rydzik, I. K. H. Leung, G. T. Kochan, A. Thalhammer, U. Opperman, T. D. W. Claridge and C. J. Schofield, ChemBioChem, 2012, 13, 1559 CrossRef CAS PubMed.
- E. Andrés, H. Aragunde and A. Planas, Biochem. J., 2014, 458, 355 CrossRef PubMed.
| This journal is © The Royal Society of Chemistry 2019 |