 Open Access Article
Creative Commons Attribution 3.0 Unported Licence
Impact of proton-induced transmutation doping in semiconductors for space applications†‡
Julie V.
Logan
 *a,
Michael P.
Short
a,
Preston T.
Webster
b,
Christian P.
Morath
b and
Elizabeth H.
Steenbergen
b
aDepartment of Nuclear Science and Engineering, Massachusetts Institute of Technology, Cambridge, USA. E-mail: jvl2xv@mit.edu
bSpace Vehicles Directorate, Air Force Research Laboratory, Kirtland Air Force Base, USA
First published on 27th June 2019
Abstract
Critical satellite-based electronics can fail due to irradiation with Van Allen belt trapped protons. While nuclear-reaction-induced transmutation damage is typically ignored, a recent study raised the question of its potential importance in explaining anomalous trends in III–V nBn device operation. To investigate this postulation and to generally quantify the importance of transmutation in semiconductors for space applications, transmutation rates occurring in eight prominent semiconductor systems irradiated with typical device qualification protons of 63 MeV and operating in LEO, MEO, and GEO orbits are examined computationally employing FISPACT-II (validated through experiment and GEANT4 simulations). It is found that the transmutation realized in the III–V nBn device is three orders of magnitude less than would have been required to bring experiment into agreement with theory and that, furthermore, the total transmuted elemental concentrations never exceed 1010 cm−3 in any semiconductor at the end of 10 years of operation in any orbit considered. Thus, the effect of nuclear transmutation can be safely neglected in predicting modern device operation in orbit.
1 Introduction
Satellite-based hybridized focal plane arrays (FPAs), with the purpose of infrared imaging from space, have their functionality altered through the course of their operating lifetime by the radiation environment in which they are situated. Due to their cumulative damage efficiency, the dominant radiation at fault is high energy protons, above 10 s of MeV. The three main sources of these protons are the Van Allen belts, solar events, and intergalactic cosmic rays. The Van Allen belts constitute the dominant source and are visualized in Fig. 1, overlaid with important satellite orbits.1 As protons constitute 95–96% of trapped ions, higher atomic number constituents of the radiation belts are not included in this analysis.2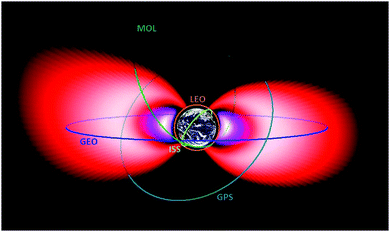 | ||
| Fig. 1 Graphical representation of the inner and outer Van Allen belts along with the LEO (ISS in the figure), MEO (GPS in the figure), and GEO orbits considered in this analysis, the parameters of which are given in Table 2. Graphic from: AFRL AE9/AP9 Development Team https://www.vdl.afrl.af.mil/programs/ae9ap9/images/. | ||
The modes through which incident protons alter semiconductor devices are traditionally categorized into ionization damage and displacement damage. The former is also referred to as total ionizing dose and comes about as protons pass through material, continuously interacting through the long-range Coulombic force with electrons, causing ionization of valence band electrons due to the energy transfer. This electronic stopping is the dominant energy loss mechanism for protons with energy in excess of 1 keV for all materials.3 The electron–hole pairs produced manifest as excess trapped charge and result in unwanted surface-currents in detector pixels, but high-quality surface passivation can minimize their detrimental effect.4 It should be noted that in ionization damage, the nuclei (lattice atoms) are not altered and the crystal structure is not impacted. In contrast, the second traditional categorization of proton device impact is displacement damage, resulting from proton interactions directly with lattice atoms. In this interaction, protons interact with nuclei through either the Coulomb force (elastic Rutherford scattering) or through the Nuclear force (elastic or inelastic nuclear scattering). If sufficient momentum is transferred to the lattice atom (in excess of the displacement energy threshold) this lattice atom will be displaced from its stable lattice position and a vacancy-interstitial (Frenkel) pair will be produced. This interstitial is known as the primary knock-on atom (PKA) and can generate a number of secondary defects.3 When this occurs within the absorbing layer of a FPA pixel, the resulting imperfections in the crystal structure can serve as electronically active defects where electron–hole recombination can occur, resulting in a reduction in the minority carrier recombination lifetime. This leads to an increase in dark current and a possible decrease in the quantum efficiency of the pixel. These defects also contribute to an overall reduction in FPA uniformity.1
A third different category of radiation damage exists. Rather than undergoing a scattering reaction, the proton can also interact with lattice atoms through nuclear reactions.5 Neutrons are most commonly emitted in such reactions, as they experience no Coulomb barrier to nuclear escape, but protons and even α particles can be emitted. These reactions are often referred to through their incoming and outgoing particles, with those most relevant for MeV protons being (p, xp), (p, xn), (p, x1p + x2n), (p, α), and (p, α + p), where x is an integer generally less than five for reactions of importance to this effort.6 These represent proton interaction with the nucleus resulting in the emission of x protons, x neutrons, x1 protons and x2 neutrons, an α particle, and an α and a proton respectively.
It is observed that these cross-sections generally peak at 10x MeV where x is the number of neutrons emitted from the unstable nucleus through the (p, xn) reaction. This trend is visualized for two representative elements in Fig. 2. Due to the strong energy dependence of these cross-sections, the amount of transmutation and resulting impurity concentrations are heavily dependent on the spectrum of the incident protons. For this reason, realistic spectra associated with satellite orbits are analyzed in the second section of this document.
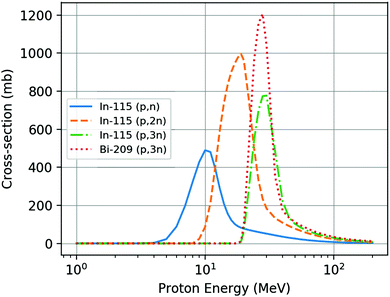 | ||
| Fig. 2 Proton inelastic nuclear reaction cross-sections for the In-115 (p, n) (p, 2n), (p, 3n) and Bi-209 (p, 3n) reactions. These cross-sections show the general trend for the elements considered in this analysis whereby the cross-sections peak at ∼10x MeV with x given by (p, xn) for the reaction. The data is obtained from the most recent TENDL-2017 database.7 | ||
Following the proton nuclear reaction, a nucleus may reach a more stable nuclear state primarily via the emission of photons in gamma decay or through beta decay in which a neutron is converted to a proton or vice versa.5 While these nuclear reactions and decays are not one of the traditional device impact categories, they have been hypothesized to potentially impact an optoelectronic device by changing the dopant concentration in the absorber layer of a FPA pixel. These proton-induced nuclear reactions have recently been theorized as a potential cause of anomalous trends in III–V (InAs) nBn detector diffusion limited dark current as a function of 63 MeV proton fluence.8 This detector is composed of a barrier layer between two n-type semiconductors, with the purpose of reducing Shockley–Read–Hall generation currents. The experimental observations can be made to align with theory only if the 5.3 × 10¹¹ p+ per cm2 irradiation induces an n-type doping alteration of 8 × 1013 cm−3. The authors proposed nuclear transmutation of In to Sn as the potential cause.8
This postulation of proton-induced nuclear transmutation as a potential cause of alteration of optoelectronic device performance calls for a thorough quantification of the effective nuclear transmutation for all semiconductors expected to operate in the space radiation environment, as their doping concentration could be variable as a function of device operating lifetime. If variability is significant for a particular device, the type and concentration of transmuted nuclei should be accounted for in accurate prediction of device operation as a function of device operation lifetime and orbit.
In order to accomplish this goal, the effect of proton transmutation for semiconductors summarized in Table 1 is investigated through calculation (using the multiphysics inventory code FISPACT-II9) and Monte Carlo simulation (using the particle transport code GEANT410) for incident 63 MeV protons, which are typically employed in military radiation hardness qualifications.8 Following experimental validation, FISPACT-II is then employed to quantify the anticipated transmutation for each semiconductor throughout the course of its operating lifetime in inclined nonpolar low earth orbit (LEO), polar sun-synchronous LEO, semi-synchronous medium earth orbit (MEO), and geostationary orbit (GEO). These orbits are visualized in Fig. 1. Table 1 summarizes the final total impurity concentrations produced in typical device qualification scenarios (7.5 × 10¹¹ p+ per cm2 of 63 MeV) and in satellite orbits.
| GaAs | Hg0.7Cd0.3Te | InAs0.91Sb0.09 | InAs | InSb0.5Bi0.5 | InSb0.95Bi0.05 | InSb | Si | |||
|---|---|---|---|---|---|---|---|---|---|---|
| Density (g cm−3) | 5.31 | 7.43 | 5.68 | 5.68 | 6.64 | 5.87 | 5.77 | 2.33 | ||
| Impurity atoms (108 cm−3) | 1 day | 100 krad 10 MeV | 213.14 | 74.03 | 163.07 | 169.11 | 90.55 | 113.62 | 116.03 | 3.28 |
| 100 krad 10–50 MeV | 241.19 | 150.13 | 220.30 | 219.30 | 205.47 | 229.90 | 232.23 | 225.69 | ||
| 100 krad 63 MeV | 232.30 | 105.66 | 206.66 | 205.12 | 207.37 | 221.63 | 222.81 | 233.76 | ||
| 100 krad 100 MeV | 237.86 | 124.23 | 224.71 | 224.57 | 228.82 | 230.01 | 229.67 | 218.53 | ||
| 10 years | LEO Incl Nonpol | 0.80 | 0.42 | 3.44 | 3.51 | 2.87 | 2.92 | 2.92 | 0.58 | |
| LEO Polar sun-sync | 27.34 | 14.24 | 29.11 | 29.52 | 26.65 | 26.33 | 26.24 | 19.78 | ||
| MEO | 1.05 | 0.01 | 2.74 | 2.81 | 2.15 | 2.22 | 2.22 | 0.90 | ||
| GEO | 0.003 | 0.01 | 2.65 | 2.71 | 2.15 | 2.21 | 2.21 | 0.02 | ||
2 Methods
This investigation considers two different scenarios: earth-based device qualification monoenergetic proton irradiation and satellite-based device operation trapped proton spectrum exposure. The monoenergetic irradiation scenario consisted of FISPACT-II calculations, GEANT4 simulations, and gamma spectroscopy characterization of GaAs samples irradiated with 63 MeV protons to validate the above. In the satellite-based full-spectrum scenario, the realistic orbital proton spectra and fluences are employed to track transmuted concentrations throughout the semiconductor operational lifetime in space.For all computations, semiconductors of compositions and densities summarized in Table 1 are modeled, while bare semi-insulating GaAs wafer is used in the experimental validation.
In the monoenergetic irradiation experimental validation stage, computations are modeled to match experiment, with samples having a face dimension of 1 cm by 1 cm and a thickness of 0.5 mm (sufficiently thin that protons lose less than 5% of their incident energy in traversing the target). The computation within FISPACT-II matched the experimental 63 MeV proton spectrum. A fluence of 1012 p+ per cm2 is employed and then scaled to match the 7.5 × 10¹² p+ per cm2 experimental validation fluence (associated with a device dose of 1 Mrad(Si) normal incidence proton beam) for each semiconductor material. Transmutation scales linearly with total proton fluence, so deterministic results may be scaled to match experiment with no impact on results. These monoenergetic results are also scaled and utilized for other 63 MeV experimental testing scenarios (for example, 7.5 × 10¹¹ p+ per cm2 63 MeV as shown in Table 1). FISPACT-II is a deterministic code for which the computational time does not scale with fluence (as discussed further in Section 2.2). Within the Monte-Carlo code, it is statistically sufficient to simulate 109 protons for each material, as this results in standard deviations of less than 5% for all non-trace transmuted elements produced (those with concentrations of >107 cm−3). The results are scaled to match the experimental fluence in post-processing. The incident proton fluence is imparted over a short time period as a pencil beam in simulation (to mimic experimental accelerator irradiation) and the transmuted concentration of elements is extracted at 46 days to match the time of experimental characterization of semiconductor transmutation.
In the full-spectrum satellite-based scenario, the validated FISPACT-II code is employed with the input flux spectra visualized in Fig. 3, binned into the CCFE-162 group structure as implemented in and required by the code.11Fig. 1 visually demonstrates the inclined nonpolar low earth orbit (LEO), polar sun-synchronous LEO, semi-synchronous medium earth orbit (MEO), and geostationary orbit (GEO) considered in this analysis. The parameters associated with these orbits are found in Table 2. The inclined nonpolar LEO is the orbit of the International Space Station. The polar sun-synchronous LEO is conducted at the upper bound of this orbit class and these orbits are employed for remote sensing and weather satellites. The MEO semi-synchronous orbit is used for the purposes of navigation, communication, and space environment monitoring. Finally, the GEO orbit is used for satellites whose purposes include communications, early warning, nuclear detection, and weather.12 The trapped proton spectra associated with these orbits are obtained from the solar minimum AP8 model for Van Allen belt trapped radiation sourced from the SPace ENVironment Information System (SPENVIS) maintained by the European Space Agency.13 The incident flux is imparted continuously, as is approximate in the space environment, for a period of 10 years and the concentration of transmuted elements is quantified as a function of time. Temporal non-uniformity in the true operating environment will be of small significance because transmutation is a long-term cumulative effect. In this full-spectrum irradiation case, samples are defined to be 1 cm3 in volume, but this parameter does not affect FISPACT-II results as the concentrations are cited in terms of atoms per unit volume and the flux is given as a scalar quantity.11
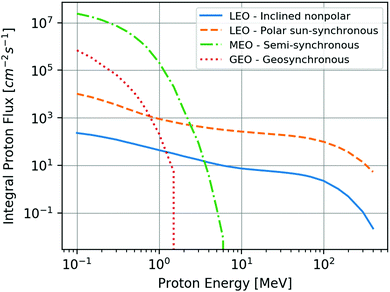 | ||
| Fig. 3 Proton cumulative integral flux energy distributions associated with inclined nonpolar low earth orbit (LEO), polar sun-synchronous LEO, semi-synchronous medium earth orbit (MEO), and geostationary orbit (GEO) defined in Table 2. These spectra are employed in FISPACT-II calculations (trapped proton full-spectrum) of elemental transmutation in all semiconductors considered in this effort.13 | ||
| Category | Orbit type | Altitude (km) | Period (h) | Tilt (°) | Shape | Integral flux (cm−2 s−1) |
|---|---|---|---|---|---|---|
| Low earth orbit (LEO) | Inclined nonpolar | 340 | 1.5 | 51.6 | Circular | 2.29 × 10² |
| Low earth orbit (LEO) | Polar sun-synchronous | 900 | 1.7 | 98 | Circular | 1.02 × 10⁴ |
| Medium earth orbit (MEO) | Semi-synchronous | 20![[thin space (1/6-em)]](https://www.rsc.org/images/entities/char_2009.gif) 100 100 |
12 | 55 | Circular | 2.43 × 10⁷ |
| Geostationary orbit (GEO) | Geosynchronous | 35![[thin space (1/6-em)]](https://www.rsc.org/images/entities/char_2009.gif) 786 786 |
24 | 0 | Circular | 6.9 × 10⁵ |
The experimental validation of transmuted elemental concentrations is accomplished through comparison of experimentally realized and computationally predicted gamma spectra of an irradiated GaAs sample. The samples became radioactive due to proton-induced nuclear reactions, which are also the cause of nuclear transmutation and potential semiconductor doping variability. The gamma rays emitted in subsequent nuclear decays to a more stable nuclear state are detected experimentally and compared to those predicted from computation of transmutation. This being the case, all isotopes of all elements required tracking, even those of elements naturally occurring in the sample. For the full-spectrum proton exposure, where impurity concentration is the primary quantity of interest, only those elements not naturally found in the semiconductor are included in the results.
The three transmutation quantification methods will now be discussed in practical detail. All data, scripts, and intermediate analysis files can be found on our GitHub repository for this manuscript https://github.com/jvl2xv/SemiconductorTransmutation.14
2.1 GEANT4 Monte Carlo simulation method
Version 10.3.0 of GEANT4 was used, as implemented on the MIT PSFC Engaging Cluster. In GEANT4, the physics models employed in the simulation must be specified by the user. The physics list employed in this effort is the Shielding physics list. This physics list is recommended for Space Radiation15 and includes the following relevant proton interaction models: multiple scattering, hadron ionization, hadron elastic processes (G4WHadronElasticProcess), and proton inelastic processes (Bertini cascade model from 0–5.0 GeV).15,16 It also includes radioactive decay by default, a critical requirement for this effort as elemental concentrations are tracked as a function of time. The Shielding physics list employs the Bertini Cascade Model (BERT) for energies of interest in this analysis (E < 10 GeV) and contains improved neutron interaction cross-section data from JENDL.15 Furthermore, it has been widely employed by efforts interested in protons of similar energies to those considered here.17–19To extract temporal information from this simulation, every particle (including nuclei) produced in the process of proton transport through the material is recorded, in addition to its time of creation and its associated incident proton source number. With this information, the impurity isotopic composition of the sample could be surmised at any given time. In order to permit direct comparison with experiment, the activity of all extant isotopes is calculated to produce a gamma spectrum that can be directly compared to experiment.
2.2 FISPACT-II inventory calculation method
An additional method employed to quantify transmutation is calculation using published natural abundances, cross-sections, and decay data as implemented in the FISPACT-II enhanced multiphysics inventory and nuclear observables system.11 This code is capable of computing activation and transmutation caused by charged-particle and neutron irradiation. It employs the most recent incident-particle nuclear data from the TENDL-2017, HEIR-0.1, ENDF/B.VIII.0, JEFF-3.3, JENDL-4.0, and CENDL-3.1 international libraries and is maintained by the UK Atomic Energy Authority.11 Specifically for this application, the FISPACT 2017 TENDL database (gxs-162) is used for nuclear reaction cross-sections, the UKAEDD-12 decay library is used for decay data, and the UKFY-4.1 library (as obtained from JEFF-3.1.1 decay data) is used for fission yields. It should be noted that this library ignores decays with half-lives of greater than 1000 years and that it also only contains fission yield information for 19 of the 90 nuclides in the proton-induced fission cross-section database. For the others, FISPACT-II employs yields for neighboring elements. All input files are in the ENDF-6 file format.11FISPACT-II condenses these libraries given the incident radiation spectrum inputted by the user. It then solves a series of deterministic rate equations which describe the transmutation of the initial set of nuclides in the sample caused by the input radiation and by spontaneous radioactive decay. This code assumes a homogeneous, infinite, and infinitely dilute sample in which the concentration of each nuclide i, Ni, evolves according to a stiff ODE set of rate equations of the form
 | (1) |
It should be noted that, as the published proton cross-section databases do not contain uncertainty quantification for proton reactions, no uncertainties can be derived from this deterministic code. The validity of the results is determined by the accuracy of the cross-section libraries employed.11
2.3 Experimental method
In order to validate the simulations and calculations performed, GaAs samples were irradiated at the Crocker Nuclear Laboratory at the University of California, Davis, 76′′ isochronous cyclotron with 7.5 × 10¹² p+ per cm2 of 63 MeV at normal incidence (a dose equivalence of 1 Mrad(Si)). This large fluence is used to minimize the uncertainty in quantifying transmuted elements produced.20 The residual radioactivity of samples is measured using a Canberra Industries Genie-2000 Spectroscopy System High Purity Ge Detector to permit adequate energy resolution for isotopic identification.21 This counting was conducted 46 days after irradiation. The duration of counting was 68.75 hours to minimize statistical uncertainty in the decay rate, which is used to predict transmuted nuclei concentrations. The experimental spectrum is calibrated in energy and efficiency using a reference source. Background is removed by subtracting the 96.0 hour counting spectrum obtained from an identical unirradiated sample. Energy peaks are identified and integrated to yield counts using the Ortec GammaVision software sum/non-linear least-squares (LSQ) fit peak identification and area calculation.22 The resulting peaks in the gamma activity spectrum at 46 days post-irradiation are compared with the predicted gamma activity spectra at this point in time from the two computational methods.3 Results
3.1 Monoenergetic proton spectrum: earth-based
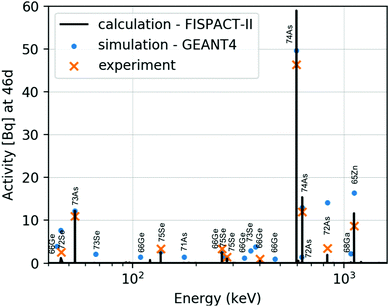
The resulting gamma spectra at 46 days following rapid GaAs irradiation with 63 MeV protons as predicted from FISPACT-II calculation, GEANT4 simulation, and realized in experiment are visualized in Fig. 4, labeled with each isotope associated with the major decays. The uncertainties are too small to be observed.Quantitatively, it is seen that when the gamma peaks are binned into 1 keV increments (necessary due to energy uncertainty in experimental results), the root mean square error of the calculated and simulated results are 0.36 Bq and 0.47 ± 0.02 Bq respectively (including only energies above 82 keV because below this value the experimental efficiency curve decreases rapidly,23 as shown in the ESI‡). This leads to the conclusion that the FISPACT-II results are both more accurate and have a smaller error due to the fact that they are not generated through a Monte Carlo technique. Both methods correctly identified over 95% of experimental peaks as defined through this binning mechanism. This is deemed as sufficient accuracy to permit use of the FISPACT-II code in the satellite-based full-spectrum scenario.
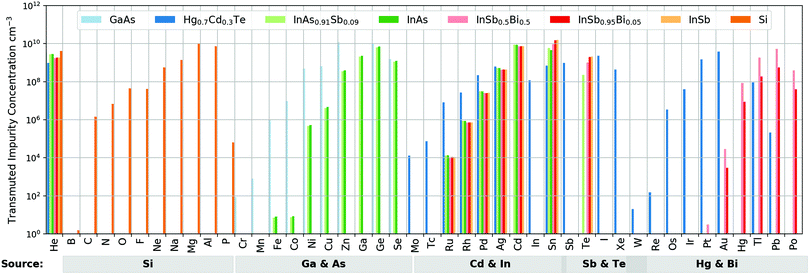
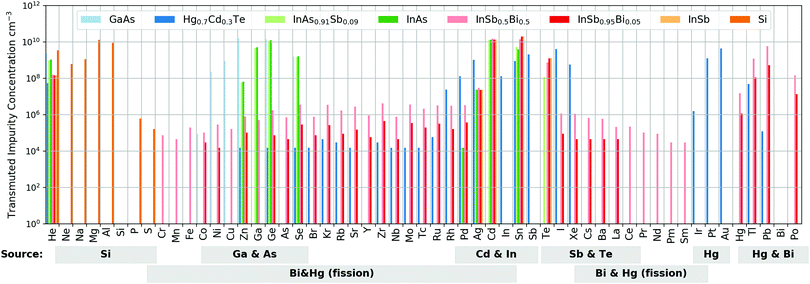
For completeness and for use in ground-based device radiation hardness studies, the elemental concentrations (aggregated over all isotopes) of transmuted elements produced in each semiconductor as a consequence of 7.5 × 10¹¹ p+ per cm2 of 63 MeV for each semiconductor material at 46 days are visualized in Fig. 5 as derived from FISPACT-II and in Fig. 6 as derived from GEANT4. Alpha (α) particles are included in He concentrations given. The error-bars are again too small to be readily discernible in the GEANT4 results (and do not exist for the FISPACT results, as discussed in Section 2.2). The two plots are graphed on the same y-scale for ease of direct comparison. Below each plot, the dominant source element for each impurity element is given. Quantitatively, the total impurity concentrations produced in each semiconductor according to the two methods are presented in Table 3, where it is observed that disagreement does not exceed 26% in any material. The two methods do not yield perfect agreement because FISPACT-II derives its cross-sections from published libraries while GEANT4 derives its cross-sections from nuclear models, as discussed in Section 2.
| GaAs | Hg0.7Cd0.3Te | InAs0.91Sb0.09 | InAs | InSb0.5Bi0.5 | InSb0.95Bi0.05 | InSb | Si | |
|---|---|---|---|---|---|---|---|---|
| GEANT4 | 3.465 | 1.457 | 3.712 | 3.730 | 3.693 | 3.562 | 3.530 | 2.693 |
| FISPACT-II | 2.817 | 1.181 | 2.784 | 2.795 | 2.744 | 2.747 | 2.741 | 2.338 |
| Percent difference (%) | 18.7 | 18.9 | 25.0 | 25.1 | 25.7 | 22.9 | 22.3 | 13.2 |
Despite, the excellent overall agreement in impurity concentration, there are clear differences between the two codes. The most obvious is the fact that GEANT4 predicts the existence of fission daughter isotopes from proton-induced fission of Bi and Hg, as shown in Fig. 6. FISPACT-II does predict the occurrence of this fission, but the daughter isotopes are produced in a manner that is in disagreement with GEANT4. It is hypothesized that this may be a result of improper treatment of fission yields, as it is mentioned in Section 2 that FISPACT-II only includes fission yield information for less than half of isotopes for which it includes proton-induced fission cross-sections. For the present purpose of transmutation analysis, this discrepancy is of little import due to the infinitesimal concentrations of these fission daughter isotopes, as predicted by GEANT4, of no more than 5 × 106 cm−3.
As FISPACT-II uses the most up-to-date experimentally validated cross-sectional databases and the results are generally in good agreement with those of experiment and GEANT4, FISPACT-II is selected for use in the realistic satellite orbital transmutation computations conducted in Section 3.2.11 Additional benefits of this deterministic code are that it is not plagued by statistical variability and that a given run takes about 100× less time than a GEANT4 simulation of the same system.
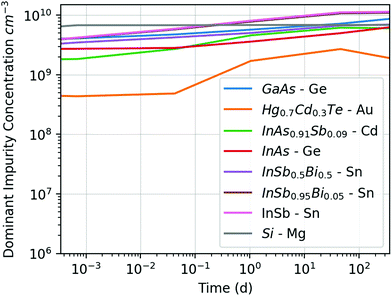
As mentioned in Section 1, transmutation doping has recently been proposed as a potential cause for anomalous dark current trends in InAs nBn device operation following proton irradiation with 5.3 × 10¹¹ p+ per cm2 (100 krad (Si) dose at 45°) 63 MeV protons.8 However, when this irradiation is mimicked through computation, the relatively large concentration of Sn (at 46 days) produced in InAs (2.772 ± 0.005 × 109 cm−3 according to GEANT4 and 3.243 × 109 cm−3 according to FISPACT-II) is insufficient to explain the dark current trends experimentally observed as a much larger concentration of transmuted Sn would have been required to explain their results. Specifically, they observed an apparent increase in n-type carrier concentration from 1.5 × 1014 cm−3 to 2.3 × 1014 cm−3, a net increase of 8 × 1013 cm−3 n-type carriers. This increase is more than four orders of magnitude larger than can be explained by transmutation to Sn according to the computations employed in this effort and is over three orders of magnitude larger than the total InAs transmuted concentration (all of which would not act as n-type dopants and would serve to compensate one another to some degree). Furthermore, it is not the case that the authors of this paper were observing a transient spike in Sn concentration because the dominant impurity elements do not show large post-irradiation temporal transients in any semiconductor considered following 63 MeV proton irradiation, as visualized in Fig. 7, where the concentration of the dominant impurity at one year in each semiconductor considered is visualized as a function of time following a 30 second irradiation with 5.3 × 10¹¹ p+ per cm2 63 MeV protons. The dominant InAs impurity at one year is Ge, as shown in Fig. 7, but Sn shows a similar concentration trend as a function of time. This is the case because the stable Sn concentrations of Sn-112 and Sn-114 are being increased by other decays while the unstable Sn isotopes (primarily Sn-110 and Sn-111) decay away and the two balance each other over this interval. As such, transmutation can be definitively ruled out as a cause for the anomalous dark current trend.
3.2 Orbital trapped proton spectrum: satellite-based
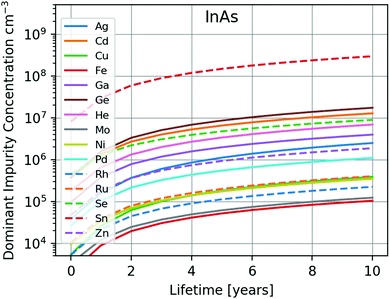 | ||
| Fig. 8 Impurity concentration (cm−3) for elements with concentrations in excess of >105 cm−3 for InAs as a function of lifetime in inclined nonpolar LEO. All major impurity concentrations show a similar temporal trend in all orbits considered in this analysis, as shown in the ESI.‡ | ||
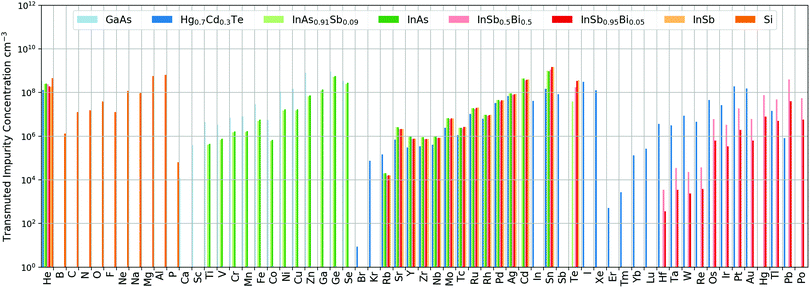 | ||
| Fig. 9 Impurity concentration (cm−3) (FISPACT) in GaAs, Hg0.7Cd0.3Te, InAs0.91Sb0.09, InAs, InSb0.5Bi0.5, InSb0.95Bi0.05, InSb and Si following 10 years of operation in inclined nonpolar LEO orbit. The temporal impurity development follows the same trend as visualized in Fig. 8. Orbit parameters are summarized in Table 2. | ||
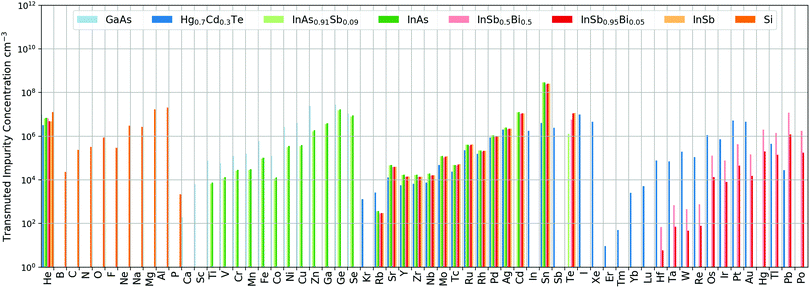 | ||
| Fig. 10 Impurity concentration (cm−3) (FISPACT) in GaAs, Hg0.7Cd0.3Te, InAs0.91Sb0.09, InAs, InSb0.5Bi0.5, InSb0.95Bi0.05, InSb and Si following 10 years of operation in polar sun-synchronous LEO orbit. The temporal impurity development follows the same trend as visualized in Fig. 8. Orbit parameters are summarized in Table 2. | ||
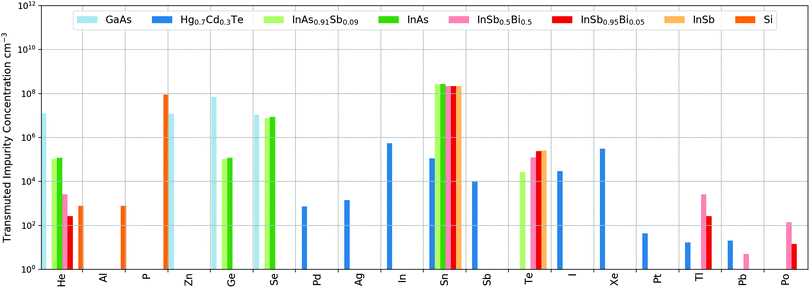 | ||
| Fig. 11 Impurity concentration (cm−3) (FISPACT) in GaAs, Hg0.7Cd0.3Te, InAs0.91Sb0.09, InAs, InSb0.5Bi0.5, InSb0.95Bi0.05, InSb and Si following 10 years of operation in MEO orbit. The temporal impurity development follows the same trend as visualized in Fig. 8. Orbit parameters are summarized in Table 2. | ||
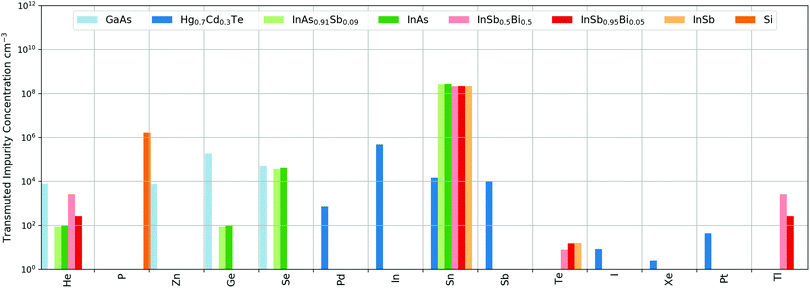 | ||
| Fig. 12 Impurity concentration (cm−3) (FISPACT) in GaAs, Hg0.7Cd0.3Te, InAs0.91Sb0.09, InAs, InSb0.5Bi0.5, InSb0.95Bi0.05, InSb and Si following 10 years of operation in GEO orbit. The temporal impurity development follows the same trend as visualized in Fig. 8. Orbit parameters are summarized in Table 2. | ||
All orbits are capable of producing >108 cm−3 concentrations of Sn by the 10 year point in all In-based semiconductors. As such, the higher energy of the LEO orbits (allowing access to more nuclear reactions as shown in Fig. 2) compensates for the lower fluence of these orbits, as shown in Table 2.
Overall, total concentrations of transmuted products at 10 years are found to be universally >105 cm−3, as shown in Table 1, with an overall semiconductor/orbit average of 7.59 × 108 cm−3. The minimum transmutation occurs in GaAs in GEO orbit. More generally, GEO orbit produces the least transmutation with an average concentration considering all semiconductors of 1.49 × 108 cm−3. This is a result of the low energy of the protons in this orbit, as shown in Fig. 3. The relatively high fluxes of this orbit cannot offset the lack of sufficient energy to induce proton nuclear reactions. The maximum transmutation occurs in InAs in polar sun-synchronous LEO and this orbit also produces the most transmutation overall with an average concentration of 2.49 × 109 cm−3. This is a consequence of the high energy proton spectrum of LEO orbits and its higher fluence than the inclined nonpolar LEO orbit. It should be noted that for all Indium-based semiconductors and for HgCdTe in GEO and MEO orbits, natural radioactive decay constitutes the dominant contribution to the impurity concentrations, as these orbits have insufficient fluence with sufficient energy to cause proton nuclear reactions, as can be observed by comparing Fig. 2 with Fig. 3. This explains the failure of scaling of impurity concentration with proton fluence (in the energy region of substantial cross-section) for these orbits, as shown in Table 1. This scaling is maintained for GaAs and Si because these semiconductors contain no naturally occuring radioisotopes.
With this in mind, it is possible to consider the worst possible irradiation scenario and to determine the minimum proton fluence required to achieve a significant impurity concentration of 1013 cm−3. It is not immediately obvious which proton spectrum will be capable of inducing the most transmutation. This is due to the fact that proton nuclear reactions are energy dependent, usually following the trend shown in Fig. 2, where the cross-section peak location of a (p, xn) reaction generally scales as 10x MeV with x being the number of neutrons emitted (as discussed further in Section 1). Furthermore, it is not enough that the cross-section be maximized as the unstable isotope produced in the reaction could beta decay back to its original form. This would imply that higher energy proton spectra are most capable of inducing long-lived transmutation, as they can accessing reactions which move the nucleus further from its previous stable proton to neutron ratio. Guided by the above analysis, input proton spectra of monoenergetic 10 MeV, 50 MeV, 100 MeV, and uniformly distributed from 10–50 MeV were considered for all semiconductors, with the resulting total impurity concentrations at one day given in Table 1 for rapid irradiation with a total fluence of 7.5 × 10¹¹ p+ per cm2. It is observed that there is no universally most damaging spectrum, but rather that the 100 MeV spectrum is most damaging for InAs0.91Sb0.09, InAs, InSb0.5Bi0.5, and InSb0.95Bi0.05; the uniform 10–50 MeV spectrum is most damaging for GaAs, Hg0.7Cd0.3Te, and InSb; and the 63 MeV spectrum is most damaging for Si. For the In-based semiconductors, the Cd and Sn concentrations do not vary widely with proton energy, as these are associated with nuclear decays from the single (p, n) reactions with In and Sb, for which 10 MeV protons are sufficient. Despite this, the higher energy proton spectrum is most damaging for these materials because a wider array of transmuted products are produced due to the higher availability of nuclear states that the higher energy protons can access. All in all, the worse-case irradiation is found to be for GaAs in a uniform 10–50 MeV spectrum, for which an impurity concentration of 2.41 × 1010 cm−3 results from an incident fluence of 7.5 × 10¹¹ p+ per cm2 at one day. This implies that a fluence in excess of 3 × 10¹⁴ p+ per cm2 would be required for the concentration of impurities to reach non-negligible values.
For further context, the unshielded maximum 1 in 10![[thin space (1/6-em)]](https://www.rsc.org/images/entities/char_2009.gif) 000 year solar particle event total fluence with energy greater than 10 MeV is on the order of 1011 p+ per cm2.28 As such, it would take the occurrence of 3000 of these solar events to reach appreciable impurity introduction. On the other hand, for the maximum MEO trapped proton flux, given in Table 2, if the flux took the most damaging possible spectrum, it would only take 148 days for non-negligible transmutation to occur. Fortunately, this spectrum cuts off below 10 MeV, which is why the amount of total transmutation associated with this orbit is negligibly small, as shown in Table 1 and Fig. 11.
000 year solar particle event total fluence with energy greater than 10 MeV is on the order of 1011 p+ per cm2.28 As such, it would take the occurrence of 3000 of these solar events to reach appreciable impurity introduction. On the other hand, for the maximum MEO trapped proton flux, given in Table 2, if the flux took the most damaging possible spectrum, it would only take 148 days for non-negligible transmutation to occur. Fortunately, this spectrum cuts off below 10 MeV, which is why the amount of total transmutation associated with this orbit is negligibly small, as shown in Table 1 and Fig. 11.
These computations demonstrate that the typical neglect of proton nuclear-reaction-induced transmutation is valid for all semiconductors operating in all orbits and device testing scenarios considered here.
4 Conclusion
Traditionally, electronic device radiation damage is characterized into that caused by ionization and that caused by displacement of lattice atoms. A third category, the contribution of which is investigated in this work through FISPACT-II calculations and GEANT4 simulations (as validated through experiment), is impurity production via proton nuclear reaction induced transmutation. Both monoenergetic proton spectra typical of device qualification testing and realistic spectra typical of satellite operating environments in orbit are considered. It is shown that total transmuted elemental concentrations never exceed concentrations of >1010 cm−3 in GaAs, Hg0.7Cd0.3Te, InAs0.91Sb0.09, InAs, InSb0.5Bi0.5, InSb0.95Bi0.05, InSb and Si at the end of 10 years of operation in any of the considered LEO, MEO, or GEO orbits. As such, for modern semiconductor devices, the effect can be safely ignored, but if this is not true for a particular application, this work presents a compilation of elemental impurities introduced in this set of semiconductors operating in these orbits.Conflicts of interest
There are no conflicts to declare.Acknowledgements
We would like to thank Dr Michael Ames of the MIT Nuclear Reactor Lab for the use of his facilities and for assistance with gamma spectroscopy measurements. The present work has benefited from the financial support of the US Department of Defense SMART Fellowship and Space Vehicles Directorate, Air Force Research Lab.Notes and references
- C. Claeys and E. Simoen, Radiation effects in advanced semiconductor materials and devices, Springer Science & Business Media, 2013, vol. 57 Search PubMed.
- A. S. Kovtyukh, Space Sci. Rev., 2018, 214(8), 124 CrossRef.
- G. Was, Fundamentals of Radiation Materials Science: Metals and Alloys, 2007, pp. 1–827 Search PubMed.
- C. P. Morath, V. M. Cowan, L. A. Treider, G. D. Jenkins and J. E. Hubbs, IEEE Trans. Nucl. Sci., 2015, 62, 512–519 CAS.
- K. Krane, Introductory Nuclear Physics, Wiley, 1987 Search PubMed.
- N. Soppera, E. Dupont and M. Bossant, JANIS Book of neutron-induced cross-sections, 2012 Search PubMed.
- A. Koning and D. Rochman, Nucl. Data Sheets, 2012, 113, 2841–2934 CrossRef CAS.
- C. Morath, E. Garduno, G. Jenkins, E. Steenbergen and V. Cowan, Infrared Phys. Technol., 2019, 97, 448–455 CrossRef CAS.
- J.-C. Sublet, J. Eastwood, J. Morgan, M. Gilbert, M. Fleming and W. Arter, Nucl. Data Sheets, 2017, 139, 77–137 CrossRef CAS.
- S. Agostinelli, et al. , Nucl. Instrum. Methods Phys. Res., Sect. A, 2003, 506, 250–303 CrossRef CAS.
- J.-C. Sublet, The FISPACT-II User Manual, 2015 Search PubMed.
- A. Command and S. College, AU-18 Space Primer, Defense Technical Information Center, 2011 Search PubMed.
- SPace ENVironment Information System (SPENVIS), 2019.
- J. Logan, shortlab/SemiconductorTransmutation: 2019 III–V Semiconductor Transmutation Paper Data, 2019, DOI:10.5281/zenodo.2783302.
- D. Wright, GEANT4 Tutorial: Physics I: Physics Lists, 2018 Search PubMed.
- GEANT4 Collaboration, Geant4 Physics Reference Manual, 2017 Search PubMed.
- J. Jeyasugiththan and S. W. Peterson, Phys. Med. Biol., 2015, 60, 7617–7635 CrossRef CAS PubMed.
- J. Apostolakis, G. Folger, V. Grichine, A. Howard, V. Ivanchenko, M. Kosov, A. Ribon, V. Uzhinsky and D. H. Wright, 2008 IEEE Nuclear Science Symposium Conference Record, 2008.
- C. Z. Jarlskog and H. Paganetti, IEEE Trans. Nucl. Sci., 2008, 55, 1018–1025 CAS.
- C. Castaneda, Crocker Nuclear Laboratory (CNL) radiation effects measurement and test facility, IEEE Radiation Effects Data Workshop. NSREC 2001. Workshop Record. Held in conjunction with IEEE Nuclear and Space Radiation Effects Conference (Cat. No. 01TH8588), 2001, pp. 77–81.
- Canberra Industries, Genie-2000 Spectroscopy System Operations Manual, 1999 Search PubMed.
- Ametec Ortec, Gamma Vision Gamma-ray Spectrum Analysis and MCA Evaluation Software User's Manual, 2000 Search PubMed.
- W. R. Leo, Techniques for nuclear and particle physics experiments: a how-to approach, Springer, 1994 Search PubMed.
- W. Lei, J. Antoszewski and L. Faraone, Appl. Phys. Rev., 2015, 2, 041303 Search PubMed.
- E. Larkins, E. Hellman, D. Schlom, J. Harris, M. Kim and G. Stillman, J. Cryst. Growth, 1987, 81, 344–348 CrossRef CAS.
- E. C. Larkins, E. Hellman, D. G. Schlom, J. Harris, M. H. Kim and G. E. Stillman, Appl. Phys. Lett., 1986, 49, 391–393 CrossRef CAS.
- X. Xie, B. Li, Z. Zhang and D. Shen, AIP Adv., 2018, 8, 035115 CrossRef.
- P. Jiggens, M.-A. Chavy-Macdonald, G. Santin, A. Menicucci, H. Evans and A. Hilgers, J. Space Weather Space Clim., 2014, 4, A20 CrossRef.
Footnotes |
| † All data, scripts, and intermediate analysis files can be found on our GitHub repository for this manuscript https://github.com/jvl2xv/SemiconductorTransmutation. See DOI: http://10.5281/zenodo.2783302. |
| ‡ Electronic supplementary information (ESI) available. See DOI: 10.1039/c9tc02995h |
| This journal is © The Royal Society of Chemistry 2019 |

