 Open Access Article
Complete self-recovery of photoluminescence of photodegraded cesium lead bromide quantum dots†
Koji
Kidokoro
,
Yoshiki
Iso
 * and
Tetsuhiko
Isobe
 *
*
Department of Applied Chemistry, Faculty of Science and Technology, Keio University, 3-14-1 Hiyoshi, Kohoku-ku, Yokohama 223-8522, Japan. E-mail: iso@applc.keio.ac.jp; isobe@applc.keio.ac.jp
First published on 9th July 2019
Abstract
CsPbBr3 quantum dots were packed in a cell and irradiated at 468 nm. The sample color changed to black, attributed to the formation of surface defects by photoinduced desorption of surface ligands. The color and photoluminescence properties completely recovered during subsequent dark storage. This can be explained by readsorption of the surface ligands.
All-inorganic perovskite CsPbX3 (X = Cl, Br, I) nanocrystals have attracted great interest as fluorescent quantum dots (QDs) since Kovalenko and colleagues published their sensational report in 2015.1 Colloidal fluorescent CsPbX3 QDs have frequently been prepared via the hot injection method proposed by Kovalenko's group and modified by other researchers. The QDs have a direct transition type and exhibit highly efficient photoluminescence (PL) with a very narrow peak width. The most characteristic property of the QDs is facile control of their light absorption and PL wavelengths by adjusting their band gap through halide anion exchange.2 These excellent properties have attracted much attention, especially in applications for LEDs,3,4 wide-color gamut displays,1 photovoltaic devices,5 lasers,6,7 photodetectors,8 photocatalysts,9 and bioimaging;10 therefore, CsPbX3 QDs have been examined by many research groups.11–17 Furthermore, other cesium lead halides, e.g., CsPb2Br5,18 are also attractive in optoelectronic devices. In CsPbX3, green-emitting bromide QDs show a higher PL quantum yield (PLQY) and stability than the chloride and iodide QDs. Furthermore, the pure-green emission from CsPbBr3 QDs has a narrower peak width (∼20 nm) than that of ternary copper chalcogenide QDs and InP QDs, which have been developed as Cd-free visible-light-emitting phosphors.19–23
All-inorganic CsPbBr3 QDs have better stability than conventional organic–inorganic lead bromide perovskite QDs developed for solar devices; nevertheless, the ready degradation of these QDs under light irradiation is a significant problem preventing their practical use. The photostability of CsPbBr3 QDs has been improved by formation of a QD core/shell structure,24 passivating the QDs with a metal complex,25 and embedding the QDs into a matrix such as silica, aluminosilicate, or polymer resin,26–28 but complete suppression of photodegradation is still challenging. Furthermore, photodegradation is generally an irreversible phenomenon suffered by various nanophosphors; therefore, the recovery of degraded QDs is of significance. In this report, we discovered complete self-recovery of the PL properties of CsPbBr3 QDs degraded by excitation light. Stability is one of the most important problems of nanometer-sized fluorescent materials because they are significantly affected by their surroundings due to their large specific surface area, and to the best of our knowledge, such a drastic self-recovery phenomenon has not been previously observed. To investigate the interesting phenomena of CsPbBr3 QD photodegradation and subsequent self-recovery, we evaluated the changes in the crystal structure, morphology, ligand adsorption, UV-vis light absorption, and PL properties.
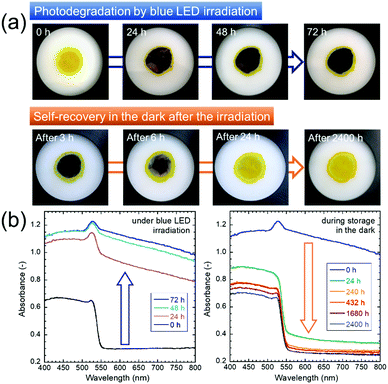
CsPbBr3 perovskite QDs capped with oleate anions and oleylammonium cations, which are deprotonated oleic acid and protonated oleylamine, respectively, were prepared by the hot injection method. The resulting QD sample, which was yellow in color and showed green PL emission, was placed in a powder cell and irradiated by a 468 nm blue, flat LED panel for 72 h (Fig. S1, ESI†). Details of these experimental methods and conditions are described in the ESI.†Fig. 1a shows the change in the body color of the QDs during the blue LED irradiation period and subsequent storage in the dark. The sample color changed from yellow to black during irradiation. According to the thermal images (Fig. S2, ESI†), the thermal damage to the sample was negligible. Therefore, the degradation of the QDs can be attributed only to photodegradation. The photodegraded sample exhibited gradual recovery without any treatment during storage in the dark at room temperature. The as-prepared QDs exhibited UV-vis light absorption at ∼550 nm and shorter wavelengths (Fig. 1b), which can be attributed to the inter-band transition of the CsPbBr3 QDs, while no absorption was observed in the longer wavelength region, resulting in the yellow color. The band gap of the as-prepared QD sample was estimated to be 2.27 eV from the Tauc plot, which was created from the UV-vis spectrum (Fig. S3, ESI†). The band gap was larger than the calculated 2.00 eV of bulk cubic CsPbBr3,1 revealing the quantum size effect. During continuous blue-light irradiation for 72 h, the absorbance increased over the whole region, which was consistent with the black color. A small peak at ∼530 nm, which can be assigned to the exciton peak of the QDs, remained after photodegradation. However, the absorbance enhancement in the region above ∼550 nm was not associated with the intrinsic properties of the CsPbBr3 QDs. Gradual recovery of UV-vis absorption spectra was observed during storage in the dark.
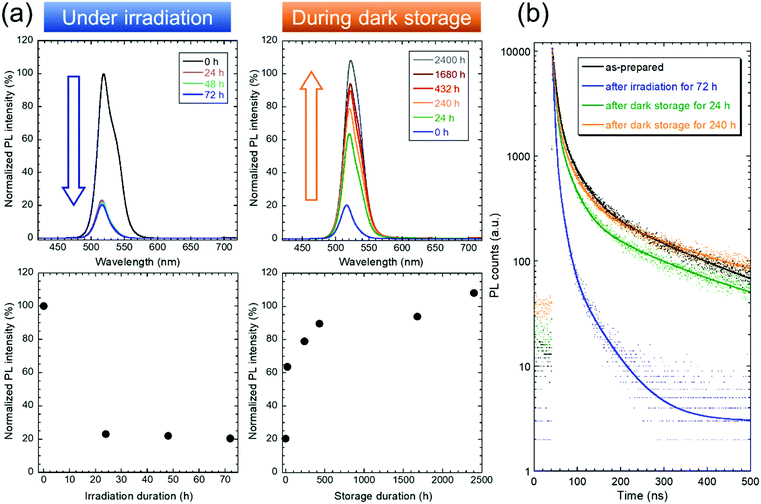
Drastic changes in the PL intensity were also observed. The PL spectrum of the QDs (Fig. 2a) had a sharp emission peak at ∼520 nm. Notably, a shoulder peak, which does not appear in the PL spectrum of the CsPbBr3 QD dispersion,29 was observed (see ESI†). The PL intensity decreased to ∼20% its initial value as the UV-vis absorbance increased upon blue LED irradiation. The remaining PL emission may come from undamaged QDs in deeper positions of the sample in the cell. Gradual recovery of the PL intensity after storage in the dark for 2400 h resulted in an intensity value that was 108% of the initial value. The PL lifetimes were also evaluated from the PL decay curves to investigate the influence of surface defects (Fig. 2b). A significant change was observed after the 72 h irradiation period, and the PL lifetime recovery during subsequent storage in the dark was confirmed. Detailed results for the PL lifetimes and amplitudes calculated from the curves are summarized in Table S1, ESI.† The initial average PL lifetime (103.9 ns) decreased to 13.2 ns after irradiation for 72 h, followed by an increase to 105.3 ns, which was close to the initial lifetime, after storage in the dark for 240 h. The decrease in the PL lifetime indicates the generation of surface defects that cause PL quenching through nonradiative transitions. These generated surface defects may be color centers, which explains the blackening of the QDs under irradiation. Therefore, the increase in the PL lifetime during storage in the dark reveals that the recovery of sample color from black to yellow may be caused by the disappearance of surface defects. This mechanism should explain the abovementioned changes in the UV-vis absorption and PL properties.
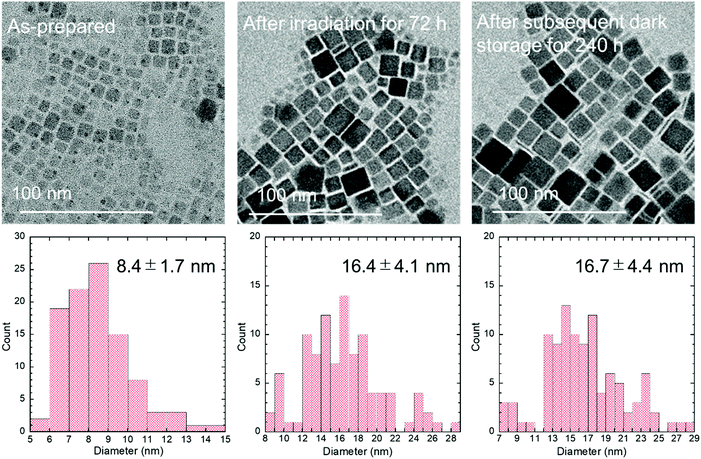
The as-prepared nanocrystals had an average size of 8.4 ± 1.7 nm that increased to 16.4 ± 4.1 nm after irradiation according to transmission electron microscopy (TEM) images (Fig. 3). Furthermore, the particles remained unchanged after storage in the dark. The growth of rectangular CsPbBr3 QDs is possibly due to exposed crystal surfaces combining after the removal of the surface ligands. This phenomenon of removal of the surface ligands is known as photoinduced desorption.30,31
 | ||
| Fig. 3 TEM images and corresponding size distributions of the QDs before and after blue LED irradiation for 72 h and after subsequent storage in the dark for 240 h. | ||
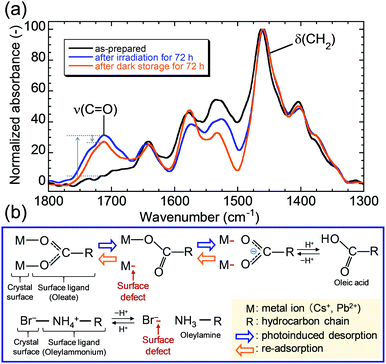
Photoinduced desorption of surface ligands during the crystal growth process resulted in the formation of defects on the QD surfaces, leading to the observed photodegradation. Additionally, the desorbed ligands might adsorb on the exposed surface, allowing self-recovery of PL during storage in the dark. The recovery of the PL intensity over 100% after self-recovery might be due to the optimized coordination states of the readsorbed surface ligands. To further understand the photodegradation and self-recovery processes, the origin of the generated defects was investigated. Fig. 4a shows the changes in the Fourier transform infrared (FT-IR) spectra of the QDs. A new peak assigned to ν(C![[double bond, length as m-dash]](https://www.rsc.org/images/entities/char_e001.gif) O) appeared at ∼1710 cm−1 after LED irradiation, indicating a change in the coordination state of the adsorbed oleate ligand, as illustrated in Fig. 4b. The oleate ligand desorbed by irradiation can be stabilized as oleic acid by receiving protons from nearby oleylammonium ligands. Simultaneously, the desorbed oleylammonium ligand is deprotonated by the oleate ion to form oleylamine. A gradual decrease in the peak of ν(C
O) appeared at ∼1710 cm−1 after LED irradiation, indicating a change in the coordination state of the adsorbed oleate ligand, as illustrated in Fig. 4b. The oleate ligand desorbed by irradiation can be stabilized as oleic acid by receiving protons from nearby oleylammonium ligands. Simultaneously, the desorbed oleylammonium ligand is deprotonated by the oleate ion to form oleylamine. A gradual decrease in the peak of ν(C![[double bond, length as m-dash]](https://www.rsc.org/images/entities/char_e001.gif) O) was observed during storage in the dark, and the decrease is possibly due to partial readsorption of the oleate ligand, which reverted from oleic acid. Oleylammonium might be readsorbed on the QDs at the same time. Unfortunately, we could not detect any NH vibrational peaks derived from the oleylammonium ligand by FT-IR analysis, which is possibly due to the small amount of the ligand on the QDs. The peak of ν(C
O) was observed during storage in the dark, and the decrease is possibly due to partial readsorption of the oleate ligand, which reverted from oleic acid. Oleylammonium might be readsorbed on the QDs at the same time. Unfortunately, we could not detect any NH vibrational peaks derived from the oleylammonium ligand by FT-IR analysis, which is possibly due to the small amount of the ligand on the QDs. The peak of ν(C![[double bond, length as m-dash]](https://www.rsc.org/images/entities/char_e001.gif) O) did not completely disappear because some of the desorbed ligands could not readsorb on the larger QDs, which had smaller specific surface areas than the as-prepared QDs before irradiation. We hypothesized that photodegradation was caused by the photoinduced desorption of organic ligands, which resulted in the generation of surface defects. The recovery might be due to the return of the coordination state accompanied by the disappearance of the dangling bond.
O) did not completely disappear because some of the desorbed ligands could not readsorb on the larger QDs, which had smaller specific surface areas than the as-prepared QDs before irradiation. We hypothesized that photodegradation was caused by the photoinduced desorption of organic ligands, which resulted in the generation of surface defects. The recovery might be due to the return of the coordination state accompanied by the disappearance of the dangling bond.
It should be noted that the outer edge of the sample remained yellow throughout the entire process, as shown in Fig. 1a. The annular yellow part might be degraded through an irreversible oxidation reaction with residual ambient air in the sample cell. When QDs were exposed to ambient air during the blue LED irradiation period, the sample color did not change to black (Fig. S4a, ESI†). Blackening of the sample was not observed, but the PL intensity decreased (Fig. S4b, ESI†). Furthermore, the absorption and PL properties did not recover during subsequent storage in the dark, possibly indicating that the QDs degraded through an irreversible oxidation reaction with damage by moisture under ambient air.32 The oxidized surface prevented the formation of a color center and could not return to its previous state; therefore, the observed blackening and self-recovery phenomena require an air-free environment. These studies on the drastic self-recovery behavior of CsPbBr3 QDs after significant photodegradation will help further develop their usability.
Conflicts of interest
There are no conflicts to declare.Acknowledgements
This work was partially supported by the Shorai Foundation for Science and Technology and the Hosokawa Powder Technology Foundation.Notes and references
- L. Protesescu, S. Yakunin, M. I. Bodnarchuk, F. Krieg, R. Caputo, C. H. Hendon, R. X. Yang, A. Walsh and M. V. Kovalenko, Nano Lett., 2015, 15, 3692–3696 CrossRef CAS PubMed.
- Q. A. Akkerman, V. D’Innocenzo, S. Accornero, A. Scarpellini, A. Petrozza, M. Prato and L. Manna, J. Am. Chem. Soc., 2015, 137, 10276–10281 CrossRef CAS PubMed.
- D. Yan, T. Shi, Z. Zang, T. Zhou, Z. Liu, Z. Zhang, J. Du, Y. Leng and X. Tan, Small, 2019, 15, 1901173 CrossRef PubMed.
- C. Li, Z. Zang, W. Chen, Z. Hu, X. Tang, W. Hu, K. Sun, X. Liu and W. Chen, Opt. Express, 2016, 24, 15071–15078 CrossRef CAS PubMed.
- A. Swarnkar, A. R. Marshall, E. M. Sanehira, B. D. Chernomordik, D. T. Moore, J. A. Christians, T. Chakrabarti and J. M. Luther, Science, 2016, 354, 92–95 CrossRef CAS PubMed.
- S. Yakunin, L. Protesescu, F. Krieg, M. I. Bodnarchuk, G. Nedelcu, M. Humer, G. de Luca, M. Fiebig, W. Heiss and M. V. Kovalenko, Nat. Commun., 2015, 6, 8056 CrossRef CAS PubMed.
- C. Li, Z. Zang, C. Han, Z. Hu, X. Tang, J. Du, Y. Leng and K. Sun, Nano Energy, 2017, 40, 195–202 CrossRef CAS.
- P. Ramasamy, D.-H. Lim, B. Kim, S.-H. Lee, M.-S. Lee and J.-S. Lee, Chem. Commun., 2016, 52, 2067–2070 RSC.
- Y.-F. Xu, M.-Z. Yang, B.-X. Chen, X.-D. Wang, H.-Y. Chen, D.-B. Kuang and C.-Y. Su, J. Am. Chem. Soc., 2017, 139, 5660–5663 CrossRef CAS PubMed.
- H. Zhang, X. Wang, Q. Liao, Z. Xu, H. Li, L. Zheng and H. Fu, Adv. Funct. Mater., 2017, 27, 1604382 CrossRef.
- M. V. Kovalenko, L. Protesescu and M. I. Bodnarchuk, Science, 2017, 358, 745–750 CrossRef CAS PubMed.
- H. Huang, L. Polavarapu, J. A. Sichert, A. S. Susha, A. S. Urban and A. L. Rogach, NPG Asia Mater., 2016, 8, e328 CrossRef CAS.
- S. Ananthakumar, J. R. Kumar and S. M. Babu, J. Photonics Energy, 2016, 6, 042001 CrossRef.
- X. He, Y. Qiu and S. Yang, Adv. Mater., 2017, 29, 1700775 CrossRef PubMed.
- X. Li, F. Cao, D. Yu, J. Chen, Z. Sun, Y. Shen, Y. Zhu, L. Wang, Y. Wei, Y. Wu and H. Zeng, Small, 2017, 13, 1603996 CrossRef PubMed.
- Y. Iso and T. Isobe, ECS J. Solid State Sci. Technol., 2017, 7, R3040–R3045 CrossRef.
- T. Chiba and J. Kido, J. Mater. Chem. C, 2018, 6, 11868–11877 RSC.
- C. Han, C. Li, Z. Zang, M. Wang, K. Sun, X. Tang and J. Du, Photonics Res., 2017, 5, 473–480 CrossRef CAS.
- C. Coughlan., M. Ibáñez, O. Dobrozhan, A. Singh, A. Cabot and K. M. Ryan, Chem. Rev., 2017, 117, 5865–6109 CrossRef CAS PubMed.
- C. Wada, Y. Iso, T. Isobe and H. Sasaki, RSC Adv., 2017, 7, 7936–7943 RSC.
- K. Kim., S. Jeong, J. Y. Woo and C.-S. Han, Nanotechnol., 2012, 23, 065602 CrossRef PubMed.
- T. Watanabe, C. Wada, Y. Iso, T. Isobe and H. Sasaki, ECS J. Solid State Sci. Technol., 2017, 6, R75–R80 CrossRef CAS.
- T. Watanabe, Y. Iso, T. Isobe and H. Sasaki, RSC Adv., 2018, 8, 25526–25533 RSC.
- B. Wang, C. Zhang, S. Huang, Z. Li, L. Kong, L. Jin, J. Wang, K. Wu and L. Li, ACS Appl. Mater. Interfaces, 2018, 10, 23303–23310 CrossRef CAS PubMed.
- H. Li, Y. Qian, X. Xing, J. Zhu, X. Huang, Q. Jing, W. Zhang, C. Zhang and Z. Lu, J. Phys. Chem. C, 2018, 122, 12994–13000 CrossRef CAS.
- H.-C. Wang, S.-Y. Lin, A.-C. Tang, B. P. Singh, H.-C. Tong, C.-Y. Chen, Y.-C. Lee, T.-L. Tsai and R.-S. Liu, Angew. Chem., Int. Ed., 2016, 55, 7924–7929 CrossRef CAS PubMed.
- Z. Li, L. Kong, S. Huang and L. Li, Angew. Chem., 2017, 129, 8246–8250 CrossRef.
- Y. Li, Y. Lv, Z. Guo, L. Dong, J. Zheng, C. Chai, N. Chen, Y. Lu and C. Chen, ACS Appl. Mater. Interfaces, 2018, 10, 15888–15894 CrossRef CAS PubMed.
- T. Kosugi, Y. Iso and T. Isobe, Chem. Lett., 2019, 48, 349–352 CrossRef CAS.
- S. Huang, Z. Li, B. Wang, N. Zhu, C. Zhang, L. Kong, Q. Zhang, A. Shan and L. Li, ACS Appl. Mater. Interfaces, 2017, 9, 7249–7258 CrossRef CAS PubMed.
- Y. Wang, X. Li, S. Sreejith, F. Cao, Z. Wang, M. C. Stuparu, H. Zeng and H. Sun, Adv. Mater., 2016, 28, 10637–10643 CrossRef CAS PubMed.
- S. Huang, Z. Li, B. Wang, N. Zhu, C. Zhang, L. Kong, Q. Zhang, A. Shan and L. Li, ACS Appl. Mater. Interfaces, 2017, 9, 7249–7258 CrossRef CAS PubMed.
Footnote |
| † Electronic supplementary information (ESI) available: Experimental details, supporting texts, Fig. S1–S7, and Tables S1 and S2. See DOI: 10.1039/c9tc02365h |
| This journal is © The Royal Society of Chemistry 2019 |


