 Open Access Article
Creative Commons Attribution 3.0 Unported Licence
Inkjet-printed polymer-based electrochromic and electrofluorochromic dual-mode displays†
Manuel
Pietsch
abc,
Tobias
Rödlmeier
ab,
Stefan
Schlisske
 ab,
Johannes
Zimmermann
ab,
Carlos
Romero-Nieto
ab,
Johannes
Zimmermann
ab,
Carlos
Romero-Nieto
 *cde and
Gerardo
Hernandez-Sosa
 *abc
*abc
aLight Technology Institute, Karlsruhe Institute of Technology, Engesserstr. 13, 76131 Karlsruhe, Germany. E-mail: gerardo.sosa@kit.edu
bInnovationLab, Speyererstr. 4, 69115 Heidelberg, Germany
cHEiKA – Heidelberg Karlsruhe Research Partnership, Heidelberg University, Karlsruhe Institute of Technology (KIT), Germany
dInstitute of Organic Chemistry, University Heidelberg, Im Neuenheimer Feld 270, 69129 Heidelberg, Germany. E-mail: carlos.romero.nieto@oci.uni-heidelberg.de
eFaculty of Pharmacy, University of Castilla-La Mancha, Calle Almansa 14 – Edif. Bioincubadora, 02008, Albacete, Spain
First published on 17th May 2019
Abstract
We report on inkjet-printed dual-mode devices based on the synchronous electrochromic and electrofluorochromic effect of the polyindenofluoren-8-tryarylamine polymer (PIF8-TAA). Reference devices show switching times under 4 s, a coloration efficiency of 542 ± 10 cm2 C−1 at 395 nm, an electrochromic contrast of 50 ± 4% in the visible spectra and a fluorescence contrast ratio of 4.1 ± 0.3. The material is highly transparent in its neutral state and changes to a deep red color by oxidation. Utilizing PEDOT:PSS as electrode material, inkjet printing enabled the fabrication of freely, digitally designed device layouts providing a cost-efficient method for low-level display applications. The results highlight the applicability of digitally printed dual-mode EFCD for signage or advertisements.
Introduction
Display technology is essential to almost every modern electronic device. Emissive mode displays, in which light emission is either actively controlled like in organic light-emitting diodes (OLED) or passively tuned like in liquid crystal displays (LCD), are commonly used in screens, smartphones, car dashboards, etc. These kind of displays exhibit high brightness and are able to produce a large color gamut.1–3 Unfortunately, they require a continuous power supply, are hard to read under direct sunlight, have a complex device architecture comprising multiple layers (e.g. OLED),2 or contain liquid-like components (e.g. LCD).3 These characteristics hinder their use in low-level applications, in which low-power requirements and costs-efficiency are needed. Alternatively, reflective displays like e-Papers based on electrophoresis are easily readable under direct illumination, only need power when the display is updated,4 and are also able to display bright colors.5 However, disadvantages of these devices are again the absence of an emissive light source so that the displays can be read in the dark.6 Dual-mode displays (DMD) can operate in both, emissive and reflective mode and are therefore an ideal solution for every light condition.Electrofluorochromic (EFC) materials exhibit the controllable switching of its fluorescence by a reversible, electrochemical redox process. This is in stark contrast with the electrochromic (EC) effect in which the optical properties, more precisely the attenuation coefficient and the corresponding color, are modulated. Interestingly, EFC materials, which show a simultaneous EC behavior, can be used to combine the advantages of emissive and reflective displays. This recently enabled the fabrication of dual-mode displays (DMD) based on electro(fluoro)chromic devices (EFCD).7–9 Their device architecture is simple compared to those of the current display technologies, they operate in a low voltage regime, consume low power10 and cover the full visible spectrum.11,12 Furthermore, EFCD have great potential to be used as sensors or optical memories.13–15
Herein, as part of the ongoing joint research in our laboratories on the development of new materials and device architectures for multicolor electrofluorochromic applications,16 we present the fabrication of an inkjet-printed DMD based on the EC and EFC polymer polyindenofluoren-8-tryarylamine (PIF8-TAA). The TAA moiety is electroactive17 and forms a stable radical ion if the para-position is occupied, which effectively quenches the fluorescence of the film.18 Additionally, PIF8-TAA has shown excellent chemical stability in air19 and has been applied as hole transport layer in perovskite solar cells,20,21 as well as p-type material in thin film transistors.19
The devices fabricated in this work showed a high transparency in their neutral state, which changed to a deep red color when the material was oxidized and demonstrated improvements in contrast or color variety in combination with other materials in the device. We realized an inkjet-printed dual-mode display with arbitrary shapes and individually addressable pixels. Inkjet printing enables high through-put production, the freedom of digital design, low-material waste due to drop-on-demand process, and up-scaling capabilities to industrial fabrication of organic electronic devices.22–26 Thus, this process shows great potential for smart window and low-level DMD display applications.
Experimental section
Materials
Tetrabutylammoniumhexafluorophosphate (TBAPF6, ≥99%), propylene carbonate (PC, 99%), poly(methyl methacrylate) (PMMA, MW: 15![[thin space (1/6-em)]](https://www.rsc.org/images/entities/char_2009.gif) 000), chlorobenzene (CB, anhydrous 98%) and 1,2,3,4-tetrahydronaphtaline (Tetralin, anhydrous 99%) were purchased from Sigma Aldrich. Polyindenofluorene-8-triarylamine (PIF8-TAA) was obtained from Merck KGaA. Poly(3,4-ethylenedioxythiophene)-poly(styrenesulfonate) (PEDOT:PSS, FHC Solar) was purchased from Heraeus. 3-Chlortoluene (CT, 98%) was obtained from VWR. The materials were used as received. The ITO coated glass substrates were purchased from Kintec Inc., the Borofloat 33 glass substrates from Schott AG.
000), chlorobenzene (CB, anhydrous 98%) and 1,2,3,4-tetrahydronaphtaline (Tetralin, anhydrous 99%) were purchased from Sigma Aldrich. Polyindenofluorene-8-triarylamine (PIF8-TAA) was obtained from Merck KGaA. Poly(3,4-ethylenedioxythiophene)-poly(styrenesulfonate) (PEDOT:PSS, FHC Solar) was purchased from Heraeus. 3-Chlortoluene (CT, 98%) was obtained from VWR. The materials were used as received. The ITO coated glass substrates were purchased from Kintec Inc., the Borofloat 33 glass substrates from Schott AG.
Fabrication of the polymer electrolyte gel (PEG)
TBAPF6 was dissolved in PC (72 g L−1) under stirring at 50 °C. PMMA was added to the solution to obtain a mass ratio of 30![[thin space (1/6-em)]](https://www.rsc.org/images/entities/char_2009.gif) :
:![[thin space (1/6-em)]](https://www.rsc.org/images/entities/char_2009.gif) 50
50![[thin space (1/6-em)]](https://www.rsc.org/images/entities/char_2009.gif) :
:![[thin space (1/6-em)]](https://www.rsc.org/images/entities/char_2009.gif) 3 (PMMA
3 (PMMA![[thin space (1/6-em)]](https://www.rsc.org/images/entities/char_2009.gif) :
:![[thin space (1/6-em)]](https://www.rsc.org/images/entities/char_2009.gif) PC
PC![[thin space (1/6-em)]](https://www.rsc.org/images/entities/char_2009.gif) :
:![[thin space (1/6-em)]](https://www.rsc.org/images/entities/char_2009.gif) TBAPF6). This polymer electrolyte solution was stirred for ten minutes at 50 °C and subsequently degassed for twenty minutes in vacuum using a vacuum oven (Vacutherm, ThermoFisher). The degassed solution was heated up to 90 °C to start the gelation process until a transparent gel has formed. The electrolyte gel was characterized by UV-vis transmittance measurements and impedance spectroscopy.
TBAPF6). This polymer electrolyte solution was stirred for ten minutes at 50 °C and subsequently degassed for twenty minutes in vacuum using a vacuum oven (Vacutherm, ThermoFisher). The degassed solution was heated up to 90 °C to start the gelation process until a transparent gel has formed. The electrolyte gel was characterized by UV-vis transmittance measurements and impedance spectroscopy.
Fabrication of the EFCDs
The ITO coated glass substrates were cleaned in acetone and isopropanol in an ultrasonic bath for ten minutes each. Afterwards, the substrates were treated for five minutes with O2 plasma (Tetra 30, Diener electronics). PIF8-TAA was dissolved in chlorobenzene with a concentration of 30 g L−1 and deposited on the ITO coated substrates by spin coating at 1500 rpm for 90 s with an initial acceleration of 1000 rpm s−1 to obtain the electrofluorochromic layer with a thickness of 130 ± 10 nm. The electrolyte gel was deposited on a second ITO substrate by drop casting. Both substrates were stacked face-to-face on top of each other. The drying electrolyte gel sealed the EFC-layer, which finalized the complete device. The EFCDs were characterized by fluorescence and UV-vis spectroscopy alongside with their corresponding I–V characteristics.Inkjet-printed devices
The bare glass substrates were pretreated as described above. The inkjet printing was performed in ambient cleanroom conditions with a Fujifilm Dimatix 2850 inkjet printing system. PEDOT:PSS was used for the electrodes as received and was printed with a Fujifilm Dimatix 10 pl cartridge with a print head temperature of 38 °C and a custom designed waveform. The substrate temperature was kept at room temperature. The pattern was printed with a drop spacing of 30 μm which led to a layer thickness of 90 ± 10 nm PIF8-TAA was dissolved in 3-CT (20 g L−1) and 5 vol% tetralin was added. The layers were printed with a Fujifilm Dimatix 10 pl cartridge, with a print head temperature of 40 °C and a custom designed waveform. The printed layers (30 μm drop spacing) had a thickness of 160 ± 10 nm. The rest of the device was fabricated as described above. The printed layers were additionally characterized by fluorescence microscopy.Methods
The impedance spectroscopy, the cyclic voltammetry and the measurements of the I–V characteristics were done with a PGSTAT128N (AutoLab). For the cyclic voltammetry PIF8-TAA was drop casted on a platinum electrode, which acted as working electrode and dried in vacuum. This electrode was placed in a 1 M TBAPF6/acetonitrile solution, together with a platinum counter electrode and a silver reference electrode separated by a semi-permeable membrane to hinder ion diffusion. For the UV-vis measurements an AvaSpec-ULS3648 (Avantes) and a light source with a range from 300 nm to 1100 nm was used. The fluorescence spectrometer was custom built for this work using a UV SMD-LED (NCSU275T, Nichia) with an excitation wavelength of 365 ± 5 nm, a collecting lens (ACL2520U, ThorLabs) and a long-pass filter (400 nm, FEL0400, ThorLabs). The fluorescence was measured with the LR-2 spectrometer (LaserTack). The contact angle and surface tension of the ink was measured with a DSA100 (Krüss), while the density measurement was done with an EasyDense (AntonPaar). The viscosity was measured with a HAAKE MARS rheometer of ThermoFisher.Results and discussion
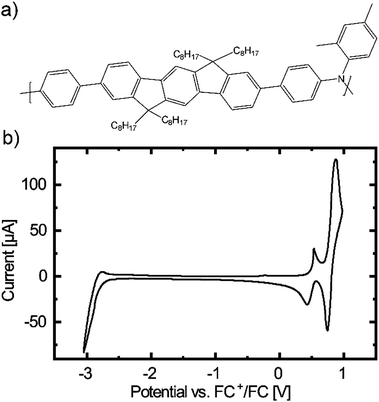
To investigate the applicability of PIF8-TAA (see Fig. 1a) as potential material for EFC applications, we first performed cyclic voltammetry measurements. The corresponding voltammogram indicates the presence of two energetically close, quasi reversible oxidation peaks (see Fig. 1b). This motivated us to fabricate EFC devices (EFCD) based on PIF8-TAA in a sandwich architecture between two ITO glasses, using a PMMA and TBAPF6 based PEG as schematically presented in Fig. 2a. The electrolyte, which characterization is presented in Fig. S1 of the ESI,† exhibited a transmittance of around 80% in the visible spectrum and an ionic conductivity of 4.6 ± 1.7 μS cm−1.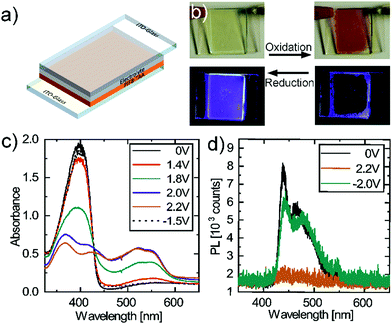 | ||
| Fig. 2 (a) Device architecture of the EFCD (b) pictures of the EFCDs with PIF8-TAA under operation (c) absorption spectra and (d) fluorescence spectra of PIF8-TAA in an EFCD. | ||
The EC and EFC properties of PIF8-TAA are shown in Fig. 2b–d. In its neutral state at 0 V (Fig. 2c) the polymer strongly absorbs in the UV region with a maximum at 395 nm and a full width half-maximum (FWHM) of 50 nm. Applying a positive voltage at the electrode with PIF8-TAA (working electrode) results in the oxidization of the polymer and leads to a decrease of the initial absorption peak. Simultaneously a new absorption peak with a maximum at 525 nm rises. The isosbestic point located at 430 ± 5 nm proves the conversion of PIF8-TAA to its radical-ion form. The new absorption band at 525 nm reaches its maximum at a voltage of 2.2 V applied to the working electrode. In other words, the PIF8-TAA shows an EC response; i.e. the device switches its color from transparent in the visible region, 75% at 520 nm, towards the red (Fig. 2b). According to the CIE 1931 system, the color coordinates change from (CIE x = 0.33, y = 0.35) to (CIE x = 0.45, y = 0.34). Applying a voltage of −1.5 V at the electrode with PIF8-TAA causes a reduction of the previously oxidized polymer and restores the initial absorption peak at 395 nm, demonstrating the reversibility of the color change.
The device shows an electrochromic contrast of 24 ± 2% and a contrast ratio (CR) of 25.6 ± 2.4 at the maximum absorption peak at 395 nm. Its coloration efficiency (CE) has a value of 542 ± 10 cm2 C−1 comparable to other polymers known in literature containing triphenylamino moieties.27,28 The values in the visible region are more relevant for display applications, rather than in the UV region. At 520 nm, the electrochromic contrast is even higher than in the UV with 50 ± 4%. However, the CR drops to 3.0 ± 0.2 as well as the CE to 191 ± 7 cm2 C−1. These values are still more than sufficient for display applications as exemplified in the photographs presented Fig. 2b, in which the switching between oxidation and reduction state with its corresponding coloration and photoluminescence is observed.
The photoluminescence spectra of the EFCD (Fig. 2d) shows that, in its neutral state, the PIF8-TAA presents a maximum fluorescence peak at 440 nm with a FWHM of 9 nm and a second peak at 465 nm with a FWHM of 19 nm. Analogously to the absorption, applying a voltage of 2.2 V at the working electrode quenches the fluorescence due to an energy transfer between the fluorophore moiety and the redox active moiety of the polymer. This energy transfer occurs most likely because of the overlapping of the fluorescence and absorption in the oxidized state.13 By switching the voltage to −1.5 V, the fluorescence can be restored as the polymer is again transformed into its neutral form. Therefore, the device can be switched between an on-state with a bright blue PL and an off-state, which presents no visible PL (see Fig. 2d). By exciting the devices with an UV-LED (0.46 μW cm−2), a maximum fluorescence contrast ratio of 4.1 ± 0.3 was determined. The devices show response times under 3 s for the reduction and under 4 s for the oxidation. These values were calculated taking into consideration the time at which the absorbance reached 90% of its maximum (minimum) intensity.14 The corresponding absorbance measurements are shown in Fig. S2 of the ESI.†
The stability and reproducibility of the EFC devices were examined by applying a square wave potential to the device and recording the change in absorption (395 nm; 520 nm) and photoluminescence (440 nm) as depicted in Fig. 3. The devices were constantly illuminated with broad band spectrum for the electrochromic switching and an UV-LED (395 nm) for the electrofluorochromic switching. With a full cycling time of 40 s the devices were switched more than a hundred times. The device exhibited stable absorbance values for the neutral state of the polymer (395 nm) and a decrease of 0.5 in the absorption of oxidized state (520 nm), while the fluorescence intensity decreased less than 45%. Cycles of absorbance and electrochromic contrast over more than 600 cycles was measured in a second device at the same cycling conditions (see Fig. S3 in the ESI†). The device reaches 50% of the initial electrochromic contrast after 210 cycles and finally broke at around 430 repetitions. We assume that this is due to the degradation of the ITO electrode acting as charge-storage layer since we could restore the initial contrast by applying the same voltage for five minutes, which was reported by Shen et al.29 Another possible reason for the decreasing device performance over several cycles is the displacement current, when the devices are switched. In our devices, the displacement current with a capacitance of 8.73 μF and a rise time of the square wave potential of <500 ns, results in 35 A. This is not critical for single measurements however it could explain the degradation of the device performance over several switching cycles. In future work we will investigate the operational stability of the devices by the use of square, trapezoidal or sinusoidal waves with rising times on the order of the device switching times.
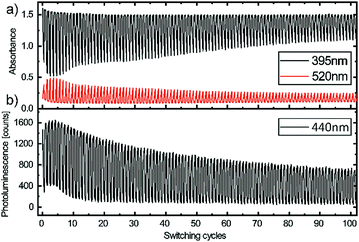 | ||
| Fig. 3 (a) Absorbance and (b) photoluminescence of the electro(fluoro)chromic device during 100 cycles with a switching period of 40 s. | ||
Furthermore, we built multilayer EFCDs by depositing P3HT or PEDOT on the second ITO coated glass slide (Fig. 4), to show that the optical characteristics of PIF8-TAA can complement well-known electrochromic materials such as P3HT30 or PEDOT.31 The absorbance of these two materials in their neutral and oxidized state is shown in Fig. S4 of the ESI.† P3HT absorbs in its neutral state in the same spectral region as PIF8-TAA in its oxidized state. In its oxidized form, the absorption band of the P3HT shifts to the near infrared (see Fig. S4a in the ESI†). Thus, we used this effect to design a device with improved contrast in the visible region. In its neutral state (0 V), the absorption peaks of PIF8-TAA in the UV and P3HT in the visible region are clearly visible (Fig. 4a). By applying a voltage of 2.8 V at the electrode with PIF8-TAA, the latter is oxidized and the absorption changes in agreement with Fig. 2. At the same time, the absorption of P3HT remains unchanged, which leads to an increase of the absorbance in the visible region. Changing the voltage to −2.8 V at the electrode with PIF8-TAA reduces the polymer back to its neutral state while P3HT oxidizes at the same time. The absorption peak of neutral P3HT decreases and a new broad band rises in the near infrared. As a result, the device can be switched between a transparent and a dark red state. Taking the absorption peak of the neutral P3HT as reference for a single layer device, the figure of merits nearly doubled their values. The electrochromic contrast at 520 nm increased from 21 ± 2% to 30 ± 2%, the CR from 3.2 ± 0.3 to 5.3 ± 0.3 and the coloration efficiency from 790 ± 10 cm2 C−1 to 1550 ± 70 cm2 C−1. The ability to modulate the fluorescence of the devices with multiple layers in comparison to the single layer device does not change. In addition, the CIE coordinates extend from (CIE x = 0.27, y = 0.32) in its transparent to (CIE x = 0.59, y = 0.25) in its deep red state in comparison to the device with only PIF8-TAA.
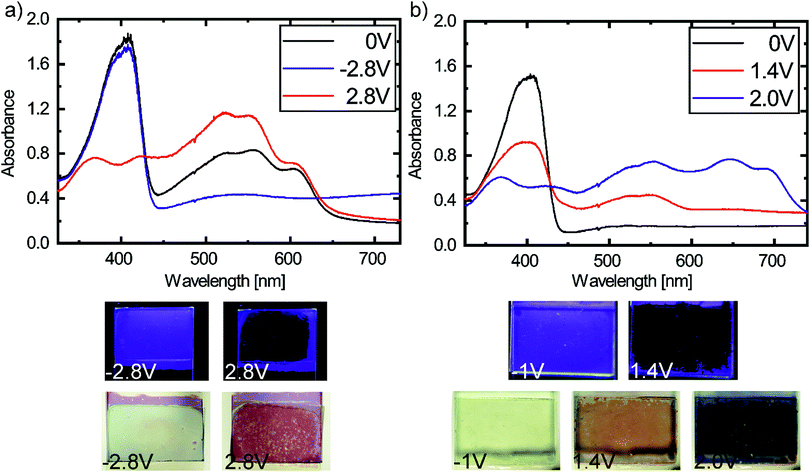 | ||
| Fig. 4 Electrochromic properties of the multilayer devices with (a) P3HT and (b) PEDOT with the related pictures of the actual devices under operation. | ||
In literature PEDOT is known as a cathodically coloring material, since it's reduced from its oxidized, transparent state to its neutral, blue colored state by applying a negative bias to its electrode.31 Thus, it can be used also as secondary electrochromic material to PIF8-TAA to switch between different colors. In its neutral state at 0 V (Fig. 4b), the absorption peak of PIF8-TAA is dominant in the UV and the absorption of PEDOT in its oxidized form is only slightly noticeable (Fig. S4, ESI†). Applying a voltage at the electrode with PIF8-TAA leads to a decrease of the original absorption band and an increase of the absorption in the visible region (Fig. 4b). A clearly visible red coloration is achieved by applying only 1.4 V. This is significantly lower (1.1 V) than for a single layer device with PIF8-TAA. This improvement is most likely due to the second electrochromic layer consisting of PEDOT, which has better charge storage properties than bare ITO.29 Further increasing the applied voltage reduces the PEDOT to its neutral state and the new absorption band of undoped PEDOT (ESI,† Fig. S4b) is added to the absorption of the oxidized PIF8-TAA. Therefore, the color changes to blue/purple (CIE x = 0.26, y = 0.25). The device can be reversibly switched to its transparent state by applying a voltage of −1 V to the electrode with PIF8-TAA. The electrochromic contrast at 645 nm is 49 ± 3%, the CR 3.8 ± 0.4 and the CE 437 ± 12 cm2 C−1. A comparison of all figures of merits of the different devices is shown in Table 1, whereas the corresponding transition of the CIE coordinates of all multilayer devices and the single layer device are shown in Fig. S5 (ESI†).
| Contrast [%] | CR | CE [cm2 C−1] | CIE (x/y) initial | CIE (x/y) final | |
|---|---|---|---|---|---|
| PIF8-TAA | 24 | 25.6 | 542 | 0.33/0.35 | 0.45/0.34 |
| PIF8-TAA/P3HT | 30 | 5.3 | 1550 | 0.27/0.32 | 0.59/0.25 |
| PIF8-TAA/PEDOT | 49 | 3.8 | 437 | 0.32/0.35 | 0.26/0.27 |
To demonstrate the applicability of printing technologies for the fabrication of EFC devices, we developed a PIF8-TAA-based ink formulation, which yielded smooth and homogenous layers using inkjet printing. The best results were achieved with a concentration of 20 g L−1 in 3-chlorotoluene with 5 vol% of tetralin. The ink showed a static contact angle of 13.1 ± 0.8° on ITO and 12.0 ± 0.8° on PEDOT, which indicates a good wetting of the underlying substrates (Fig. 5a). It also exhibited a density of 1.064 ± 0.002 g cm−3 (AntonPaar, EasyDense) and a viscosity of 5.14 ± 0.05 mPa s (Haake MARS) at a shear rate of 1000 s−1 as well as a surface tension of 32.6 ± 2.8 mN m−1 measured by pendant drop method. These values yield a Reynolds number of 21.73 and a Weber number of 17.13 at a droplet velocity of 5 m s−1 which indicate the ink can be successfully printed according to the print head manufacturer and the theoretical limit proposed by B. Derby32 (ESI,† Fig. S6). A micrograph of a printed film using this ink formulation can be seen in Fig. 5b. The printed square has a size of 25 mm2 and a layer thickness of 160 ± 10 nm. The square showed a small thickness gradient in the printing direction, due to the drying of the successive printed lines; It nevertheless formed a uniform square once the printing was finished. With this ink formulation, we were able to digitally structure PIF8-TAA layers for electrofluorochromic devices. As an example, we printed a decoration element for windows in a house model under day and night conditions (Fig. 5c and d). All devices reversibly switched between their transparent and their red state in the reflective mode as well as between their blue fluorescence state (λex = 375 ± 5 nm) and their dark state in the emissive mode. Therefore, these binary material systems are highly applicable as dual-mode devices for signage and advertisement. Further examples of signage design showing the printed logos of our institutions are depicted in the ESI.†
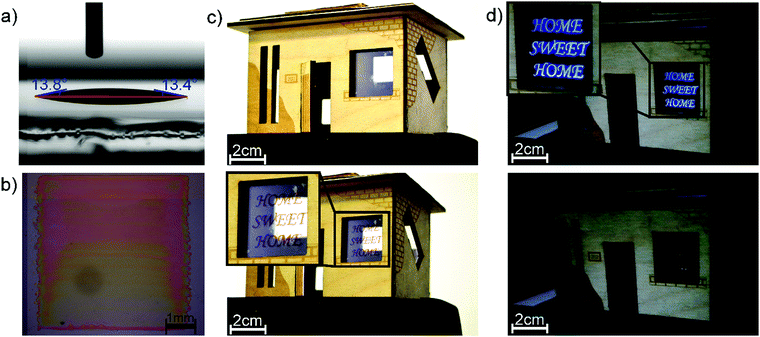 | ||
| Fig. 5 (a) Contact angle of the formulated ink on ITO. (b) Pritned 5 × 5 mm2 square. (c) and (d) Show one of the possible application of the devices in windows for design or advertisement. | ||
Finally, we fabricated devices with digitally structured electrodes and individually addressable pixels. This was achieved by printing PEDOT electrodes on top of a glass substrate and utilizing it as a working electrode. The use of PEDOT as electrode in electrochromic devices has been reported in literature.33 The device depicted in Fig. 6 shows that every pixel with a size of 5 mm × 5 mm can be independently addressed and reversibly switched.
It is important to highlight the versatility of this printing technique since it enables any type of design by means of individually addressable pixels. To the best of our knowledge, this is the first demonstration of an inkjet-printed EFC display successfully showing dual-mode operation.
Conclusions
We successfully fabricated high-performance EFC devices and inkjet-printed DMDs demonstrating the potential of PIF8-TAA as a promising material for display applications. The devices showed a high coloration efficiency of 542 ± 10 cm2 C−1, rapid response times under 4 s and great contrast ratios of 25.6 ± 2.4. Furthermore, the optical properties of PIF8-TAA are suited to build multilayer EFC devices in combination with well-known materials to increase either the optical contrast in the visible region or the color gamut. To the best of our knowledge, we demonstrated the first inkjet-printed electrofluorochromic device, which can be operated in a reflective or passive-emissive mode. These results highlight the applicability of digitally printed dual-mode EFCD for signage or advertisement. Furthermore, due to its optical transparency, PIF8-TAA and derivates are shown to be very promising for its utilization in smart windows for building integration and automotive applications.Conflicts of interest
There are no conflicts to declare.Acknowledgements
This project was partially supported by the Heidelberg Karlsruhe Research Partnership (HEiKA), a co-operation between the Ruprecht-Karls-University of Heidelberg and the Karlsruhe Institute of Technology and the German Ministry of Education and Research (BMBF), FKZ: 03X5526.Notes and references
- S. M. Lee, J. H. Kwon, S. Kwon and K. C. Choi, IEEE Trans. Electron Devices, 2017, 64, 1922–1931 CAS.
- V. C. Bender, T. B. Marchesan and J. M. Alonso, IEEE Ind. Electron. Magn., 2015, 9, 6–16 Search PubMed.
- D. H. Kim, Y. J. Lim, D. E. Kim, H. Ren, S. H. Ahn and S. H. Lee, J. Inf. Disp., 2014, 15, 99–106 CrossRef.
- M. R. Fernández, E. Z. Casanova and I. G. Alonso, Sustain., 2015, 7, 10854–10875 CrossRef.
- S. J. Telfer and M. D. McCreary, SID Symp. Dig. Tech. Pap., 2016, 47, 574–577 CrossRef.
- P. F. Bai, R. A. Hayes, M. Jin, L. Shui, Z. C. Yi, L. Wang, X. Zhang and G. Zhou, Prog. Electromagn. Res., 2014, 147, 95–116 CrossRef.
- K. Nakamura, K. Kanazawa and N. Kobayashi, Chem. Commun., 2011, 47, 10064 RSC.
- N. Sun, S. Meng, F. Feng, Z. Zhou, T. Han, D. Wang, X. Zhao and C. Chen, High Perform. Polym., 2017, 29, 1130–1138 CrossRef CAS.
- H.-J. Yen and G.-S. Liou, Chem. Commun., 2013, 49, 9797 RSC.
- Y. Kim, J. Do, E. Kim, G. Clavier, L. Galmiche and P. Audebert, J. Electroanal. Chem., 2009, 632, 201–205 CrossRef CAS.
- R. H. Bulloch, J. A. Kerszulis, A. L. Dyer and J. R. Reynolds, ACS Appl. Mater. Interfaces, 2015, 7, 1406–1412 CrossRef CAS PubMed.
- X. Wang, W. Li, W. Li, C. Gu, H. Zheng, Y. Wang, Y.-M. Zhang, M. Li and S. Xiao-An Zhang, Chem. Commun., 2017, 53, 11209–11212 RSC.
- P. Audebert and F. Miomandre, Chem. Sci., 2013, 4, 575–584 RSC.
- J. Jensen, M. Hösel, A. L. Dyer and F. C. Krebs, Adv. Funct. Mater., 2015, 25, 2073–2090 CrossRef CAS.
- D. Canevet, M. Sallé, G. Zhang, D. Zhang and D. Zhu, Chem. Commun., 2009, 2245–2269 RSC.
- P. Hindenberg, J. Zimmermann, G. Hernandez-Sosa and C. Romero-Nieto, Dalton Trans. 10.1039/C9DT00380K.
- A. Iwan and D. Sek, Prog. Polym. Sci., 2011, 36, 1277–1325 CrossRef CAS.
- C. Quinton, V. Alain-Rizzo, C. Dumas-Verdes, F. Miomandre, G. Clavier and P. Audebert, RSC Adv., 2014, 4, 34332–34342 RSC.
- W. Zhang, J. Smith, R. Hamilton, M. Heeney, J. Kirkpatrick, K. Song, S. E. Watkins, T. Anthopoulos and I. McCulloch, J. Am. Chem. Soc., 2009, 131, 10814–10815 CrossRef CAS PubMed.
- F. Zhang, S. Wang, X. Li and Y. Xiao, Curr. Nanosci., 2016, 12, 137–156 CrossRef CAS.
- S. Ryu, J. H. Noh, N. J. Jeon, Y. Chan Kim, W. S. Yang, J. Seo and S. Il Seok, Energy Environ. Sci., 2014, 7, 2614–2618 RSC.
- S. Khan, L. Lorenzelli and R. S. Dahiya, IEEE Sens. J., 2015, 15, 3164–3185 Search PubMed.
- M. Gao, L. Li and Y. Song, J. Mater. Chem. C, 2017, 5, 2971–2993 RSC.
- P. Andersson, R. Forchheimer, P. Tehrani and M. Berggren, Adv. Funct. Mater., 2007, 17, 3074–3082 CrossRef CAS.
- B. J. De Gans, P. C. Duineveld and U. S. Schubert, Adv. Mater., 2004, 16, 203–213 CrossRef CAS.
- P. Calvert, Chem. Mater., 2001, 13, 3299–3305 CrossRef CAS.
- Y. Wang, Y. Liang, J. Zhu, X. Bai, X. Jiang, Q. Zhang and H. Niu, RSC Adv., 2015, 5, 11071–11076 RSC.
- N. Sun, F. Feng, D. Wang, Z. Zhou, Y. Guan, G. Dang, H. Zhou, C. Chen and X. Zhao, RSC Adv., 2015, 5, 88181–88190 RSC.
- E. D. Shen, A. M. Österholm and J. R. Reynolds, J. Mater. Chem. C, 2015, 3, 9715–9725 RSC.
- Y. Kim, Y. Kim, S. Kim and E. Kim, ACS Nano, 2010, 4, 5277–5284 CrossRef CAS PubMed.
- T. H. Lin and K. C. Ho, Sol. Energy Mater. Sol. Cells, 2006, 90, 506–520 CrossRef CAS.
- B. Derby, Annu. Rev. Mater. Res., 2010, 40, 395–414 CrossRef CAS.
- A. A. Argun, A. Cirpan and J. R. Reynolds, Adv. Mater., 2003, 15, 1338–1341 CrossRef CAS.
Footnote |
| † Electronic supplementary information (ESI) available: Electrolyte characterization, lifetime measurement, CIE diagram. See DOI: 10.1039/c9tc01344j |
| This journal is © The Royal Society of Chemistry 2019 |

