
 Open Access Article
 This Open Access Article is licensed under a Creative Commons Attribution-Non Commercial 3.0 Unported Licence
Reversible switching of the Au(111) work function by near infrared irradiation with a bistable SAM based on a radical donor–acceptor dyad†
Valentin
Diez-Cabanes
ab,
Andrés
Gómez
 b,
Manuel
Souto‡
bc,
Nerea
González-Pato
b,
Jérôme
Cornil
*a,
Jaume
Veciana
*bc and
Imma
Ratera
*bc
b,
Manuel
Souto‡
bc,
Nerea
González-Pato
b,
Jérôme
Cornil
*a,
Jaume
Veciana
*bc and
Imma
Ratera
*bc
aLaboratory for Chemistry of Novel Materials, Université de Mons, Place du Parc 20, 7000 Mons, Belgium. E-mail: Jerome.CORNIL@umons.ac.be
bInstitut de Ciència de Materials de Barcelona (ICMAB-CSIC)/CIBER-BBN, Campus Universitari de UAB, 08193 Cerdanyola del Vallès (Barcelona), Spain. E-mail: vecianaj@icmab.es; iratera@icmab.es
cCIBER de Bioingeniería, Biomateriales y Nanomedicina (CIBER-BBN), 08193 Cerdanyola del Vallès (Barcelona), Spain
First published on 14th May 2019
Abstract
We describe the modification of the work function (WF) of Au(111) upon deposition of self-assembled monolayers (SAMs) with two donor–acceptor (D–A) systems, one based on a ferrocene-polychlorotriphenylmethyl radical (Fc–PTM) dyad and another on its non-radical dyad analogue. Kelvin Probe Force Microscopy (KPFM) has been used to measure the changes in the Contact Potential Difference (CPD) between the tip and the SAM under application of a cycling sweep of direct current (DC) voltage bias. These measurements showed that both SAMs exhibit a hysteretic behaviour in their WF changes. Interestingly, the hysteresis loop of the radical SAM is notably reduced when irradiated with NIR light, which we attribute to the bistable nature of this SAM in which neutral radical dyad molecules are excited into a zwitterionic state following a light driven intramolecular charge transfer (ICT) from the Fc unit to the PTM radical unit. Consequently, under NIR irradiation the WF hysteresis is almost quenched and the WF value of the functionalized gold surface is significantly shifted by +250 mV recovering their original values when the irradiation is suppressed. Remarkable is the large WF shift attained, one of the highest values reported in the literature, and the unprecedented fact that it is achieved under irradiation in the IR region due to an intramolecular electronic reorganization. In contrast, the WF value and the WF hysteresis of the non-radical SAM does not change upon NIR irradiation since this SAM does not display bistability.
Introduction
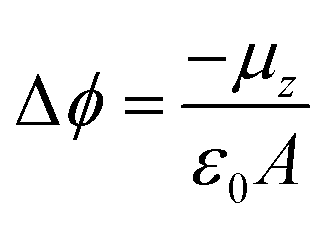
Self-Assembled Monolayers (SAMs) have attracted significant attention in the field of surface engineering during the last few years due to their capability of translating microscopic physico-chemical properties into macroscopic ones such as contact angle of a wetting solution on a surface or the modification of the surface work function (WF).1,2 In SAMs, the molecules are covalently attached to the surface forming highly ordered and packed 2D structures that allow for the formation of permanent dipoles at the interface which trigger the WF change. This property has been widely exploited in the field of organic electronics, particularly in the case of metallic/organic interfaces to modulate charge injection barriers in electronic devices such as Organic Field-Effect Transistors (OFETs).3,4The magnitude of this metal WF shift (Δϕ) can be quantified following the Helmholtz formula:
 | (1) |
One attractive feature for surface WF modifications by SAMs is to use switchable SAMs.7–9 Such monolayers are built with molecules that can be turned in two (or more) stable states by an external stimulus providing two (or more) commutable different WFs to the surface. In the case of photochromic switchable SAMs, the control over such states is driven by light, which can provide highly desirable switching properties such as a fast response and a high fatigue resistance.10 By using this kind of SAM, one can have an external control over the charge injection barriers in electronic devices by changing the state of the switch with light.11–13 The first switchable SAMs reported to tune the charge injection barriers were based on the cis and trans isomeric states of standard azobenzenes, which achieved a WF difference of about 100 meV as an averaged value, due to the large difference of nuclei positions in the two isomers that change their molecular dipoles.14 This difference was increased later on by fluorination of the top azobenzene ring, with values equal to 110 meV15 and 220 meV.16 Another relevant example consisted of diarylethene-based SAMs adsorbed on Au that provided a higher fatigue resistance but with lower WF differences upon photoisomerization (∼50 meV).17 In contrast, SAMs based on diarylethenes adsorbed on ZnO via a phosphonic acid displayed no changes in WF when going from the open to closed form, at both the experimental and theoretical levels.18 Finally, while spiropyran-based SAMs yielded theoretical WF differences equal to 230 meV,19 Ultraviolet Photoelectron Spectroscopy (UPS) measurements showed no changes in the WF upon photoisomerization for these SAMs which turn from a neutral (closed-SP) to a zwitterionic form (open-SP) because the molecular dipoles lie parallel to the metal surface instead of perpendicular to be relevant.20
Recently, we reported two SAMs,21,22S1 and S2, on Au(111) based on two donor–acceptor (D–A) dyads consisting on a ferrocene (Fc) unit acting as an electron donor (D), and either a PTM radical (where the central C atom of the PTM unit presents an unpaired electron) or a non-radical αHPTM unit (with the central C atom hydrogenated), as electron accepting (A) groups (see Fig. 1).23–28 The acceptor strengths of these two units are different because of their distinct electronic configurations, i.e., an open-shell for the radical and a closed-shell for the non-radical form. In both SAMs, one cyclopentadienyl ring of Fc is connected to the acceptor unit by a vinylene bridge while the other ring is connected by a carboxylate alkyl chain to a disulfide group (DS) acting as anchoring group for binding to Au(111) substrate (see Fig. 1). The reported values of Δϕ, as obtained by KPFM measurements using an in situ reference surface, were 50 meV and 22 meV for the non-radical S1 and radical S2 SAMs, respectively.22 We demonstrated that the radical form has a larger polarizability than the non-radical molecules, pointing to larger depolarization effects in the former case due to its higher charge-transfer character. This implies that the permanent dipole of a given molecule (μi) is modified to a stronger extent in S2 due the charge redistribution that takes places upon interacting with the electric field generated by the dipoles of the neighbouring molecules within the SAM, thus rationalizing the lower WF values of S2 with respect to S1. Interestingly, the radical S2 SAM could behave as a switchable SAM because the radical molecules can be optically excited from the neutral (D–A) ground state to an excited zwitterionic state (D+–A−) generated by an intramolecular charge transfer (ICT) from the Fc to PTM unit, leading to a change in WF (see Fig. 2). In contrast, this ICT cannot be promoted in the non-radical S1 SAM and for this reason it was used here for comparative purposes.
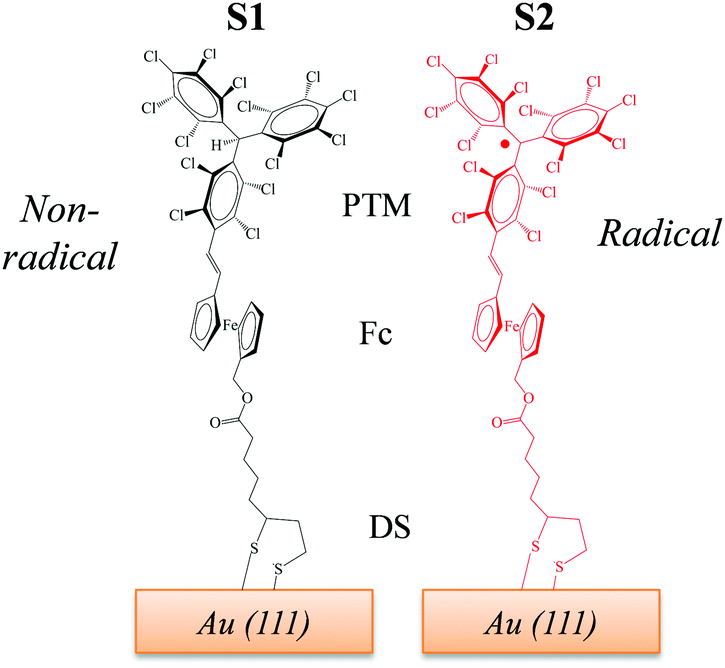 | ||
| Fig. 1 Chemical structures of the SAMs under study. S1 (left) contains molecules with the non-radical αHPTM unit, while S2 (right) incorporates molecules with the radical PTM unit. | ||
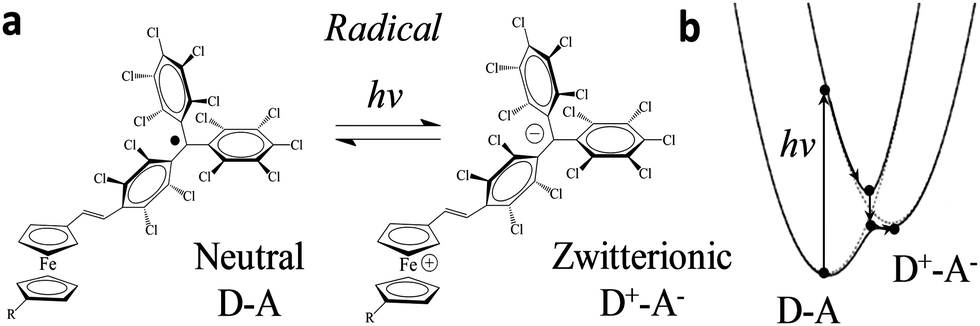 | ||
| Fig. 2 (a) Scheme of the neutral (D–A) and zwitterionic (D–A) species. (b) Their corresponding energy levels. Upon excitation, the energy level diagram of D–A and D+–A states shifts following the external stimulus, as adapted from ref. 24. | ||
ICT has been reported previously for D–A dyads, like those depicted in Fig. 2, both in solution24,27 and in crystals;25 the radical form of the Fc–PTM dyads exhibits an ICT band in the NIR region centred at 950 nm.21 The neutral D–A ground state is excited to a local excited state when it is irradiated at this wavelength and this process is followed by a fast charge transfer within a few picoseconds (ps), resulting in a charge separated zwitterionic state D+–A− (see Fig. 2 right). The energy difference between the D–A and D+–A− states is strongly dependent on the environment of the molecule (i.e., solution or crystalline state). In the case of solutions, this energy is reduced when increasing the polarity of the solvent, going from values of 0.64 eV to 0.23 eV for n-hexane and CH2Cl2, respectively.24 On the other hand, Fc–PTM crystals present small values of 0.014 eV, as obtained by fitting Mössbauer spectra at different temperatures.25 The decrease in the energy of the zwitterionic species is attributed to the influence of cooperative electrostatic intermolecular interactions in the crystal.
Herein, we report reversible changes of WF for the radical S2 SAM attached on Au(111) by means of external stimuli, such as irradiation with NIR light and temperature; as expected, this behaviour is not observed for the non-radical S1 SAM. The WF change was determined by KPFM by measuring the Contact Potential Difference (CPD) induced by the external perturbation. Both SAMs exhibit hysteresis with the KPFM applied bias due to the polarizability of the molecular D–A units and the intermolecular dipolar interactions. However, the hysteresis with radical S2 SAM is quenched when irradiated continuously with NIR light following the induced ICT process between the Fc and PTM units where an electronic redistribution occurs that changes the molecular dipole magnitudes. This irradiation produces a remarkable WF shift of +250 mV, which is reverted when the irradiation is suppressed. These changes are further supported by theoretical calculations confirming the experimental differences observed between the WF of the radical and non-radical SAMs.
Experimental
Synthesis and characterization of SAMs S1 and S2
Molecules 1 and 2 have been synthesized and characterized as described in ref. 21. S1 and S2 SAMs have been prepared following a previously reported procedure. SAMs were prepared by the immersion of Au/SiO2 substrates in 1 mM solution of the corresponding D–A compounds 1 and 2 in toluene under a nitrogen atmosphere and in the absence of light. The samples were maintained at 40 °C during the first hour and at room temperature for 24–48 h. The functionalized gold substrates were rinsed thoroughly with anhydrous toluene in order to remove any physisorbed material and finally were dried under a stream of dry nitrogen.Kelvin probe force microscopy (KPFM)
KPFM experiments were employed in the single-pass KFM, using the first resonance mode of the cantilever to feed the topography servo, while a second frequency, 20 kHz is used to chop and filter the signals trough a suitable lock-in amplifier. The AC signal is routed directly to a Pt/Ir probe from the nanosensor manufacturer, and with part number PPP-EFM. To find the contact potential difference, a suitable voltage bias (KFM bias) is routed to the sample directly. In order to compare the results from all the samples, the test was carried out with the exact same probe maintaining the following parameters constant: tip-sample distance, free first amplitude value, AC bias applied to the tip, frequency of the AC tip bias, DC voltage sweep rate, LIAs bandwidth and LIAs gain. All the measurements were carried out in low humidity conditions, as the AFM box is filled with compressed air to reduce the humidity below 8%, avoiding possible unwanted effects. The sample was illuminated with two 950 nm IR Light Emitting Diodes (LEDs), with part number SFH 4546, providing a total electrical power of 100 mW. The LEDs are positioned on top of the AFM head, with an angle of approximately 40° with respect to the sample, hence the illumination is flush. This angle is sufficient to warrant that the sample is illuminated, while, at the same time, the IR light does not interfere with the optical beam deflection system of the AFM. In order to corroborate our findings, the illumination was changed from top to bottom, exclusively for the measurements performed in Fig. 5e. For this set of measurements, a semi-transparent thin film gold layer (≈10 nm thickness) was used as the substrate, which is irradiated with the same type of LED (SFH 4546). In order to test the homogeneity of the sample, the curves of the surface potential have been recorded by averaging the curves obtained from 16 random points selected inside a 4 × 4 μm square. More details about the working principle of KPFM are given in Section S2 of the ESI.† The range of sweeping rates used to study the hysteresis behaviour of the surface potential with the KFM bias was 8 V s−1.Theoretical calculations
The geometry optimizations of the isolated molecules were carried out by Density Functional Theory (DFT) calculations, using the unrestricted (U)CAM-B3LYP exchange correlation functionals29 and a 6-31G(d) basis set,30 as implemented in the Gaussian09 package.31 This long-range correlated functional has been chosen due to problems of standard hybrid functionals to describe charge-transfer states.32,33 As it has been done in our previous paper,22 the orientation of the molecules in the gas phase has been set to match experimental data: heights for S1 and S2 of dS1 = 2.27 nm and dS2 = 2.23 nm from photoemission spectroscopy, respectively.21 The zwitterionic ground state (D+–A−) has been achieved by applying an electric field E = 0.3 V Å−1 to the optimized neutral (D–A) geometries in the direction of the Fc–PTM vector. Finally, Time Dependent Density Functional Theory (TD-DFT) calculations were performed to assess the properties in the zwitterionic excited state (D+–A−)′, using the same functional and basis set. Nevertheless, the polarizability αzz has been estimated in the zwitterionic ground state (D+–A−) by numerical differentiation of the perpendicular dipole moment with respect to an external electric field directed in the direction perpendicular to the surface.Regarding the SAM simulations at the MM/MD level, we have built a gold slab made of 3 gold layers and exposing the (111) surface by repeating a unit cell p(4 × 4) by periodic boundary conditions (PBC). The lattice parameters a = b = 11.45 Å and angle γ = 60° yield a surface coverage of A = 117 Å2, close to the experimental value obtained by X-ray Photoelectron Spectroscopy (XPS) equal to A = 111 Å2, while a vacuum region of 32 Å was set in the normal direction. In line with our previous studies,34 we have replicated the primitive cell 8 times in each lateral (a and b) direction, resulting in a super cell composed by 64 molecules (see Fig. S9, ESI†). More technical details about the MM/MD simulations are given in Section S4 of the ESI.†
Results and discussion
Work function measurements
For measuring the WFs of the metal coated with SAMs, we used a KPFM technique in which a combination of alternating current (AC) and direct current (DC) bias is applied simultaneously to the tip. In our case, the DC bias was swept in order to induce a charge redistribution in the SAMs, modifying the out-of-plane molecular dipole and hence the corresponding surface potential value. The range of electrostatic potential used as bias in our measurements (±5 V) was a compromise between avoiding damaging the sample surface due to dielectric breakdown, and modifying the internal dipoles. The averaged values of the surface potential were found at the minimum of the curve plotting the KFM amplitude vs. the applied bias and at the vertical transition of the curve showing KFM phase vs. the applied bias (for further details, see Section S2 in the ESI†). We applied a specific voltage profile to radical SAM S2 (see Fig. 3) sweeping from −5 V to +5 V (red curve, starting at point 1 and ending at point 4), and then from +5 V to −5 V (black curve, starting at point 5 and ending at point 8). Doing so, we observed a hysteresis of the contact potential difference values that can be explained as follows. The measured value of the surface potential corresponding to the original dipole μ0 is Δϕ0. Applying a high negative bias −5 V (creating an electric field pointing to the sample) to the original negative dipole μ0 (pointing from Fc to PTM) is enough to strengthen it towards a certain value μ−, which is reflected in the new WF value, Δϕ−, obtained. If a high positive bias (+5 V) is applied, the same dipole diminishes down to a value μ+, reflected by a change in WF towards a Δϕ+ value, where μ+ < μ0 < μ−. The hysteresis observed in the KPFM curves indicates that the molecules remain trapped in a metastable state while the voltage is swept, probably due to the presence of lateral intermolecular dipole interactions. This effect is more pronounced when using fast sweeping rates (or short time of bias cycle, see Fig. S2, ESI†). Following these considerations, starting with −5 V (point 1, dipole μ−) in the first part of the cycle from −V to +V (points 1–4), the KFM amplitude decreases till it reaches a first minimum (points 2 and 3) with a surface potential corresponding to a dipole μ′ with a value Δϕ0 < Δϕ′ < Δϕ− due to the trapping process. Afterwards, the value of the KFM amplitude increases until the applied bias reaches +5 V (point 4 and 5, dipole μ+). At this moment, we start the second part of the cycle with a bias evolving in the opposite direction from +V to −V (points 5–8). As in the first round, the KFM amplitude decreases until it reaches a second minimum with a surface potential corresponding to a dipole μ′′ and a value Δϕ′′, with Δϕ+ < Δϕ′′ < Δϕ0. Finally, the KFM amplitude recovers the starting point achieved with a bias equal to −V (points 1 and 8).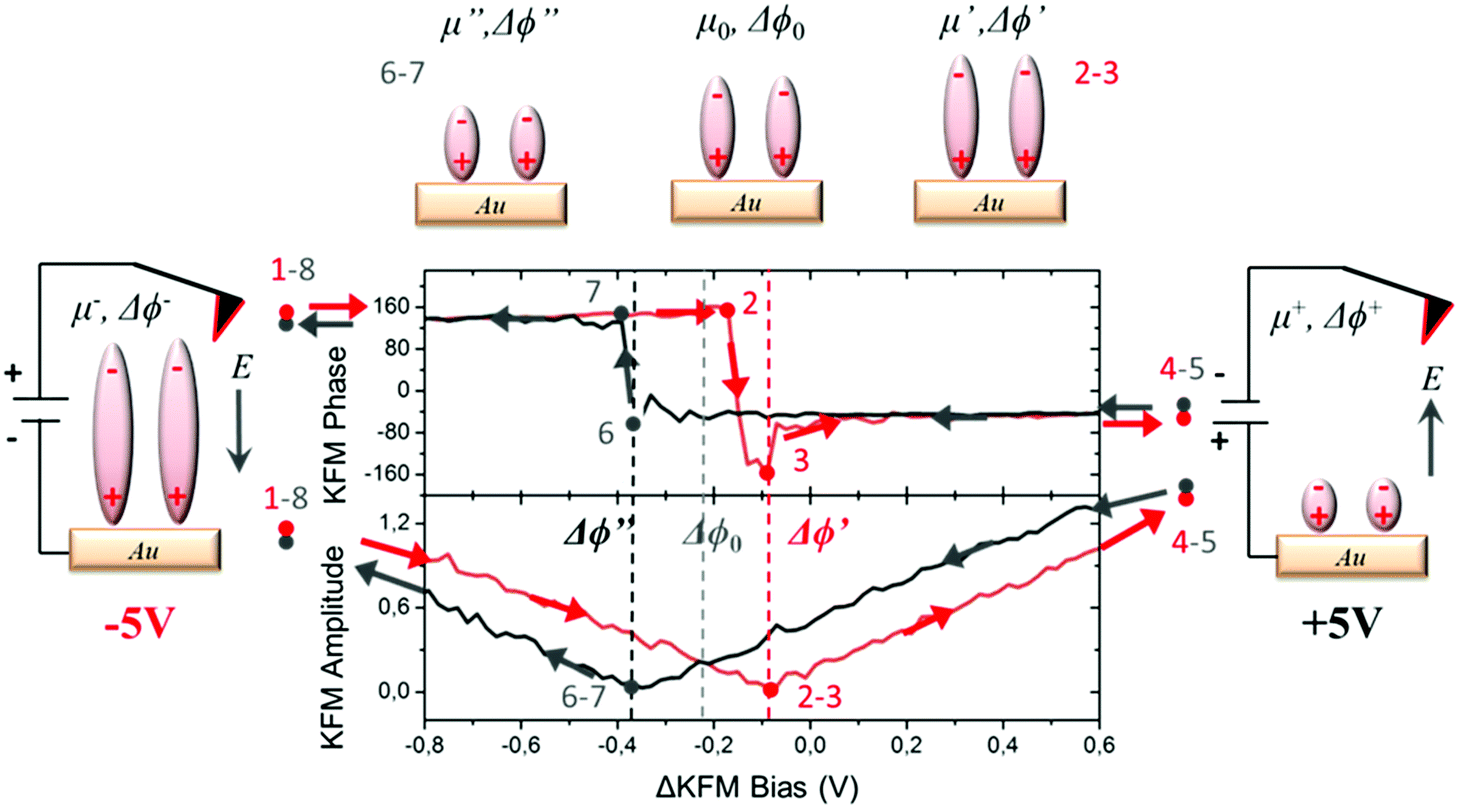 | ||
| Fig. 3 Hysteresis cycle obtained for the radical S2 SAM in the dark at r.t. with KPFM. The arrows in the image represent the direction of the bias cycle during the different steps. The upper panel shows the KFM phase dependence on the applied bias while the bottom panel depicts the KFM amplitude dependence on the applied bias. Note that the shape of the KFM phase vs. bias hysteresis curve depends on the polarity of the starting bias. It is important to stress that for a better visualization of the two minima, only the bias window between −0.8 and 0.6 V is shown in the graph, while the full bias cycle takes place from −5 V to 5 V. | ||
This hysteresis process can be easily seen in the plot of the KPFM phase vs. applied bias, which can be quantified as the distance between the two vertical transitions Δϕhys = Δϕ′′ − Δϕ′.
This magnitude increases when using short bias cycle times (see Fig. S2, ESI†), in agreement with our initial considerations. KPFM measurements performed on the non-radical SAM S1 also show a hysteresis Δϕhys under an applied bias cycle (see Fig. 4a) in accordance with the polarizability of the molecules and the intermolecular interactions. Note that the absence of hysteresis with the neat Au substrate (see Fig. S3, ESI†) confirms that its origin is related to the surface dipoles produced by the deposition of the SAMs.
 | ||
| Fig. 4 (a) KPFM experiments obtained for both S1 and S2 samples with and without external stimuli. (a) KFM phase (Deg) vs. ΔKFM bias (V) hysteresis curves in the dark (left) and upon irradiation at 950 nm (right) for S1 (top) and S2 (bottom) SAMs. Five overlying bias cycles are shown in all cases. Each of the curves was acquired in a different spot of the sample and the averaged values and errors are given in the plots. (b) Energy diagram and scheme of the dipole hysteresis for a SAM with a neutral ground state (D–A) and an excited zwitterionic state (D+–A−). | ||
Impact of the IR light
In a first stage, we studied with KPFM the photoexcitation processes that take place upon irradiation by comparing the hysteresis of the non-radical S1 and radical S2 SAMs (see Fig. 4). We performed five sweeps, in different spots of the sample and report the averaged values with statistical error bars. The hysteresis of SAM S1 is not affected by irradiation at 950 nm since the non-radical molecule does not absorb in the NIR region. On the other hand, the hysteresis in SAM S2 is strongly attenuated when these SAMs are irradiated due to the fact that the radical molecules in S2 are excited into a zwitterionic state upon continuous irradiation. As stated before, this internal charge transfer takes place in a timescale of a few ps and a complete charge separation is not achieved between the covalently linked D and A units. We define ΔE as the energy difference between the neutral (D–A) and charge-separated (D+–A−) states. In a “two-state model” similar to that described for SAM S2, where the energy difference ΔE is constant and equal to ΔEc during the whole bias cycle, we would thus expect the dipole to fluctuate around the dipole μc with the bias cycles (from μc′ to μc′′ in Fig. 4) and the appearance of hysteresis in the KPFM plots. However, the energy difference ΔE is also expected to be modified by the application of a bias.25 A negative potential −V is going to increase this energy difference up to ΔE′, while a positive potential +V decreases it down to ΔE′′ (see Fig. 4b top). Accordingly, the application of a negative bias −V should reduce the charge separation due to the increase in the energy separation between the D–A and D+–A− states whereas a positive bias +V should increase this charge separation by diminishing the energy barrier for the ICT. These two phenomena are at the origin of the reduction of the hysteresis upon irradiation in SAM S2, as it can be observed in Fig. 4b. These results also confirm the presence of the zwitterionic species in the radical SAM S2 upon NIR irradiation.Another important characteristic of this system relies on the reversibility of the negative shift in the WF induced by the IR irradiation. In order to test such reversibility, we performed two different consecutive cycles, in which the IR illumination is cycled from off-to-on (Fig. 5e). In order to acquire the values of the WF, we sweep the ΔKFM bias from −2 V to +2 V while saving the KFM amplitude channel to obtain a similar curve as for the case of Fig. 5b. The minimum value is calculated from the curve and introduced as a single point in Fig. 5e, represented with a square-shaped point. Each of such curves is performed in randomized points of the sample surface. The exact same procedure is repeated, while the IR illumination is turned on and off. Our data shows that the WF is increased where the sample is illuminated, while it decreases in the darkness and that this effect is reversible. Despite the highly localized nature of KPFM measurements, the average value represented with horizontal lines in Fig. 5e clearly demonstrates the WF shift is due to IR irradiation. The value of the WF shift is equal to 250 meV (as measured from Fig. 5e) and it is slightly higher than the largest shift16 reported for photo switchable SAMs (∼220 meV). However, in our case, the WF shifts are associated with electronic reorganizations inside the molecules rather than to a structural isomerization, as in the latter case. The differences presented in each of the minimum points acquired for each curve are due to the randomized, for homogeneity reasons, and localized measurement conditions inherent to KPFM. Therefore, the results here reported represent a proof of concept that SAMs based on D–A dyads showing ICT can be used for obtaining SAMs with photo switchable work functions.
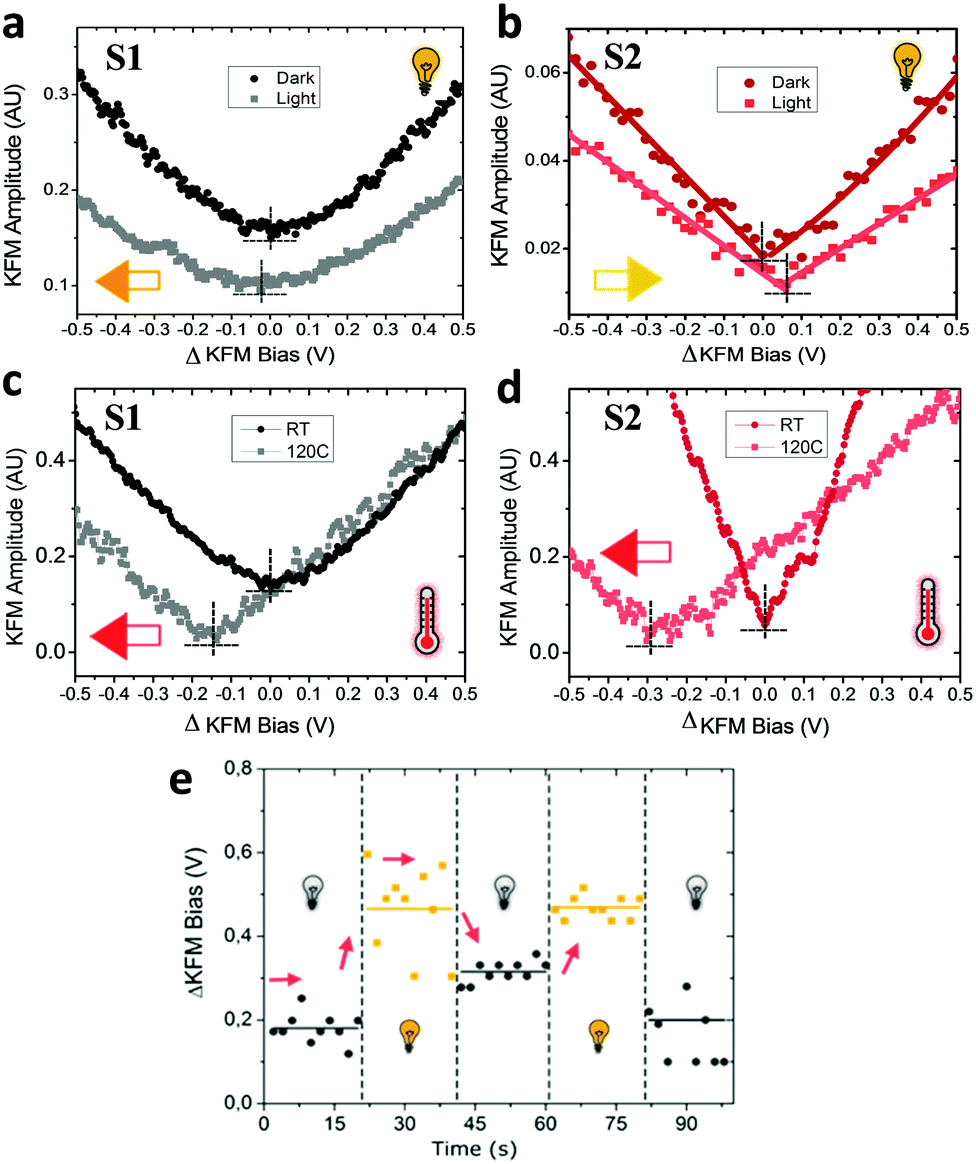 | ||
| Fig. 5 Surface potential as a function of 950 nm irradiation and temperature. (a and b) KFM amplitude vs. bias surface potential curves in the dark and under 950 nm irradiation; and (c) and (d) under RT and 120 °C heating for S1 (left) and S2 (right) SAMs. The curves display the averaged values obtained in both directions of the ΔKFM bias cycle. The arrows depict the direction of the shifts of the dipole surface achieved by the external stimulus. The dashed lines are plotted to help the visualization of the curve minima. (e) ΔKFM bias (V) vs. time (s) in which different cycles of measurements under NIR irradiation and in the dark are performed in S2 SAMs. Each of the measured points represents the minimum value obtained, as in (b), while horizontal lines represent the average value calculated from the acquired points. Note that the experiments made to obtain (a, b) and (c, d) are independent of each other: in the first case the changes in the surface potential are ascribed only to light irradiation, while in the latter case the changes in the surface potential are originated by the increase of temperature. | ||
Effect of the temperature
The irradiation at 950 nm on the S1 and S2 SAMs has an additional effect since the Au substrate absorbs part of the energy of the light increasing the temperature of the sample. The energy of this absorption is not translated into a change of the WF of neat Au, as experimentally checked (see Fig. S4, ESI†), but it induces some thermal motion of the molecules of the surface. Due to the thermodynamically unstable state of the permanent dipoles (lying mainly parallel to one another), on the Au surface produced upon the SAM formation,35 the thermal motion of the molecules should allow the molecules forming the SAM to change their geometry in order to reduce the amplitudes of these dipoles. In order to read this effect, we designed another experiment in which the KFM bias is applied from −2 V to +2 V in a single run, with a slow rate of 4 V s−1. The data acquisition comprises 10 subsequent measurements and their average is then calculated and plotted in Fig. 5a and b. The reduction of the dipole by thermal effects explains the negative shift (orange arrow in Fig. 5a) by −25 meV of the surface potential for S1 (see Fig. 5a). However, in the case of S2, the shift occurs in the opposite direction (yellow arrow in Fig. 5b) which cannot be explained by the thermal motion. In this case, the increase in the charge separation between the Fc–PTM units present in the zwitterionic state dominates and induces an increase of the negative dipole formed by the Fc–PTM dyad, resulting in a positive shift of +60 meV (as measured from Fig. 5b) in the surface potential. We further test the thermal motion influence on the surface potential shift for both S1 and S2 SAMs, by measuring the surface potential at room temperature and at 120 °C (see Fig. 5c and d) while no light irradiation was applied in this set of experiments. We see that both samples display the exact same direction in the potential shifts, with different magnitudes, thus confirming that thermal motion reduces the surface dipoles for both S1 and S2 SAMs. It is worth mentioning that this test discards possible unwanted effects coming from moisture or humidity dependent effects. By working in temperatures over 100 °C, we rule out the effect of moisture that could affect the data. Summing up the higher temperature and lower relative humidity (RH) ensures accurate and true data acquisition conditions.41 In order to clarify if humidity could explain part of the hysteretic behaviour found for zwitterionic species, we performed more experiments for a test sample in both high and low humidity conditions (see Fig. S5 in the ESI†). Our data support the idea that hysteresis is not related to a humidity related effect, demonstrating that the polarizability of the molecules is behind the hysteretic behaviour reported.Contrary to the effect of the light, there are no changes in the hysteresis in the temperature range of 25–120 °C for both SAMs (see Fig. S6, ESI†), demonstrating that the zwitterionic state is achieved exclusively as a consequence of the IR irradiation. As we observed before, the thermal motion produced by increasing the temperature is translated into a negative shift of the surface potential, which is clearly visible for both SAMs (see Fig. 5c and d). In our previous work,22 we demonstrated that the polarizability of radical molecules in SAM S2 is higher than in SAM S1, meaning that the surface dipole in S2 is more sensible to the changes in the surrounding charge density. Consequently, the negative shift induced by the thermal motion is higher in the case of the radical SAM S2 (∼285 meV) than in the non-radical SAM S1 (∼145 meV). This result is valid since both SAMs present the same packing as suggested experimentally.21 As for the case of IR irradiation, the original behaviour of the system is recovered when decreasing to room temperature (see Fig. S7, ESI†). After heating, the fact that hysteretic behaviour is still preserved confirms our expectations that such related phenomena take place as a consequence of the zwitterionic (D+–A−) species.
Theoretical calculations
The evolution of the surface potential with the NIR light in the radical S2 SAM has been further analysed by means of Time Dependent-Density Functional Theory (TD-DFT) calculations. To do so, we have used the same geometries of the isolated molecules as in our previous studies,22 as guided by experimental measurements (see Experimental section). In particular, we have calculated the normal dipole component in the isolated molecules (μz) for the neutral radical (D–A) and excited zwitterionic state (D+–A−)′, while the effect of changes in the charge density induced by the neighbouring molecules has been taken into account by the normal component of the molecular polarizability (αzz). Following previous studies, one can use the modified Helmholtz equation to relate the work-function modification to the chemical nature of the SAM: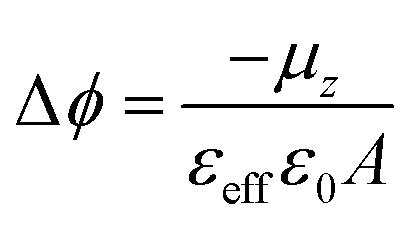 | (2) |
| εeff = 1 + αFA−1.5 | (3) |
| State | ||
|---|---|---|
| Calculated components | D–A | (D+–A−)′ |
| μ z (D) | −0.03 | −11.01 |
| α zz × 10−24 (cm3) | 103.92 | 75.65 |
| ε eff | 1.79 | 1.58 |
| Δϕ (eV) | 0.01 | 2.38 |
The results from DFT show a positive shift of the surface potential upon irradiation by about ∼+2 eV, which is one order of magnitude higher than the positive shifts observed experimentally (∼+150–250 meV, as obtained from Fig. 5e), thus showing that the complete charge transfer process is not achieved at an experimental level. Furthermore, the results obtained by using other long-range correlated hybrid functionals were similar (see Table S1, ESI†). As demonstrated previously,22 a large increase in the isolated molecular dipoles (∼11 D) in the zwitterionic species is not correlated with a large increase of the surface potential due to the large depolarization effects.38–40
In order to verify the effects of the thermal motion on the molecular dipoles, molecular mechanics coupled to molecular dynamics (MM/MD) simulations were performed (see Section S3 in the ESI† for more computational details). In particular, quenched simulations were performed at 25 and 120 °C. The individual normal dipoles in the molecules forming the SAMs were extracted to study their distribution along the trajectory (see Fig. 6 top). By applying the Helmholtz equation (eqn (1)) in a vacuum (ε = 1), one can obtain the WF shift distribution for both temperatures (see Fig. 6 bottom). In this case, the effective dielectric constant εeff was not calculated as in eqn (3) due to the impossibility of calculating the polarizability (αzz) for all geometries of the molecules forming the SAM in all snapshots of the MM/MD trajectory.
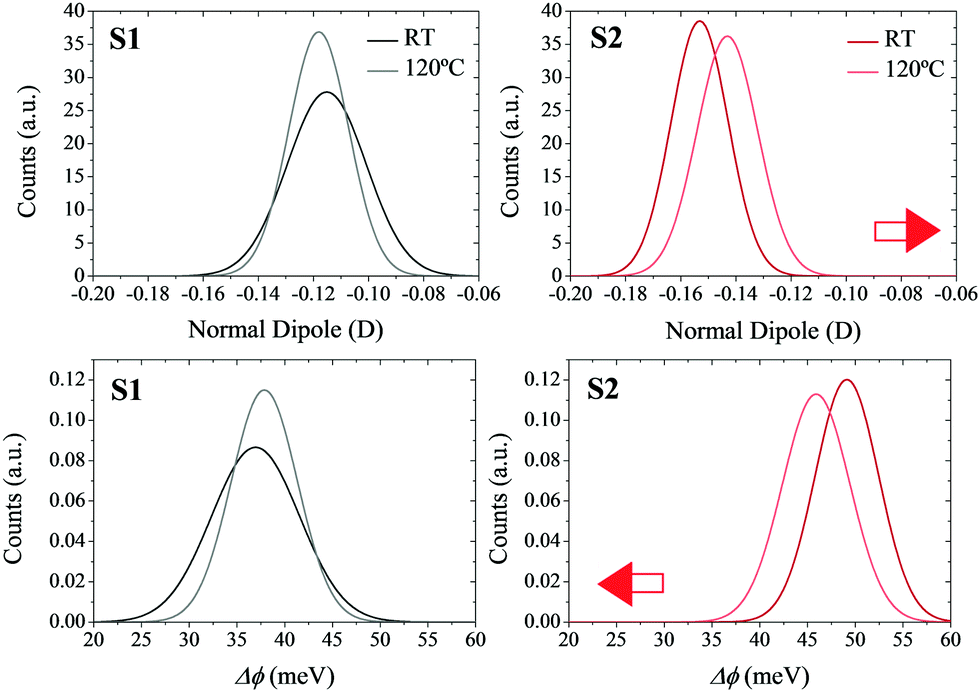 | ||
| Fig. 6 Normal distribution of the molecular dipoles normal to the surface (top) and WF shift (bottom) as a function of the temperature used in the MD/MM simulations. The red arrows represent the direction of the shifts in the normal dipoles and WF as a consequence of the increase in temperature. | ||
The results show that in the non-radical S1 SAM, the surface dipoles, and consequently the surface potential, are not highly affected by the increase in temperature. However, in the case of the radical S2 SAM, the increase in the temperature decreases the magnitude of the negative surface dipoles. The origin of this behavior is attributed to the disorder introduced with the thermal motion, which allows some molecules of the SAMs to decrease their tilt angles (see Fig. S8–S10, ESI†). These results confirm the negative shift of the surface potentials with the temperature experimented by S2, as well as its higher magnitude compared to S1. The mismatch between the values of these shifts at the theoretical versus experimental level can be explained by the fact that theoretical models consider the charges of the molecules in the SAMs equal to the charges obtained for the isolated molecules in the gas phase. In addition, the atomic charges in the Au slab were set to zero. As a result, the impact of the charge density of the neighboring molecules (depolarization effects) and of the Au slab (bond dipole) has not been taken into account in the calculation of the theoretical surface potential.
Conclusions
In this work, we have reported a joint experimental and theoretical study of the changes in the molecular dipoles and in the surface potential (or work function) observed in two polarizable D–A based SAMs – one with radical molecules (S2) and another with non-radical ones (S1) – produced by external stimuli, in particular by NIR light irradiation and temperature variations. Modifications of the surface potentials of the SAMs have been determined by means of the KPFM technique. Interestingly, both SAMs exhibit hysteretic behaviors under a DC voltage bias cycle due to the polarizability of the molecules and intermolecular interactions inside the SAMs. In addition and because the molecules in the radical S2 SAM can exist in a neutral ground state (D–A) and in a zwitterionic state (D+–A−), there is a notable reduction of the hysteresis size upon irradiation with NIR light at 950 nm as a consequence of the population of the zwitterionic state. Under such a stimulus, the negative Fc–PTM dyad dipoles increase, resulting in a positive shift of the surface potential whose magnitude and direction has been confirmed by TD-DFT calculations. Such a behavior is not observed for the non-radical S1 SAM since the molecular bistability is absent in this case. On the other hand, the thermal motion induced by an increase of the temperature tends to decrease the negative surface dipole magnitudes, which translates into negative shifts of the surface potentials of the SAMs, with changes larger for the radical S2 SAM with respect to the non-radical S1 SAM. Moreover, MM/MD simulations evidence in a qualitative way the larger negative shift of the radical SAM with respect to the non-radical one partially due to its higher disorder induced by the thermal motion. These results confirm the switchability and the increase in the WF upon IR irradiation which can reach a value as high as 250 meV, representing one of the highest values reported in the literature and the first achieved by NIR irradiation. In addition, the results reported here demonstrate that SAMs based on D–A dyads showing ICT, where the changes of molecular dipole are mainly due to an electronic redistribution, can be used for obtaining SAMs with photo switchable work functions. These peculiarities open the application of D–A based SAMs showing intramolecular charge transfer in devices to control the charge injection at metal/organic interfaces, which could have a high interest for bioelectronic applications because the NIR range fits into the so-called biological transparency window.With the results presented in this work, we aim to motivate the community of organic and bio-organic electronics to start a new research line for these systems, which will be more focused on the device fabrication. The use of these IR activated SAMs, combined with the choice of an organic semiconductor layer with a suitable HOMO energy, can be exploited as a switchable component in a new generation of responsive opto-electronic devices, such as OFETs or biological sensors.
Conflicts of interest
There are no conflicts to declare.Acknowledgements
This work was financially supported by the EC through the Marie Curie project ITN iSwitch (GA no. 642196). Computational resources were provided by the Consortium des Équipements de Calcul Intensif (CÉCI) funded by the Belgian National Fund for Scientific Research (F.R.S.-FNRS) under Grant 2.5020.11. J. C. is an FNRS research director. The authors also acknowledge the financial support from Instituto de Salud Carlos III, through “Acciones CIBER.” The Networking Research Center on Bioengineering, Biomaterials and Nanomedicine (CIBER-BBN), an initiative funded by the VI National R&D&I Plan 2008–2011, Iniciativa Ingenio 2010, Consolider Program, CIBER Actions and financed by the Instituto de Salud Carlos III with assistance from the European Regional Development Fund. The authors also appreciate the financial support through projects: FANCY (CTQ2016-80030-R), and MOTHER (MAT2016-80826-R), granted by DGI (Spain), GenCat (2017 SGR 918), financed by DGR (Catalunya), and Severo Ochoa Program Grant SEV-2015-0496, financed by Mineco (Spain).Notes and references
- J. C. Love, L. A. Estroff, J. K. Kriebel, R. G. Nuzzo and G. M. Whitesides, Chem. Rev., 2005, 105, 1103–1169 CrossRef CAS PubMed.
- I. Campbell, S. Rubin, T. Zawodzinski, J. Kress, R. Martin, D. Smith, N. Barashkov and J. Ferraris, Phys. Rev. B: Condens. Matter Mater. Phys., 1996, 54, 14321–14324 CrossRef.
- H. Ishii, K. Sugiyama, E. Ito and K. Seki, Adv. Mater., 1999, 11, 605–625 CrossRef CAS.
- B. De Boer, A. Hadipour, M. M. Mandoc, T. Van Woudenbergh and P. W. M. Blom, Adv. Mater., 2005, 17, 621–625 CrossRef CAS.
- M. Nonnenmacher, M. P. O’Boyle and H. K. Wickramasinghe, Appl. Phys. Lett., 1991, 58, 2921–2923 CrossRef.
- H. O. Jacobs, P. Leuchtmann, O. J. Homan and A. Stemmer, J. Appl. Phys., 1998, 84, 1168–1173 CrossRef CAS.
- S. J. van der Molen, H. van der Vegte, T. Kudernac, I. Amin, B. L. Feringa and B. J. van Wees, Nanotechnology, 2006, 17, 310–314 CrossRef CAS.
- M. Elbing, A. Błaszczyk, C. von Hänisch, M. Mayor, V. Ferri, C. Grave, M. A. Rampi, G. Pace, P. Samorì, A. Shaporenko and M. Zharnikov, Adv. Funct. Mater., 2008, 18, 2972–2983 CrossRef CAS.
- R. Klajn, J. F. Stoddart and B. A. Grzybowski, Chem. Soc. Rev., 2010, 39, 2203–2237 RSC.
- M. Irie, Chem. Rev., 2000, 100, 1685–1716 CrossRef CAS PubMed.
- N. Crivillers, E. Orgiu, F. Reinders, M. Mayor and P. Samorì, Adv. Mater., 2011, 23, 1447–1452 CrossRef CAS PubMed.
- H. Zhang, X. Guo, J. Hui, S. Hu, W. Xu and D. Zhu, Nano Lett., 2011, 11, 4939–4946 CrossRef CAS PubMed.
- C.-W. Tseng, D.-C. Huang and Y.-T. Tao, ACS Appl. Mater. Interfaces, 2012, 4, 5483–5491 CrossRef CAS PubMed.
- N. Crivillers, A. Liscio, F. Di Stasio, C. Van Dyck, S. Osella, D. Cornil, S. Mian, G. M. Lazzerini, O. Fenwick, E. Orgiu, F. Reinders, S. Braun, M. Fahlman, M. Mayor, J. Cornil, V. Palermo, F. Cacialli and P. Samori, Phys. Chem. Chem. Phys., 2011, 13, 14302–14310 RSC.
- N. Crivillers, S. Osella, C. Van Dyck, G. M. Lazzerini, D. Cornil, A. Liscio, F. Di Stasio, S. Mian, O. Fenwick, F. Reinders, M. Neuburger, E. Treossi, M. Mayor, V. Palermo, F. Cacialli, J. Cornil and P. Samori, Adv. Mater., 2013, 25, 432–436 CrossRef CAS PubMed.
- A. M. Masillamani, S. Osella, A. Liscio, O. Fenwick, F. Reinders, M. Mayor, V. Palermo, J. Cornil and P. Samori, Nanoscale, 2014, 6, 8969–8977 RSC.
- T. Mosciatti, M. G. del Rosso, M. Herder, J. Frisch, N. Koch, S. Hecht, E. Orgiu and P. Samori, Adv. Mater., 2016, 28, 6606–6611 CrossRef CAS PubMed.
- Q. Wang, G. Ligorio, V. Diez-Cabanes, D. Cornil, B. Kobin, J. Hildebrandt, M. V. Nardi, M. Timpel, S. Hecht, J. Cornil, E. J. W. List-Kratochvil and N. Koch, Adv. Funct. Mater., 2018, 28, 1800716 CrossRef.
- H. Zhang, H. Chen, W. Ma, J. Hui, S. Meng, W. Xu, D. Zhu and X. Guo, J. Mater. Chem. C, 2016, 4, 5289–5296 RSC.
- S. Kumar, J. T. van Herpt, R. Y. N. Gengler, B. L. Feringa, P. Rudolf and R. C. Chiechi, J. Am. Chem. Soc., 2016, 138, 12519–12526 CrossRef CAS PubMed.
- M. Souto, L. Yuan, D. C. Morales, L. Jiang, I. Ratera, C. A. Nijhuis and J. Veciana, J. Am. Chem. Soc., 2017, 139, 4262–4265 CrossRef CAS PubMed.
- V. Diez-Cabanes, D. C. Morales, M. Souto, M. Paradinas, F. Delchiaro, A. Painelli, C. Ocal, D. Cornil, J. Cornil, J. Veciana and I. Ratera, Adv. Mater. Technol., 2018, 3, 1800152 Search PubMed.
- I. Ratera, D. Ruiz-Molina, F. Renz, J. Ensling, K. Wurst, C. Rovira, P. Gutlich and J. Veciana, J. Am. Chem. Soc., 2003, 125, 1462–1463 CrossRef CAS PubMed.
- I. Ratera, C. Sporer, D. Ruiz-Molina, N. Ventosa, J. Baggerman, A. M. Brouwer, C. Rovira and J. Veciana, J. Am. Chem. Soc., 2007, 129, 6117–6129 CrossRef CAS PubMed.
- G. D’Avino, L. Grisanti, J. Guasch, I. Ratera, J. Veciana and A. Painelli, J. Am. Chem. Soc., 2008, 130, 12064–12072 CrossRef PubMed.
- L. Grisanti, G. D’Avino, A. Painelli, J. Guasch, I. Ratera and J. Veciana, J. Phys. Chem. B, 2009, 113, 4718–4725 CrossRef CAS PubMed.
- J. Guasch, L. Grisanti, S. Jung, D. Morales, G. D'Avino, M. Souto, X. Fontrodona, A. Painelli, F. Renz, I. Ratera and J. Veciana, Chem. Mater., 2013, 25, 808–814 CrossRef CAS.
- I. Ratera and J. Veciana, Chem. Soc. Rev., 2012, 41, 303–349 RSC.
- T. Yanai, D. P. Tew and N. C. Handy, Chem. Phys. Lett., 2004, 393, 51–57 CrossRef CAS.
- V. A. Rassolov, M. A. Ratner, J. A. Pople, P. C. Redfern and L. A. Curtiss, J. Comput. Chem., 2001, 22, 976–984 CrossRef CAS.
- M. J. Frisch, G. W. Trucks, H. B. Schlegel, G. E. Scuseria, M. A. Robb, J. R. Cheeseman, G. Scalmani, V. Barone, B. Mennucci, G. A. Petersson, H. Nakatsuji, M. Caricato, X. Li, H. P. Hratchian, A. F. Izmaylov, J. Bloino, G. Zheng, J. L. Sonnenberg, M. Hada, M. Ehara, K. Toyota, R. Fukuda, J. Hasegawa, M. Ishida, T. Nakajima, Y. Honda, O. Kitao, H. Nakai, T. Vreven, J. A. Montgomery, Jr., J. E. Peralta, F. Ogliaro, M. Bearpark, J. J. Heyd, E. Brothers, K. N. Kudin, V. N. Staroverov, R. Kobayashi, J. Normand, K. Raghavachari, A. Rendell, J. C. Burant, S. S. Iyengar, J. Tomasi, M. Cossi, N. Rega, J. M. Millam, M. Klene, J. E. Knox, J. B. Cross, V. Bakken, C. Adamo, J. Jaramillo, R. Gomperts, R. E. Stratmann, O. Yazyev, A. J. Austin, R. Cammi, C. Pomelli, J. W. Ochterski, R. L. Martin, K. Morokuma, V. G. Zakrzewski, G. A. Voth, P. Salvador, J. J. Dannenberg, S. Dapprich, A. D. Daniels, Ö. Farkas, J. B. Foresman, J. V. Ortiz, J. Cioslowski and D. J. Fox, Gaussian 09, Revision D.01, Gaussian Inc. Wallingford, CT, USA, 2013 Search PubMed.
- A. Dreuw and M. Head-Gordon, J. Am. Chem. Soc., 2004, 126, 4007–4016 CrossRef CAS PubMed.
- A. Dreuw and M. Head-Gordon, Chem. Rev., 2005, 105, 4009–4037 CrossRef CAS PubMed.
- M. Gobbi, S. Bonacchi, J. X. Lian, Y. Liu, X.-Y. Wang, M.-A. Stoeckel, M. A. Squillaci, G. D’Avino, A. Narita, K. Müllen, X. Feng, Y. Olivier, D. Beljonne, P. Samorì and E. Orgiu, Nat. Commun., 2017, 8, 14767 CrossRef CAS PubMed.
- D. A. Egger and E. Zojer, J. Phys. Chem. Lett., 2013, 4, 3521–3526 CrossRef CAS PubMed.
- L. Romaner, G. Heimel, C. Ambrosch-Draxl and E. Zojer, Adv. Funct. Mater., 2008, 18, 3999–4006 CrossRef CAS.
- J. Topping, Proc. R. Soc. London, Ser. A, 1927, 114, 67–72 CrossRef.
- D. Cornil, Y. Olivier, V. Geskin and J. Cornil, Adv. Funct. Mater., 2007, 17, 1143–1148 CrossRef CAS.
- M. L. Sushko and L. A. Shluger, Adv. Funct. Mater., 2008, 18, 2228–2236 CrossRef CAS.
- M. Piacenza, S. D’Agostino, E. Fabiano and F. D. Sala, Phys. Rev. B: Condens. Matter Mater. Phys., 2009, 80, 1–4 CrossRef.
- A. Verdaguer, M. Cardellach, J. J. Segura, G. M. Sacha, J. Moser, M. Zdrojek, A. Bachtold and J. Fraxedas, Appl. Phys. Lett., 2009, 94, 233105 CrossRef.
Footnotes |
| † Electronic supplementary information (ESI) available: Details about the synthesis of S1 and S2 SAMs, Kelvin Probe Force Microscopy (KPFM) data, computational details, supporting figures and tables, and author contributions. See DOI: 10.1039/c9tc00906j |
| ‡ Current address: Instituto de Ciencia Molecular (ICMol), Universidad de Valencia, c/Catedrático José Beltrán, 2, 46980 Paterna, Spain. |
| This journal is © The Royal Society of Chemistry 2019 |