 Open Access Article
Highly efficient platinum-based emitters for warm white light emitting diodes†
Violeta
Sicilia
 *a,
Sara
Fuertes
 b,
Andrés J.
Chueca
 b,
Lorenzo
Arnal
 b,
Antonio
Martín
 b,
Mariano
Perálvarez
 c,
Chiara
Botta
 d and
Umberto
Giovanella
 d
d
aDepartamento de Química Inorgánica, Escuela de Ingeniería y Arquitectura de Zaragoza, Instituto de Síntesis Química y Catálisis Homogénea (ISQCH), CSIC – Universidad de Zaragoza, Campus Río Ebro, Edificio Torres Quevedo, 50018, Zaragoza, Spain. E-mail: v.sicilia@csic.es
bDepartamento de Química Inorgánica, Facultad de Ciencias, Instituto de Síntesis Química y Catálisis Homogénea (ISQCH), CSIC – Universidad de Zaragoza, Pedro Cerbuna 12, 50009, Zaragoza, Spain
cIREC, Catalonia Institute for Energy Research, Jardins de les Dones de Negre 1. PL2, 08930 Sant Adrià de Besòs, Barcelona, Spain
dIstituto per lo Studio delle Macromolecole, Consiglio Nazionale delle Ricerche (CNR), Via Corti 12, 20133, Milano, Italy
First published on 1st March 2019
Abstract
New cycloplatinated N-heterocyclic carbene (NHC) compounds with chelate diphosphines (P^P) as ancillary ligands, [Pt(R-C^C*)(P^P)]PF6 (R-C = Naph, P^P = dppm 1A, dppe 2A, dppbz 3A; R = CO2Et, P^P = dppm 1B, dppe 2B, dppbz 3B), have been prepared. Their photophysical properties have been extensively studied and supported by the time-dependent-density functional theory (TD-DFT). These compounds show a great thermal stability and a very efficient blue (CO2Et-C^C*) or cyan (Naph^C*) emission in PMMA films (5 wt%), with photoluminescence quantum yield (PLQY) ranging from 53% to 95%. In the solid state, the emission of the Naph^C* derivatives becomes orange (1A, 2A) or white (3A, dual blue and yellow emission) due to the operating π–π intermolecular interactions. We have investigated the potential use of these materials for solid-state lighting (SSL) applications. OLEDs with different architectures containing mixtures of 1B and 3A in different ratios as dopants were fabricated. In addition, two-component white light remote phosphors were obtained by stacking different combinations of 1B or 3B as the blue emitter with [Pt(bzq)(CN)(CNXyl)] (R) (bzq = benzoquinolate, Xyl = 2,6-dimethylphenyl) as the red emitter using a 365 nm LED as pumping source. By changing the blue![[thin space (1/6-em)]](https://www.rsc.org/images/entities/char_2009.gif) :
:![[thin space (1/6-em)]](https://www.rsc.org/images/entities/char_2009.gif) red ratio, warm white light with optimal CRI and Duv values and a great range of nominal CCT (4000–2000 K) was obtained.
red ratio, warm white light with optimal CRI and Duv values and a great range of nominal CCT (4000–2000 K) was obtained.
Introduction
With the irruption of LED technology in the lighting arena, different kinds of LED architectures capable of creating white light in an efficient and reliable manner have been developed.1 Currently, two types of phosphor-converted white LEDs (pcWLEDs) are commercially available depending on their excitation wavelength. On one hand, there are those based on a blue LED (InGaN) chip coated with a yellow phosphor (e.g. Y3Al5O12:Ce3+ = YAG:Ce). On the other hand are those based on near ultraviolet (NUV) LED pumping coated with a mixture of different phosphors. In both cases white emission is achieved through excitation and subsequent re-emission, but the complexity is bigger in the latter since the blue contribution is also covered by a phosphor. In order to get photo-biologically healthier white light, the key issue in this technology is to minimize the fraction of blue light (around 460 nm) which potentially leads to warmer CCTs.1–3There is growing evidence that inadequate light during the day and mainly during the evenings or at night contributes to sleep problems and circadian clock misalignment.4–6 Because the melanopsin contained in the retinal ganglion cells (ipRGCs) is photoactivated by 460 nm blue light, the artificial light striking the retina between dusk and dawn inhibits sleep-promoting neurons in the hypothalamus, and suppresses the nightly release of the soporific hormone melatonin.7,8 These factors reduce sleepiness, increase alertness and lead to the development of health problems like obesity, heart disease, depression and neurodegenerative diseases such as Alzheimer’s and Parkinson’s.9,10
So, low CCTs, high luminous efficiency (LE) and high color rendering index (CRI) are important characteristics to be considered when fabricating pcWLEDs as environmentally friendly light sources. Also, concerning the chemical composition, the use of rare-earth-based phosphors leads us to foresee a long-term price rise and some logistical problems on the horizon.11 In this sense, phosphorescent organometallic transition metal complexes (TMCs) have become crucial in the development of electroluminescent devices such as phosphorescent organic light-emitting diodes (PhOLEDs) and white-light-emitting electrochemical cells (LEECs), mostly those of Ir(III)12–14 and Pt(II).15–18
Newly developed strategies to achieve efficient white emitting devices have been focused on single-doped WOLEDs using square planar platinum(II) complexes. In these systems, the white light is obtained by combination of blue emission from isolated molecules and orange-red emission from excimers. Controlling the dopant concentration to obtain efficient systems has been successfully accomplished; however, their CRI values are still below 80.19–24
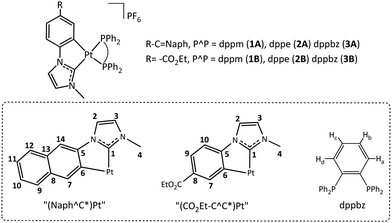
The work presented here represents the research of technological alternatives that could improve solid state lighting (SSL) technology in terms of light quality and cost; light quality because we report on systems capable of generating white light with high CRI and low CCT values, and cost because all the compounds reported in this work are 100% rare-earth-free emitting phosphors. Therefore, keeping with our mastered organometallic approach of using cyclometalated N-heterocyclic carbenes (NHC) as highly efficient emitters to prepare lighting devices,25–27 herein we report the synthesis and complete structural and photophysical studies of cycloplatinated NHC compounds with diphosphines (P^P) as auxiliary ligands, [Pt(R-C^C*)(P^P)]PF6 (R-C = Naph, P^P = dppm 1A, dppe 2A, dppbz 3A; R = CO2Et, P^P = dppm 1B, dppe 2B, dppbz 3B). Taking into account their emitting features, we used a selection of them as blue (1B, 3B), and orange (1A) emitters for SSL applications: WOLEDs and remote pcWLEDs. The red emitter ([Pt(bzq)(CN)(CNtBu)], bzq = benzo[h]-quinoline; R) was used to obtain warm and healthy white light illumination.
Results and discussion
2.1. Emissive compounds: synthesis and characterization
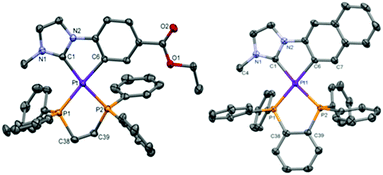
Compounds [Pt(R-C^C*)(P^P)]PF6 (1A–3A; 1B–3B, see Scheme 1) were prepared in high yields, 86% 2A – 66% 2B, from the corresponding starting compound [{Pt(μ-Cl)(R-C^C*)}2].25,26The most relevant structural information came from multinuclear NMR spectra (see Table 1, Experimental section and ESI† part 2) and the X-ray diffraction study of single crystals of 1A, 3A, and 1B–3B (see Fig. 1 and ESI† part 3 for figures, data and discussion). The two inequivalent P atoms of the dppm derivatives (1A/1B) (Table 1 and Fig. S1 for 1B, ESI†) appear upfield shifted with respect to that of free dppm (δ = −23.8 ppm)28 as an AB system (JP,P ∼ 40 Hz). However, those for the dppe in 2A/2B and dppbz in 3A/3B (Fig. S2 for 2A, ESI†) appear downfield shifted with respect to that of the corresponding free diphosphine (dppe = −12.5 ppm, dppbz = −13.8 ppm)28 as AX systems with JP,P values of about 5 Hz.29 Every 31P signal appears flanked by two sets of 195Pt satellites. The larger 1JPt,P value corresponds to the P atom located trans to the N-heterocyclic carbene (C1), whose trans influence is smaller than that of the aromatic C atom (C6).30 The 195Pt{1H} NMR spectrum of each compound shows a doublet of doublets due to the coupling of the Pt center to two inequivalent P atoms (see Fig. S3, ESI† and Table 1). It is worth noting the downfield shift of the 195Pt resonances of the dppm complexes (1A/1B) when compared to those of the dppe (2A/2B) and dppbz (3A/3B) counterparts, which can be attributed to the great strain in the 4-membered ring.28,29
| δPt | 1 J Pt,Ptrans-C1 | 1 J Pt,Ptrans-C6 | δPtrans-C1 | δPtrans-C6 | J P,P | |
|---|---|---|---|---|---|---|
| a 162 MHz, CD2Cl2. b 86 MHz, CD2Cl2. | ||||||
| 1A | 4384.0 | 2398.6 | 1526.1 | −36.9νA | −37.5νB | 39.8 |
| 2A | 4991.0 | 2715.1 | 1925.9 | 50.6 | 43.6 | 6.0 |
| 3A | 4906.0 | 2671.6 | 1915.4 | 47.6 | 39.3 | 4.1 |
| 1B | 4411.8 | 2378.4 | 1556.7 | −37.9νA | −38.3νB | 40.3 |
| 2B | 5013.7 | 2706.5 | 1958.5 | 50.6 | 43.6 | 6.2 |
| 3B | 4955.8 | 2670.4 | 1950.8 | 47.7 | 40.5 | 4.7 |
Thermo-gravimetric analyses (TGA) of all compounds indicate that they are stable under an argon atmosphere at 1 atm over 350 °C (368.21 °C 1A, 383.40 °C 2A, 399.83 °C 3A, 350.72 °C 1B, 350.31 °C 2B and 381.13 °C 3B).
2.2. Photophysical properties and theoretical calculations
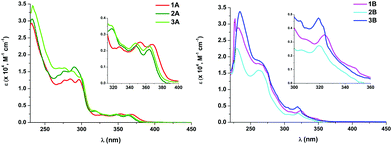 | ||
| Fig. 2 UV-Vis absorption spectra of 1A–3A (left) and 1B–3B (right) in CH2Cl2 (5 × 10⁻⁵ M). Insets: Expanded views of the lower-energy absorptions. | ||
Theoretical calculations (DFT and TD-DFT) were carried out on the cations of 1A, 3A, 1B and 3B (see ESI† part 5 for tables, figures and discussion). Considering that in each case, the calculated spin-allowed transition (S1) fits well with the lowest energy absorption and that the main contribution to it is the HOMO to LUMO transition, the origin of this absorption can be ascribed to mixed LL′CT [π(NHC) → π*(P^P)]/LMCT [π(NHC) → 5d(Pt)]/ILCT [π(NHC) → π*(NHC)] transitions for the Naph^C* derivatives (1A and 3A), and to LL′CT [π(NHC) → π*(P^P)]/ILCT [π(NHC) → π*(NHC)] for the EtO2C-C^C* ones (1B and 3B).
![[double bond, length as m-dash]](https://www.rsc.org/images/entities/char_e001.gif) C/C
C/C![[double bond, length as m-dash]](https://www.rsc.org/images/entities/char_e001.gif) N stretches of the cyclometalated NHC ligands) at λ ∼ 470 nm for 1A–3A or 450–464 nm for 1B–3B (see Fig. 3 for 1A and 1B). The corresponding decays are monoexponential with slower decay time (286–563 μs) for 1A–3A and faster (∼20 μs) for 1B–3B, indicative of triplet state emissions. These values are in agreement with those observed for other compounds containing these same “(R-C^C*)Pt” (R-C = Naph, R = CO2Et) moieties.26,27,30
N stretches of the cyclometalated NHC ligands) at λ ∼ 470 nm for 1A–3A or 450–464 nm for 1B–3B (see Fig. 3 for 1A and 1B). The corresponding decays are monoexponential with slower decay time (286–563 μs) for 1A–3A and faster (∼20 μs) for 1B–3B, indicative of triplet state emissions. These values are in agreement with those observed for other compounds containing these same “(R-C^C*)Pt” (R-C = Naph, R = CO2Et) moieties.26,27,30
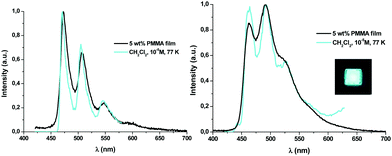 | ||
| Fig. 3 Normalized emission spectra of 1A (left) and 1B (right) upon excitation with UV light. Picture under UV light (365 nm). | ||
Contrary to what has been observed throughout the UV-vis absorption and TD-DFT sections, the emission energy of the Naph^C* derivatives (1A–3A) does not depend on the P^P ligand, whereas those of their B (1B–3B) counterparts clearly do (see Fig. S12, ESI†). This relationship, together with the observed difference in their emission lifetimes, suggests that emissions of the A and B derivatives arise from different kinds of excited states. Considering the TD-DFT calculations, these phosphorescent emissions can be assigned mainly to the 3ILCT [π(NHC) → π*(NHC)] excited state for 1A–3A and to mixed 3LL′CT [π(NHC) → π*(P^P)]/3ILCT [π(NHC) → π*(NHC)] transitions for 1B–3B. At higher concentration (10−3 M) in CH2Cl2 at 77 K or in the solid state, the emissions of compounds 1B–3B (see Fig. 4a and Table S10, ESI†) do not differ much from those obtained in diluted solution (CH2Cl2 10−5 M, 77K). Differently, compounds 1A–3A, at higher concentration in CH2Cl2 (10−3 M), display wavelength-dependent emissions (see Table S10, ESI†), similarly to those observed in the related complexes [(Naph^C*)Pt(CNR′)2]PF6 (R′ = t-Bu, Xyl).26 Upon excitation at λex ≤ 380 nm, they show a high energy (HE) emission band identical to the one observed in diluted solution. At longer excitation wavelengths (λex ∼ 400 nm), the intensity of the HE band decreases and a low energy (LE) emission band with a maximum at ca. 565 nm becomes dominant (Fig. S13 for 1A, ESI†). The LE emission fits the main one observed in powdered samples of 1A–3A upon excitation in the range 360–375 nm (see Fig. 4b). For these solid samples, just in compound 3A, a significant contribution of the HE emission is also observed, but the LE band can be obtained upon selective excitation at longer wavelengths (400 nm). This structured LE band, which exhibits shorter lifetime (≤100 μs) and a red-shifted excitation profile compared to those of the HE band, can be tentatively assigned to 3ππ* transitions, due to the formation of aggregates in the ground state as supported by the X-ray diffraction studies.
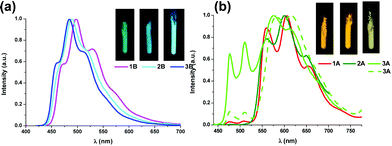 | ||
| Fig. 4 Normalized emission spectra of 1B–3B (a) and 1A–3A (b) in the solid state at r.t. (—, λex = 375 nm and ---, λex = 400 nm, for 3A). Pictures under UV light (365 nm). | ||
Photoluminescence (PL) quantum yield (Φ) measurements in PMMA films revealed that all complexes are very good emitters at room temperature (QY ranging from 53% to 95%) and are amongst the most efficient blue and green-cyan emitters of platinum(II) in PMMA film: [Pt(C^C*)(acac)] (Φ = 0.86,32 0.90,33), [Pt(C*^C^C*)Cl] (Φ = 0.3234) and [Pt(C^X-L^L′)] [C^X = phenyl methyl imidazole; L^L′ = phenoxy pyridine, Φ = 0.58; L^L′ = carbazolyl pyridine, Φ = 0.89; C^X = phenyl pyrazole; L^L′ = carbazolyl pyridine, Φ = 0.85].35
2.3. Device performance and characteristics
In light of the observed quantum efficiency and thermal stability of these compounds, their great potential to be incorporated as emitting centers within a SSL-based architecture for white light generation becomes clear, in our case for OLEDs and remote phosphor-based devices.With a view to achieving white electroluminescence, by exploiting blue emission from 1A and green-orange emissions from 3A, devices with emissive layer (EML) containing the two dopants with different formulations were manufactured with basic and advanced architectures (see Table 2 and Fig. 5 left).
| 3A:1B | HTL (%) | ETL (%) | EQEmax (%) [V] | CRI | CCT | CIE (x, y) | D uv | |
|---|---|---|---|---|---|---|---|---|
| a Obtained at 12 V (L10–L12) and 10 V (L13–L15). | ||||||||
| L10 | 10/10 | 57 | 23 | 0.32 [11] | 65.8 | 2592 | 0.47, 0.41 | 0.0004 |
| L11 | 10/15 | 52.5 | 22.5 | 0.1 [8] | 72.0 | 2745 | 0.47, 0.44 | 0.0090 |
| L12 | 10/20 | 49 | 21 | 0.05 [9] | 72.0 | 2723 | 0.48, 0.44 | 0.0098 |
| L13 | 10/10 | 57 | 23 | 0.2 [14] | 75.7 | 5281 | 0.34, 0.41 | 0.0298 |
| L14 | 10/5 | 59.5 | 25.5 | 0.125 [13] | 76.8 | 4055 | 0.39, 0.44 | 0.0306 |
| L15 | 15/5 | 56 | 24 | 0.15 [12] | 74.8 | 3326 | 0.44, 0.45 | 0.0230 |
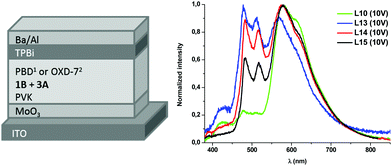 | ||
| Fig. 5 (left) Device architectures of white OLEDs: 1L10–L12; 2L13–L15; (right) EL spectra at 10 V of L10, L13–L15. | ||
Devices L10–L12 were built with the ITO/MoO3/EML/TPBi/Ba/Al configuration. The EL spectrum of L10 (see Fig. 5), with a content of 3A![[thin space (1/6-em)]](https://www.rsc.org/images/entities/char_2009.gif) :
:![[thin space (1/6-em)]](https://www.rsc.org/images/entities/char_2009.gif) 1B in the ratio of 10
1B in the ratio of 10![[thin space (1/6-em)]](https://www.rsc.org/images/entities/char_2009.gif) :
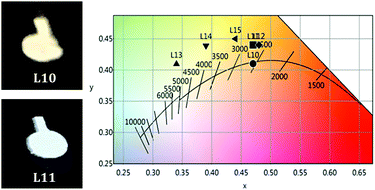
:![[thin space (1/6-em)]](https://www.rsc.org/images/entities/char_2009.gif) 10 wt%, shows a main emission from 3A (LE band) with very weak contributions of PVK and 1B. The white light produced has a very appealing warm temperature of 2592 K, within the Planckian locus (see Fig. 6 and Table 2), but the small contribution of the blue components renders a rather poor CRI (65.8). The increase of the amount of the blue emitter, 1B, in L11 (15 wt%) and L12 (20 wt%) does not improve the colorimetric or photometric data with respect to those of L10 (see Table 2 and Fig. S16 in the ESI†).
10 wt%, shows a main emission from 3A (LE band) with very weak contributions of PVK and 1B. The white light produced has a very appealing warm temperature of 2592 K, within the Planckian locus (see Fig. 6 and Table 2), but the small contribution of the blue components renders a rather poor CRI (65.8). The increase of the amount of the blue emitter, 1B, in L11 (15 wt%) and L12 (20 wt%) does not improve the colorimetric or photometric data with respect to those of L10 (see Table 2 and Fig. S16 in the ESI†).
For devices L13–L15, PBD was replaced by 1,3-bis(5-(4-(tert-butyl)phenyl)-1,3,4-oxadiazol-2-yl)benzene (OXD-7, HOMO = −6.5 eV; LUMO = −2.8 eV), as a further optimization step (Fig. 5 left). The EL spectrum (see Fig. 5 right) reveals that the blue emission arising from 1B becomes more relevant thanks to the slightly different energy levels of OXD-7 with respect to PBD. However, there is still a big contribution of the LE band of 3A, increasing as the ratio 3A![[thin space (1/6-em)]](https://www.rsc.org/images/entities/char_2009.gif) :
:![[thin space (1/6-em)]](https://www.rsc.org/images/entities/char_2009.gif) 1B increases from 2
1B increases from 2![[thin space (1/6-em)]](https://www.rsc.org/images/entities/char_2009.gif) :
:![[thin space (1/6-em)]](https://www.rsc.org/images/entities/char_2009.gif) 1 (L14) to 3
1 (L14) to 3![[thin space (1/6-em)]](https://www.rsc.org/images/entities/char_2009.gif) :
:![[thin space (1/6-em)]](https://www.rsc.org/images/entities/char_2009.gif) 1 (L15). As a result, a warmer white light and CRI in the range of 74.8–76.8 were observed.
1 (L15). As a result, a warmer white light and CRI in the range of 74.8–76.8 were observed.
White OLEDs switch on at about 5–7 V (Fig. S17 in the ESI†), probably due to the aforementioned high potential barriers for charge injection, mainly for holes, that should be further reduced by interfacial engineering. At high current density the maximum luminance recorded is in the range of 50–250 cd m−2 depending on EML formulations and device architectures. The combined highest EQE (0.2%) and better CIE (0.34; 0.41) and CRI (75.7) were achieved for device L13. As has already been reported for this type of devices,36,37 a moderate efficiency roll-off (Fig. S18 in the ESI†) due to triplet–triplet annihilation, typical of long-lived excited triplet states, cannot be avoided.
| Devices (components) | CRIa | CCTb | D uv | LFc (mlm) | LERd (lm W−1) | LEe (lm W−1) | WPEf (%) | CIE 1931 (x, y)g |
|---|---|---|---|---|---|---|---|---|
| a Color rendering index. b Correlated color temperature. c Luminous flux. d Luminous efficacy of the radiation. e Luminous efficacy. f Wall-plug efficiency. g CIE coordinates. | ||||||||
| D1 ( 1B / 1A ) | 57.7 | 3292 | 0.019 | 237.2 | 379.5 | 0.86 | 0.41 | 0.4431, 0.4576 |
| D2 ( 3B / 1A ) | 62.4 | 3586 | 0.015 | 242.9 | 360.4 | 0.88 | 0.45 | 0.4158, 0.4313 |
| D3 ( 1B / R ) | 94.3 | 2532 | 0.0031 | 173.1 | 239.8 | 0.63 | 0.56 | 0.4801, 0.4231 |
| D4 ( 3B / R ) | 92.5 | 2570 | 0.0037 | 197.2 | 226.7 | 0.72 | 0.52 | 0.4641, 0.4014 |
| D5 ( 3B / R ) | 83.6 | 3706 | 0.0057 | 179.6 | 227.9 | 0.65 | 1.53 | 0.3894, 0.3700 |
| D6 ( 3B / R ) | 81.7 | 3938 | 0.0024 | 214.1 | 228.7 | 0.78 | 1.18 | 0.3815, 0.3722 |
| D7 ( 3B / R ) | 85.7 | 1918 | 0.00097 | 140.6 | 209.9 | 0.51 | 0.46 | 0.5380, 0.4146 |
| D8 ( 3B / R ) | 92.3 | 2176 | 0.0039 | 157.7 | 217.2 | 0.57 | 0.59 | 0.4998, 0.4032 |
| D9 ( 1B / R ) | 93.7 | 3078 | 0.0065 | 183.1 | 249.1 | 0.67 | 0.99 | 0.4409, 0.4222 |
| D10 ( 1B / R ) | 90.2 | 3355 | 0.0064 | 168.1 | 247.9 | 0.61 | 1.44 | 0.4214, 0.4138 |
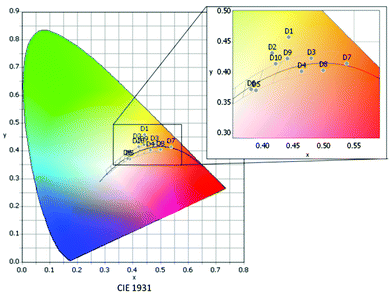 | ||
| Fig. 8 Distribution of the different devices in the CIE 1931 color space according to their respective color coordinates D1–D10. | ||
Devices D1 and D2, both containing compound 1A as the warm component, present rather low CRI and non-convenient high LER values,39 the latter attributed to the excessive overlay of the emission bands of the cool (1B, 3B) and warm (1A) components, resulting in an increase of the intensity at the green region of the visible spectrum (Fig. S19, ESI†). Also the CIE coordinates reveal that D1 and D2 are not suitable in the current configuration for white light applications, since they are far from the ideal Planckian locus (|Duv| > 0.006) (Table 3 and Fig. 8).
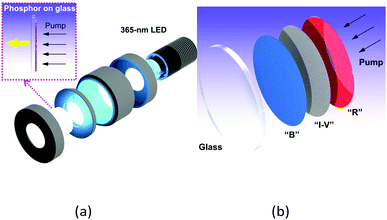
To solve these problems, 1A was substituted by the red-emitter [Pt(bzq)(CN)(CNXyl)] (R),39 with a less pronounced overlay of the emission band with those of 1B and 3B. Comparison of devices D3 and D4, which just differ in the nature of the blue phosphor (1B in D3, 3B in D4), seems to indicate that both 1B and 3B, combined with the R component in a 2![[thin space (1/6-em)]](https://www.rsc.org/images/entities/char_2009.gif) :
:![[thin space (1/6-em)]](https://www.rsc.org/images/entities/char_2009.gif) 1 ratio, lead to devices with very similar photometric and colorimetric parameters. In both cases, these have excellent CRI values (94.3, 92.5) and CIE coordinates along the Planckian locus (|Duv| < 0.006). The spectral shape of devices D3 and D4 resembles that obtained from incandescent lamps (CRI 100) (Fig. 9 top). An increase of the blue
1 ratio, lead to devices with very similar photometric and colorimetric parameters. In both cases, these have excellent CRI values (94.3, 92.5) and CIE coordinates along the Planckian locus (|Duv| < 0.006). The spectral shape of devices D3 and D4 resembles that obtained from incandescent lamps (CRI 100) (Fig. 9 top). An increase of the blue![[thin space (1/6-em)]](https://www.rsc.org/images/entities/char_2009.gif) :
:![[thin space (1/6-em)]](https://www.rsc.org/images/entities/char_2009.gif) red ratio to 3
red ratio to 3![[thin space (1/6-em)]](https://www.rsc.org/images/entities/char_2009.gif) :
:![[thin space (1/6-em)]](https://www.rsc.org/images/entities/char_2009.gif) 1 or 4
1 or 4![[thin space (1/6-em)]](https://www.rsc.org/images/entities/char_2009.gif) :
:![[thin space (1/6-em)]](https://www.rsc.org/images/entities/char_2009.gif) 1 leads to a much colder light. The 3B-containing devices (CCT = 3706 K D5, 3938 K D6) show colder light and lower CRI values (ca. 83) than those of the 1B-containing ones (3078 K D9, 3355 K D10, CRI > 90) but for all of them, the CIE coordinates are along the Planckian locus (|Duv| < 0.006).
1 leads to a much colder light. The 3B-containing devices (CCT = 3706 K D5, 3938 K D6) show colder light and lower CRI values (ca. 83) than those of the 1B-containing ones (3078 K D9, 3355 K D10, CRI > 90) but for all of them, the CIE coordinates are along the Planckian locus (|Duv| < 0.006).
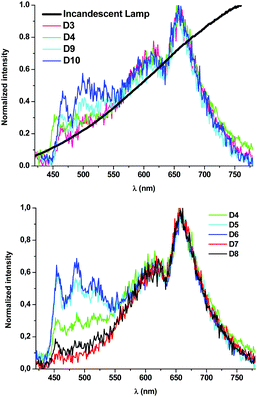 | ||
| Fig. 9 Normalized emission spectra of devices D3, D4, D9 and D10 and a typical incandescent lamp in the visible region of the spectrum (top) and devices D4–D8 (bottom). | ||
If we compare those devices (D4–D8) containing the same active components, 3B as blue and R as red, it seems clear that modifications in the relative number of layers of each phosphor (3B![[thin space (1/6-em)]](https://www.rsc.org/images/entities/char_2009.gif) :
:![[thin space (1/6-em)]](https://www.rsc.org/images/entities/char_2009.gif) R ratio: 0.5
R ratio: 0.5![[thin space (1/6-em)]](https://www.rsc.org/images/entities/char_2009.gif) :
:![[thin space (1/6-em)]](https://www.rsc.org/images/entities/char_2009.gif) 1 D7, 0.66
1 D7, 0.66![[thin space (1/6-em)]](https://www.rsc.org/images/entities/char_2009.gif) :
:![[thin space (1/6-em)]](https://www.rsc.org/images/entities/char_2009.gif) 1 D8, 2
1 D8, 2![[thin space (1/6-em)]](https://www.rsc.org/images/entities/char_2009.gif) :
:![[thin space (1/6-em)]](https://www.rsc.org/images/entities/char_2009.gif) 1 D4, 3
1 D4, 3![[thin space (1/6-em)]](https://www.rsc.org/images/entities/char_2009.gif) :
:![[thin space (1/6-em)]](https://www.rsc.org/images/entities/char_2009.gif) 1 D5, 4
1 D5, 4![[thin space (1/6-em)]](https://www.rsc.org/images/entities/char_2009.gif) :
:![[thin space (1/6-em)]](https://www.rsc.org/images/entities/char_2009.gif) 1 D6) lead to a fine control of the CCT values (Fig. 9 bottom) with no dramatic change in the rest of the parameters. In light of the above sequence, it becomes clear that the amount of R contributes to making the emission warmer; it is possible to achieve devices with high CRI (81.7–92.5), CCT values ranging from 1918 K (D7) to 3938 K (D6) and CIE coordinates along the Planckian locus (|Duv| ∼ 0.00097–0.0057).
1 D6) lead to a fine control of the CCT values (Fig. 9 bottom) with no dramatic change in the rest of the parameters. In light of the above sequence, it becomes clear that the amount of R contributes to making the emission warmer; it is possible to achieve devices with high CRI (81.7–92.5), CCT values ranging from 1918 K (D7) to 3938 K (D6) and CIE coordinates along the Planckian locus (|Duv| ∼ 0.00097–0.0057).
Therefore, this approach allows the fabrication of devices with a great range of nominal CCT values: 4000 K (D6), 3500 K (D5 and D10), 3000 K (D9) and almost 2600 K (D3 and D4), and opens the gate to even very- or ultrawarm devices (D7 and D8) operating in the “firelight” range of CCTs (1918 K D7 and 2176 K D8),40 in all cases within optimal CRI and Duv values,41 that are far more superior than those reported as warm white light LEDs.42–46
Conclusions
New cycloplatinated N-heterocyclic carbene (NHC) compounds with chelate diphosphines (P^P) as ancillary ligands, [Pt(R-C^C*)(P^P)]PF6 (R-C = Naph, CO2Et; P^P = dppm, dppe, dppbz), were prepared from their corresponding starting materials, [{Pt(R-C^C*)(μ-Cl)}2]. The presence of two chelate ligands (C^C* and P^P) in these complexes confers them great robustness and thermal stability. Compounds [Pt(CO2Et-C^C*)(P^P)]PF6 (P^P = dppm 1B, dppbz 3B) and [Pt(Naph^C*)(dppbz)]PF6 (3A) were selected for fabrication of white light-emitting devices because of their emitting features and high PLQY in PMMA films (74% 1B, 95% 3B, 89% 3A). OLEDs with different architectures containing them showed modest EQEs (in the range of 0.5%) which has been attributed to charge carrier injection and balance issues, and the development of new matrices with HOMOs and LUMOs more adequate for these compounds or more effective interface engineering would be necessary.White light with satisfactory photometric and colorimetric parameters was obtained by combination of 1B or 3B as blue with [Pt(bzq)(CN)(CNXyl)] (R) as red emitters in two-component remote phosphor devices. Using 1B or 3B and changing the blue![[thin space (1/6-em)]](https://www.rsc.org/images/entities/char_2009.gif) :
:![[thin space (1/6-em)]](https://www.rsc.org/images/entities/char_2009.gif) red ratio under a 365 nm LED pumping source, warm white light with optimal CRI and Duv values and a great range of nominal CCT values (4000 K, 3500 K, 3000 K, 2500 K and 2000 K) could be obtained. The emission spectra of these systems mimic that of the incandescent light, with a much reduced impact of the blue component. These findings show a great promise of these systems for photo-biologically healthier solid-state lighting.
red ratio under a 365 nm LED pumping source, warm white light with optimal CRI and Duv values and a great range of nominal CCT values (4000 K, 3500 K, 3000 K, 2500 K and 2000 K) could be obtained. The emission spectra of these systems mimic that of the incandescent light, with a much reduced impact of the blue component. These findings show a great promise of these systems for photo-biologically healthier solid-state lighting.
Experimental
General information is included in the ESI.†
![[double bond, length as m-dash]](https://www.rsc.org/images/entities/char_e001.gif) O), 836, 556 (s, PF6). MS (MALDI+): m/z (100) 808.1 [M]+. ΛM (5 × 10⁻⁴ M acetone solution): 68.4 Ω−1 cm2 mol−1.
O), 836, 556 (s, PF6). MS (MALDI+): m/z (100) 808.1 [M]+. ΛM (5 × 10⁻⁴ M acetone solution): 68.4 Ω−1 cm2 mol−1.
![[double bond, length as m-dash]](https://www.rsc.org/images/entities/char_e001.gif) O), 831, 556 (s, PF6). MS (MALDI+): m/z (100) 822.2 [M]+. ΛM (5 × 10⁻⁴ M acetone solution): 64.8 Ω−1 cm2 mol−1.
O), 831, 556 (s, PF6). MS (MALDI+): m/z (100) 822.2 [M]+. ΛM (5 × 10⁻⁴ M acetone solution): 64.8 Ω−1 cm2 mol−1.
![[double bond, length as m-dash]](https://www.rsc.org/images/entities/char_e001.gif) O), 832, 548 (s, PF6). MS (MALDI+): m/z (100) 870.1 [M]+. ΛM (5 × 10⁻⁴ M acetone solution): 67.8 Ω−1 cm2 mol−1.
O), 832, 548 (s, PF6). MS (MALDI+): m/z (100) 870.1 [M]+. ΛM (5 × 10⁻⁴ M acetone solution): 67.8 Ω−1 cm2 mol−1.
Conflicts of interest
There are no conflicts to declare.Acknowledgements
This work was supported by the Spanish Ministerio de Economía y Competitividad (MINECO)/FEDER (Project CTQ2015-67461-P led by Dr Babil Menjón) and by the Gobierno de Aragón and Fondo Social Europeo (Grupo E17_17R: Química Inorgánica y de los Compuestos Organometálicos led by Dr José M. Casas). The authors thank the Instituto de Biocomputación y Física de Sistemas Complejos (BIFI) and Centro de Supercomputación de Galicia (CESGA) for generous allocation of computational resources. U. G. and C. B. acknowledge the support of Project I-Zeb, III Accordo Quadro CNR-Regione Lombardia. We acknowledge support of the publication fee by the CSIC Open Access Publication Support Initiative through its Unit of Information Resources for Research (URICI).References
- Y. C. Lin, M. Karlsson and M. Bettinelli, Top. Curr. Chem., 2016, 374, 21 CrossRef PubMed.
- E. Pavitra, G. S. R. Raju, J. Y. Park, L. Wang, B. K. Moon and J. S. Yu, Sci. Rep., 2015, 5, 10296 CrossRef CAS PubMed.
- J. Y. Tsao, M. E. Coltrin, M. H. Crawford and J. A. Simmons, Proc. IEEE, 2010, 98, 1162–1179 Search PubMed.
- M. Hatori, C. Gronfier, R. N. Van Gelder, P. S. Bernstein, J. Carreras, S. Panda, F. Marks, D. Sliney, C. E. Hunt, T. Hirota, T. Furukawa and K. Tsubota, npj Aging Mech. Dis., 2017, 3, 9 CrossRef PubMed.
- T. A. LeGates, D. C. Fernandez and S. Hattar, Nat. Rev. Neurosci., 2014, 15, 443–454 CrossRef CAS PubMed.
- D. M. Berson, F. A. Dunn and M. Takao, Science, 2002, 295, 1070–1073 CrossRef CAS PubMed.
- F. Vienot, M. L. Durand and E. Mahler, J. Mod. Opt., 2009, 56, 1433–1446 CrossRef.
- K. M. Zielinska-Dabkowska, Nature, 2018, 553, 274–276 CrossRef CAS PubMed.
- E. L. Zelinski, S. H. Deibel and R. J. McDonald, Neurosci. Biobehav. Rev., 2014, 40, 80–101 CrossRef PubMed.
- C. La Morgia, F. N. Ross-Cisneros, A. A. Sadun and V. Carelli, Front. Neurol., 2017, 8, 1–8 Search PubMed.
- U. S. Department of Energy, U. S. Department of Energy, 2012, DOE/PI-0009.
- C. L. Ho and W. Y. Wong, Top. Curr. Chem., 2016, 374 Search PubMed.
- A. F. Henwood and E. Zysman-Colman, Top. Curr. Chem., 2016, 374, 5 CrossRef PubMed.
- G. M. Farinola and R. Ragni, Chem. Soc. Rev., 2011, 40, 3467–3482 RSC.
- C. Cebrian and M. Mauro, Beilstein J. Org. Chem., 2018, 14, 1459–1481 CrossRef CAS PubMed.
- M.-C. Tang, A. K.-W. Chan, M.-Y. Chan and V. W.-W. Yam, Top. Curr. Chem., 2016, 374, 1–43 CrossRef CAS PubMed.
- L. Murphy and J. A. G. Williams, Top. Organomet. Chem., 2010, 28, 75–111 CrossRef CAS.
- B. W. D'Andrade and S. R. Forrest, Adv. Mater., 2004, 16, 1585–1595 CrossRef.
- T. Fleetham, J. Ecton, Z. Wang, N. Bakken and J. H. Li, Adv. Mater., 2013, 25, 2573–2576 CrossRef CAS PubMed.
- T. Fleetham, L. Huang and J. Li, Adv. Funct. Mater., 2014, 24, 6066–6073 CrossRef CAS.
- E. L. Williams, K. Haavisto, J. Li and G. E. Jabbour, Adv. Mater., 2007, 19, 197–202 CrossRef CAS.
- X. H. Yang, Z. X. Wang, S. Madakuni, J. Li and G. E. Jabbour, Adv. Mater., 2008, 20, 2405–2409 CrossRef CAS.
- G. Li, T. Fleetham and J. Li, Adv. Mater., 2014, 26, 2931–2936 CrossRef CAS PubMed.
- G. Cheng, P.-K. Chow, S. C. F. Kui, C.-C. Kwok and C.-M. Che, Adv. Mater., 2013, 25, 6765–6770 CrossRef CAS PubMed.
- S. Fuertes, H. Garcia, M. Peralvarez, W. Hertog, J. Carreras and V. Sicilia, Chem. – Eur. J., 2015, 21, 1620–1631 CrossRef CAS PubMed.
- S. Fuertes, A. J. Chueca, M. Perálvarez, P. Borja, M. Torrell, J. Carreras and V. Sicilia, ACS Appl. Mater. Interfaces, 2016, 8, 16160–16169 CrossRef CAS PubMed.
- S. Fuertes, A. J. Chueca, L. Arnal, A. Martín, U. Giovanella, C. Botta and V. Sicilia, Inorg. Chem., 2017, 56, 4829–4839 CrossRef CAS PubMed.
- P. E. Garrou, Chem. Rev., 1981, 81, 229–266 CrossRef CAS.
- L. Maidich, G. Zuri, S. Stoccoro, M. A. Cinellu and A. Zucca, Dalton Trans., 2014, 43, 14806–14815 RSC.
- S. Fuertes, A. J. Chueca and V. Sicilia, Inorg. Chem., 2015, 54, 9885–9895 CrossRef CAS PubMed.
- J. A. G. Williams, Top. Curr. Chem., 2007, 281, 205–268 CrossRef CAS.
- Z. M. Hudson, C. Sun, M. G. Helander, Y. L. Chang, Z. H. Lu and S. N. Wang, J. Am. Chem. Soc., 2012, 134, 13930–13933 CrossRef CAS PubMed.
- Y. Unger, D. Meyer, O. Molt, C. Schildknecht, I. Münster, G. Wagenblast and T. Strassner, Angew. Chem., Int. Ed., 2010, 49, 10214–10216 CrossRef CAS PubMed.
- T. Fleetham, Z. Wang and J. Li, Org. Electron., 2012, 13, 1430–1435 CrossRef CAS.
- X.-C. Hang, T. Fleetham, E. Turner, J. Brooks and J. Li, Angew. Chem., Int. Ed., 2013, 52, 6753–6756 CrossRef CAS PubMed.
- K. Hayashi, H. Nakanotani, M. Inoue, K. Yoshida, O. Mikhnenko, T.-Q. Nguyen and C. Adachi, Appl. Phys. Lett., 2015, 106, 093301 CrossRef.
- N. C. Giebink and S. R. Forrest, Phys. Rev. B: Condens. Matter Mater. Phys., 2008, 77, 235215 CrossRef.
- J. Fornies, V. Sicilia, P. Borja, J. M. Casas, A. Diez, E. Lalinde, C. Larraz, A. Martin and M. T. Moreno, Chem – Asian J., 2012, 7, 2813–2823 CrossRef CAS PubMed.
- T. W. Murphy, J. Appl. Phys., 2012, 111, 104909 CrossRef.
- A. Zabiliute, R. Vaicekauskas, P. Vitta and A. Zukauskas, Opt. Lett., 2014, 39, 563–566 CrossRef CAS PubMed.
- A. C78.374-2015, Light-Emitting Diode Package Specification Sheet for General Illumination Applications.
- L. Y. Wang, E. H. Song, Y. Y. Zhou, T. T. Deng, S. Ye and Q. Y. Zhang, J. Mater. Chem. C, 2018, 6, 8670–8678 RSC.
- W. L. Zhou, M. H. Fang, S. X. Lian and R. S. Liu, ACS Appl. Mater. Interfaces, 2018, 10, 17508–17511 CrossRef CAS PubMed.
- C. F. Lai, J. S. Li and C. W. Shen, ACS Appl. Mater. Interfaces, 2017, 9, 4851–4859 CrossRef CAS PubMed.
- W. J. Zhou, M. Gu, Y. Y. Ou, C. H. Zhang, X. J. Zhang, L. Zhou and H. B. Liang, Inorg. Chem., 2017, 56, 7433–7442 CrossRef CAS PubMed.
- H. M. Zhu, C. C. Lin, W. Q. Luo, S. T. Shu, Z. G. Liu, Y. S. Liu, J. T. Kong, E. Ma, Y. G. Cao, R. S. Liu and X. Y. Chen, Nat. Commun., 2014, 5, 4312 CrossRef CAS PubMed.
Footnote |
| † Electronic supplementary information (ESI) available: General information about procedures and instrumentation, X-ray structure determinations, computational methods, preparation of the PMMA films, LEDs performance and remote phosphor devices’ preparation. CCDC 1885174–1885178. For ESI and crystallographic data in CIF or other electronic format see DOI: 10.1039/c9tc00747d |
| This journal is © The Royal Society of Chemistry 2019 |

