Two new magnetic hollandites A1.5Ru6.1Cr1.9O16 (A = Sr, Ba): magnetoresistance and thermopower
Florent
Pawula
 ,
Sylvie
Hébert
 *,
Denis
Pelloquin
and
Antoine
Maignan
Normandie Univ, ENSICAEN, UNICAEN, CNRS, CRISMAT, 14000 Caen, France. E-mail: sylvie.hebert@ensicaen.fr
First published on 6th December 2018
Abstract
The magnetic and transport properties of two hollandites, Sr1.5Ru6.1Cr1.9O16 and Ba1.5Ru6.1Cr1.9O16, crystallizing in the I4/m space group, have been investigated. The structural study shows a lack of cation ordering, and the mixed Cr and Ru occupation in the edge shared MO6 octahedra is responsible for magnetic and electrical transport properties dominated by the localized nature of the carriers, in clear contrast with the metallic and Pauli magnetism observed in ruthenium hollandites. In particular, a complex magnetic behavior together with a cluster-glass behavior and semi-conducting resistivity are observed. Interestingly, both compounds exhibit negative magneto-resistance, reaching −18.6% at 5 K and 9 T in Ba1.5Ru6.1Cr1.9O16, and −4% in Sr1.5Ru6.1Cr1.9O16. This magneto-resistance is directly associated with the variable-range hopping nature of transport and hence with the existence of localized carriers induced by the Cr for Ru substitution. In contrast, the thermopower at high temperature shows a behavior dominated by the Ru cation network, with S ∼ 30 μV K−1, consistent with those measured for other ruthenates such as SrRuO3 and CaCu3Ru4O12 quadruple perovskites, or in the KRu4O8 hollandite. The comparison of these two hollandites with the KRu4O8 hollandite enables a direct investigation of the impact of localization on the thermopower in these materials.
Introduction
Among oxides, the attractivity of the hollandite structure, made of ribbons of edge shared octahedra, is related to its channels formed by the connected ribbons, which can host cations or even water molecules. These features lead to original properties, with potential applications in the field of electrodes,1,2 nuclear waste storage,3,4 photocatalysis5,6 or even multiferroicity.7Many hollandites of the AxM8O16 chemical formula (A = Ba, Sr, Pb, Cs, K, Na, Rb; M = Mo, Cr, Ru, Rh, V, Mn, Ti) have been reported (see ref. 1–18 and references therein). Their electronic and magnetic properties are very sensitive to the oxidation state of the transition metal cation, to the content and position of the An+ cation, and to a possible disorder and modulation effect induced by the position of the A cation in the channel.19,20 Also, the magnetism in the case of localized carriers depends on a complex interplay between the different magnetic exchange constants (direct exchange or super-exchange) within the ribbons or between the ribbons,21,22 which can generate a spin glass behavior,22 as in α-K0.15MnO2.23
Depending on the nature of the transition metal cation inside the channels, complex orbital and magnetic orderings can be generated, as nicely exemplified in K2Cr8O16, where an intriguing ferromagnetic and insulating state is observed together with a metal to insulator transition in this ferromagnetic state at 95 K, decoupled from the paramagnetic to ferromagnetic transition taking place at 180 K.8 These features have been explained considering a structural distortion24,25 and a possible ‘spin Peierls’ mechanism.9
For Ru hollandites, BaRu6O12 has been investigated in detail, as a model system for 1D transport phenomena. It was found that the metallic behavior is replaced by a more localized behavior with a magnetic field, attributed to a possible quantum phase transition, very sensitive to disorder.18,26 KRu4O8 presents a metallic behavior, a positive magnetoresistance, with a quasi-one dimensional nature of transport,27,28 confirmed by LDA+U calculations.29 The Seebeck coefficient exhibits a dip at low T, associated with the low dimensional nature of transport. It is nevertheless dominated at high temperature by the entropy of localized carriers,27 even if the resistivity exhibits a metallic behavior. The value of S is very close to the one observed at high temperatures in other metallic ruthenates (perovskites and quadruple perovskites)30,31 suggesting a dominant role of the spin entropy in these metallic ruthenates.
A mixed cation occupancy in the ribbons has been reported for the mixed Cr/Ru hollandite Ba0.65Ru2.7Cr1.3O8.32 Localization phenomena could be induced by the Cr substitution, and this hollandite is thus an interesting material to investigate the relative influence of the transport and entropy terms on the Seebeck coefficient. Here, we report on the synthesis of A1.5Ru6.1Cr1.9O16 mixed hollandites with A = Ba2+ or Sr2+ inside the channels. In addition to the disorder and localization effect, created by the mixed occupation at the Ru site, the A ionic radius decreases from from the Ba2+ to the Sr2+ cation, enabling us to investigate the role of the unit cell volume in the transport and magnetic properties. The main goal is to understand the localization influence, concomitantly with the size effect of A, on the magnetism and transport properties and more specifically on the Seebeck coefficient, in this hollandite structure.
Experimental
Polycrystalline samples of nominal Ba1.33Ru5.33Cr2.67O16 and Sr1.33Ru5.33Cr2.67O16 compositions were synthesized by a solid-state reaction. Stoichiometric amounts of SrO (or BaO): Cr2O3: RuO2 were ground in an agate mortar before being pressed into a bar shape. The bars were set in alumina crucibles which were introduced into silica tubes. After sealing under a primary vacuum, these ampoules were heated at 1050 °C for 12 h. The X-ray diffraction patterns were recorded at room temperature using a standard powder diffractometer X'PERT Pro PANalytical (Philips) with Co Kα radiation in θ–2θ mode.Diffraction patterns were refined by the Rietveld method with the Fullprof software implemented in the WinPlotr package.33 The purity of the samples and their chemical homogeneity have been probed by TEM techniques. This work has been jointly performed with a JEOL ARM200 cold FEG double corrected microscope and a JEOL 2010 LaB6 equipped with a Nanomegas Digistar precession module. The two microscopes are equipped with an EDX analyser. To analyze these experimental HRTEM/STEM images, some simulated images have been calculated with the JEMS software.34
Magnetic properties were measured using either a 5T SQUID magnetometer (Quantum Design) or the AC Measurement System (ACMS) option of a 14T Physical Properties Measurement System (PPMS, Quantum Design) from 5 K to 350 K. Electrical resistivity was measured with the four probe method with copper wires and indium contacts using the transport option of a 9T PPMS from 5 K to 400 K. Thermoelectric properties were studied using either a homemade apparatus (steady state technique) with indium contacts or the Thermal Transport Option (TTO) with silver epoxy contacts, both options being used in a PPMS. High temperature Seebeck coefficient and resistivity data were collected with a Seebeck Coefficient/Electrical Resistance Measuring System (ZEM-3, ULVAC) from 325 K to 800 K.
Results and discussion
Structural analyses
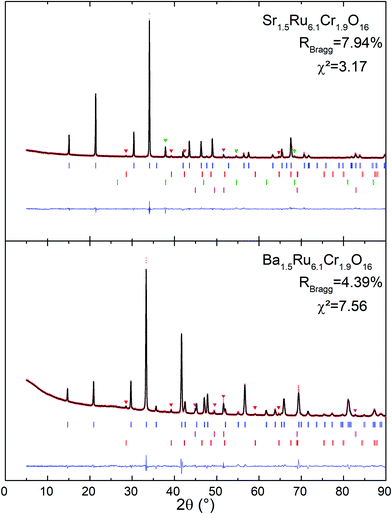
The X-ray powder diffraction patterns of both samples (Fig. 1) fit well with a tetragonal cell (9.8 × 9.8 × 3 Å3) and the centro-symmetric space group I4/m, commonly found in hollandite-type structures to describe the octahedral framework, while some low intensity peaks remain unindexed. This structural filiation has been confirmed by the STEM study in ADF mode as illustrated by the [001] oriented image shown in Fig. 2a. The chemical analyses of both hollandites by EDX measurements coupled to (S)TEM lead to the following cation contents Sr1.4(1)Ru6.1(6)Cr1.8(2) and Ba1.5(1)Ru6.1(6)Cr1.9(2), assuming the AxM8O16 hollandite formula. For the Ba based sample, a complementary electron diffraction (ED) study was performed in precession electron tomography mode (PEDT). The latter allows one to build the actual lattice and validate the primitive I-type tetragonal cell (9.8 × 9.8 × 3 Å3) without superstructures corresponding to the previously reported tripling of the c axis in Ba0.65Ru2.7Cr1.3O8.23 Similar conclusions are drawn for the Sr based sample for which no clear monoclinic distortion is detected. However, for both samples, ED patterns reveal also diffuse lines along the c* direction (Fig. 2b). The latter, often reported in hollandites, are usually associated with a modulated occupation of A species inside the channels.35 Accordingly, complementary analyses, considering a modulation wave vector, have been performed from PEDT data. Considering the formalism applied by Carter and Withers36 based on an incommensurate I4/m octahedral network and I4/m Ba sub-structure, a modulated contribution q* = 0.787b* + 0.097c* is found in the case of the Ba based hollandite. Applying this rule, we deduce a barium content x = 2*(bprimitive-subcell/bBa-subcell) = 2* 0.787∼1.57 consistent with EDX results. This combined ED and EDS study has also allowed us to detect and identify a few impurities in small amounts, Cr2O3 at about 5% being the most abundant one, with SrRuO3 and Ru being less than <1%. This observation is consistent with the presence of extra peaks in the powder X-ray diffraction patterns. Finally, structural Rietveld refinements were performed by using the average I4/m (9.8× 9.8 × 3 Å3) model isostructural to K2Cr8O1637 which does not take into account the diffuse lines. Fixing the oxygen occupancy to 16, the structural Rietveld refinements lead to the Sr1.54(1)Ru6.10(11)Cr1.90(11)O16 and Ba1.45(1)Ru6.13(12)Cr1.87(12)O16 chemical compositions. Considering the errors in the EDX techniques, and the closeness of the refined and analyzed compositions, the following approximated formulas are considered: Sr1.5Ru6.1Cr1.9O16 and Ba1.5Ru6.1Cr1.9O16.The results of all the structural data are summarized in Tables 1 and 2. As expected regarding cation size, for A = Ba, a larger unit cell parameter is observed coming from an anisotropic change of the unit cell parameters, with a and b parameters increasing by approximately +0.2 Å, and the c parameter remaining almost unchanged (+0.001 Å). This is reflected by the evolution of the M–M bond lengths: along c, M–M is only slightly increased (+0.021 Å), while the other M–M bond lengths increase by about +0.143 Å. In Table 2 and Fig. 2, one can see that the two M–O(1) bond lengths are more impacted than the others. Angles are also modified; one of the two M–O(1)–M angles = 104.0° for Sr1.5Ru6.1Cr1.9O16 decreases to 100.1° for Ba1.5Ru6.1Cr1.9O16 and one of the two M–O(2)–M increases from 86.9° to 92.1°. This indicates that the structure becomes more regular in Ba1.5Ru6.1Cr1.9O16, as that angle tends towards 90° as shown in Fig. 2d, where the projection of the channels is presented.
| Sr | Ba | Sr | Ba | Sr | Ba | Sr | Ba | |
|---|---|---|---|---|---|---|---|---|
| x | y | z | Occ. | |||||
| A | 0 | 0 | 0 | 0 | 1.54(1) | 1.45(1) | ||
| Cr | 0.1547(2) | 0.1577(3) | 0.6734(2) | 0.6612(3) | 0 | 0 | 1.90(11) | 1.87(12) |
| Ru | 0.1547(2) | 0.1577(3) | 0.6734(2) | 0.6612(3) | 0 | 0 | 6.10(11) | 6.13(12) |
| O1 | 0.0501(7) | 0.032(1) | 0.3363(5) | 0.3313(8) | 0 | 0 | 8 | 8 |
| O2 | 0.3228(8) | 0.308(1) | 0.3510(8) | 0.3568(8) | 0 | 0 | 8 | 8 |
| Cell parameters | Sr1.5Ru6.1Cr1.9O16 | Ba1.5Ru6.1Cr1.9O16 |
|---|---|---|
| a (Å) | 9.6593(2) | 9.87504(5) |
| b (Å) | 9.6593(2) | 9.87504(5) |
| c (Å) | 3.0588(2) | 3.06085(3) |
| V (Å3) | 285.39 | 298.48 |
| Ba1.5Ru6.1Cr1.9O16 | Sr1.5Ru6.1Cr1.9O16 | |
|---|---|---|
| A–O(2) × 8 | 2.815(8) | 2.664(6) |
| M–O(1) | 1.87(1) | 1.980(7) |
| M–O(1) × 2 | 1.997(5) | 1.940(3) |
| M–O(2) | 1.99(1) | 1.984(8) |
| M–O(2) × 2 | 2.116(6) | 2.108(5) |
| M–M | 2.958(4) | 2.815(2) |
| M–M | 3.0609(0) | 3.0588(2) |
| M–O(1)–M | 100.1(2) | 104.0(2) |
| M–O(1)–M × 2 | 129.6(4) | 128.0(3) |
| M–O(2)–M | 92.6(3) | 93.1(3) |
| M–O(2)–M × 2 | 92.1(3) | 86.9(3) |
| O(1)–M–O(1) | 94.6(6) | 90.9(4) |
| O(1)–M–O(2) | 84.5(6) | 88.0(4) |
| O(1)–M–O(2) | 176.2(5) | 178.4(7) |
| O(1)–M–O(2) | 83.6(5) | 81.5(4) |
| O(2)–M–O(2) | 87.9(6) | 93.1(5) |
Magnetic and transport properties
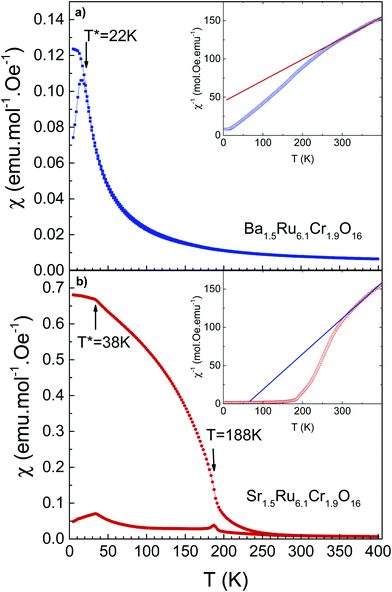
The temperature-dependent magnetic susceptibilities of both hollandites measured in a field of 100 Oe are shown in Fig. 3. The values of the magnetic susceptibility are much larger (typically by a factor of 1000) than the ones observed in the ruthenium hollandites, in which Pauli magnetism is observed.26,27 In Ba1.5Ru6.1Cr1.9O16, the χ(T) curve is characteristic of a spin-glass like behavior, with a cusp on the ZFC curve at 22 K. The ZFC susceptibility is smaller in Sr1.5Ru6.1Cr1.9O16, with a separation between ZFC and FC curves observed below ∼250 K, a transition at 188 K, and a cusp at ∼38 K.The χ−1(T) curves are presented in the inset of Fig. 3a and b. The analysis of the linear part measured at high T leads to a Curie–Weiss temperature of −142 K and 21 K respectively. This suggests a possible increase of ferromagnetic interactions in Sr1.5Ru6.1Cr1.9O16. This Curie–Weiss analysis must be taken with caution as a deviation from linearity is clearly observed below 300 K, which might be attributed to the low dimensional structure of these hollandites and to the presence of a small amount of the Cr2O3 impurity (TN ∼ 308 K). This prevents the extraction of the effective moments.
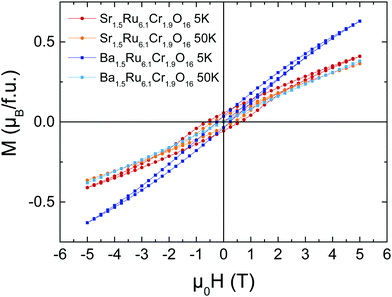
The M(H) loops are presented in Fig. 4. At high magnetic fields, the behaviors are close, with magnetic moments reaching 0.63 μB/f.u. and 0.41 μB/f.u. respectively for Ba1.5Ru6.1Cr1.9O16 and Sr1.5Ru6.1Cr1.9O16 in 5 T at 5 K. The coercive field is larger in Sr1.5Ru6.1Cr1.9O16, with μ0Hc = 0.6 T at 5 K instead of 0.2 T for Ba1.5Ru6.1Cr1.9O16. The moments measured at high fields are very small, when compared to the possible saturation values of 18 μB/f.u. considering Cr3+ 3d3 t2g3 and Ru4+ 4d4 t2g4, showing that, even if ferromagnetic interactions are reinforced in the Sr-hollandite, the magnetization loops with the small values of the moment and the existence of a coercive field are consistent with a canted antiferromagnetic state. It is interesting to note that the high T transition observed at ∼188 K in Sr1.5Ru6.1Cr1.9O16 is very close to the ferromagnetic transition observed in K2Cr8O16.8 Considering the formal valence state of 3.625 for the (Cr/Ru) site, and considering that Cr and Ru cations present a mixed valency between 3 and 4 in the pure Ru or pure Cr hollandites, we assume that Cr and Ru valencies are also between 3 and 4. The similar transition temperatures observed at ∼180 K could thus come from the dominant influence of ferromagnetic Cr–Cr local interactions in this Cr/Ru mixed hollandite.8,9
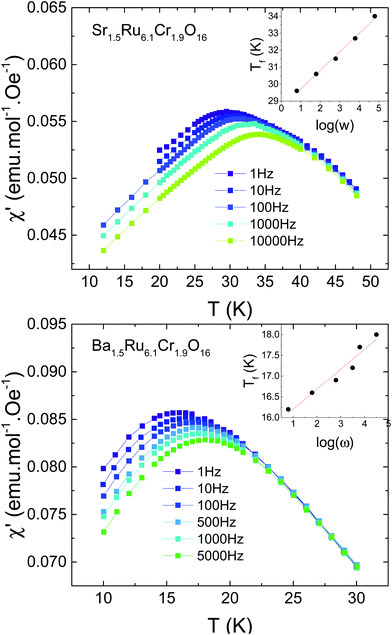
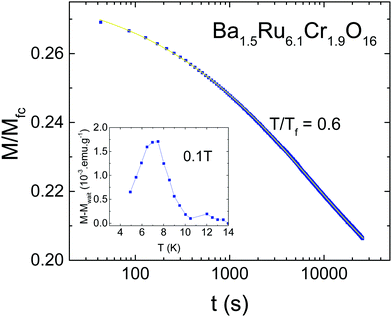
Due to the observation of cusps in the susceptibility (Fig. 3), the possible existence of a spin glass has been investigated. Fig. 5 shows the AC susceptibility of both samples measured for frequencies ranging from 1 Hz to 10 kHz. For both samples, spin dynamic effects are evidenced, with a dependence of the susceptibility on the measuring frequency. The effect is slightly more pronounced in Sr1.5Ru6.1Cr1.9O16 than in Ba1.5Ru6.1Cr1.9O16, and the obtained values of δf = ΔTf/TfΔ(ln(ω)) are 0.037(2) and 0.033(4) respectively, being typical of the cluster-glass range 0.03–0.06.38 This confirms the existence of cluster-glass behavior for both samples, with slightly larger magnetic clusters in Sr1.5Ru6.1Cr1.9O16. Due to the value of the coercive field reaching ∼0.2 to 0.6 T, the AC susceptibility has also been measured under 0.5 T, and the frequency dependence remains the same. Magnetization relaxation effects exist also in both samples as exemplified in Fig. 6 in the case of Ba1.5Ru6.1Cr1.9O16. The measurement of magnetization has been performed after having cooled the sample under 100 Oe, and waiting for tw = 100 min before switching off the magnetic field. The magnetization decreases as a function of time with a logarithmic dependence following M/Mfc= a + b*exp[−(t/τp)1−n], with a = 0.1882(2), b = 0.0919(3), τp = 7950(49)s and n = 0.593(2). The inset of Fig. 6 presents the evidence for aging phenomena in these hollandites. The ZFC curves for Ba1.5Ru6.1Cr1.9O16 have been recorded in a field of 1000 Oe, directly after cooling or after introducing a waiting time of two hours at 7.5 K. The difference between these two ZFC curves (M–Mwait) shows a maximum at 7.5 K, as expected for spin- or cluster glasses.38
To summarize, the magnetic properties of these hollandites are interpreted as a cluster-glass behavior due to the presence of magnetic clusters in the structure, induced by nearly 25% Cr in the octahedral sites. The formation of ferromagnetic clusters induced by frustration has already been reported in other hollandites such as V7.22O8(OH)8Cl0.77(H3O)2.34.39 As described in ref. 21 and 22, the existence of a spin glass stems from complex competition between at least three terms of magnetic exchanges. The sensitivity of this glassy state is well reflected here by the two quite distinct behaviors between a paramagnetic transition to a cluster-glass for Ba1.5Ru6.1Cr1.9O16, and a paramagnetic transition to a possible ordered state towards a cluster-glass for Sr1.5Ru6.1Cr1.9O16. In K2Cr8O16, at least three coupling constants J are necessary to describe the magnetic behavior,9J1 for the coupling within the ribbons forming the channel, J2 for the coupling between the ribbons and J3 along the channels. J2 is reported to be twice greater than J1,9 highlighting the dominant role of the Cr–Cr inter-ribbon distance on the magnetism, this distance being modified depending on the A cation size. Applying this statement to Cr/Ru hollandites, one can see that the ferromagnetic coupling should be weaker in Ba1.5Ru6.1Cr1.9O16 compared to Sr1.5Ru6.1Cr1.9O16, as the M–M distance related to inter-chain coupling is 0.15 Å larger in Ba1.5Ru6.1Cr1.9O16 than in Sr1.5Ru6.1Cr1.9O16, the other distances remaining almost unchanged. This is consistent with the observation of a larger Curie–Weiss temperature. The dilution of Cr interactions by the Ru network nevertheless prevents the establishment of long-range order ferromagnetism.
The electrical resistivity shows a localized behavior, with dρ/dT < 0 (Fig. 7), and ρ values remaining small, close to 0.01–2 Ω cm in the whole T range from 5 K to 700 K. This localized behavior is completely different from the metallic resistivity observed in BaRu6O1226 or KRu4O8,27 with ρ ∼ 0.2 mΩ cm and 0.1 mΩ cm at 300 K in the most conducting direction, i.e. along the ribbons, and a residual resistivity ratio RRR close to ∼2.6–11.3 or 96 respectively. Within the mixed Cr/Ru hollandites, the resistivities are larger at low T in Ba1.5Ru6.1Cr1.9O16 than in Sr1.5Ru6.1Cr1.9O16, i.e. in the hollandite presenting a single magnetic transition at 22 K to a cluster glass. At high temperatures, above 200 K, the two curves merge together with a resistivity value tending to 18 mΩ cm at 700 K.
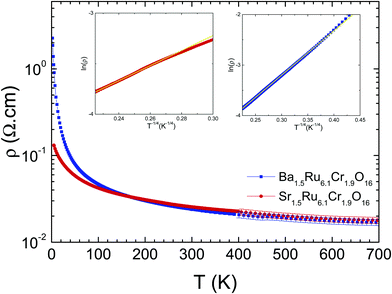 | ||
| Fig. 7 Temperature-dependent resistivities of Ba1.5Ru6.1Cr1.9O16 (blue) and Sr1.5Ru6.1Cr1.9O16 (red). In insets, VRH plots of Ba1.5Ru6.1Cr1.9O16 and Sr1.5Ru6.1Cr1.9O16. | ||
In Ba1.5Ru6.1Cr1.9O16, the resistivity can be fitted between 400 K and 40 K using a 3D variable range hopping model (VRH) ρ(T) ∼ ρ0 exp(T0/T)1/4, with T0 = 6000 K as shown in the inset, consistent with a disorder dominated behavior down to ∼40 K, close to 2T*. In Sr1.5Ru6.1Cr1.9O16, the data can also be fitted with a VRH model but in a much smaller temperature range, only above ∼190 K, with T0 = 3160 K. In the two hollandites, the increase of magnetic interactions when T approaches T* in Ba1.5Ru6.1Cr1.9O16 or the higher transition temperature in the case Sr1.5Ru6.1Cr1.9O16 modifies the VRH regime.
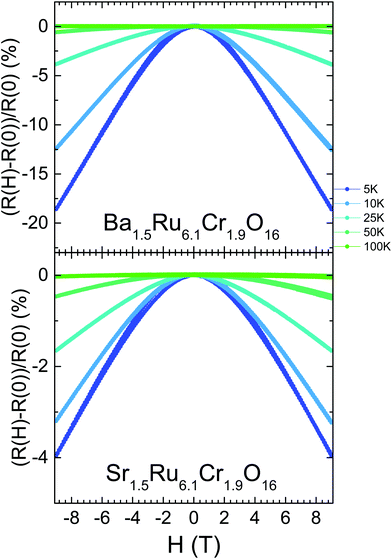
For the two hollandites, the magnetic transitions have no impact on these ρ(T) curves. However, as the temperature decreases and ρ(T) departs from the VRH regime, the resistivity becomes strongly dependent on the magnetic field. As shown in Fig. 8 and in contrast to Ba1.33Ru8O16,26 a negative magnetoresistance is observed in both hollandites at low temperature, with a large value of −18.6% obtained in Ba1.5Ru6.1Cr1.9O16 at 5 K and 9 T. However, the MR values are smaller in the more conducting Sr1.5Ru6.1Cr1.9O16, reaching only −4.0% at 5 K and 9 T. The large and negative values of MR observed at low temperature are rather unique among hollandites and strongly differ from the positive MR observed in the metallic KRu4O8.40
In Fig. 9, the Seebeck coefficient S values measured up to 765 K are presented. Increasing the temperature, Ba1.5Ru6.1Cr1.9O16 and Sr1.5Ru6.1Cr1.9O16S curves present a dip at 47 K and 64 K respectively, a non-linearity (see next paragraph) and a sign change at 137 K and 259 K respectively. As expected, they are smaller for the most conducting material, with, for example, 12 μV K−1 for Ba1.5Ru6.1Cr1.9O16 and 2 μV K−1 for Sr1.5Ru6.1Cr1.9O16 at 300 K. They both reach similar values of ∼29 ± 1.5 μV K−1 at 765 K. In the case of ruthenates, similar values have already been observed in perovskites or quadruple perovskites,30,31 and have been explained as follows in Sr2RuO4.41 In the high temperature limit, assuming a Ru4+ (d4) and taking into account the degrees of freedom of Ru3+, Ru4+ and Ru5+, it has been shown that the thermopower can be written as S = (kB/2e)ln[D(d3)/D(d5)] = (kB/2e)ln(2) ≈ 30 μV K−1, where the degeneracy is D(dn) = 2Sn + 1 with the spin Sn = 1/2, 1, and 3/2 for d5, d4, and d3. Therefore, the S high temperature values close to 30 μV K−1 of both hollandites suggest that the thermopower measured here mostly reflects the Ru network. Comparing these results with the thermopower of KRu4O8 (plotted as hollow symbols) is very instructive: for this metallic hollandite, S tends also to a similar value at high T, close to 32 μV K−1. This confirms that the Cr network has only a minor role in the thermopower at high temperature (T > 500 K).
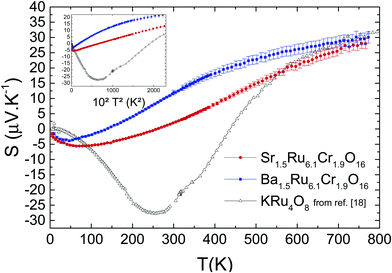 | ||
| Fig. 9 Temperature-dependent Seebeck coefficient of both samples, and comparison with the data for KRu4O8 (from ref. 27). Inset shows the T2-dependency. | ||
Furthermore, for the three hollandites, a dip of S is observed at low T,27 with the T of the dip shifted to smaller temperatures as localization phenomena increase (i.e., the dip temperature is the smallest for Ba1.5Ru6.1Cr1.9O16). Also, a T2 dependence of the thermopower is observed in a large range of T (125 K < T < 370 K) for Sr1.5Ru6.1Cr1.9O16 and a smaller one (75 K < T < 185 K) for Ba1.5Ru6.1Cr1.9O16, as shown in the inset of Fig. 9. A similar T2 behavior was observed in KRu4O8, but at much lower temperature, below the minimum of S. For the KRu4O8 metallic hollandite, the dip, the sign change and the divergence from T-linearity were attributed to the one dimensional nature of these hollandites.42 To further analyze this transport coefficient, detailed calculations of the band structure of these hollandites are necessary. The main finding of the study still is that very similar thermopower trends are obtained in metallic and semi-conducting hollandites, with a dip, a sign change and the same saturation value at high T. The major difference is that, due to disorder and localization, the dip is shifted to smaller temperatures (47 K and 64 K in the present study compared to ∼250 K for KRu4O8): the ‘metallic’ regime observed in KRu4O8 being suppressed in these mixed hollandites, the entropy term dominates from lower temperatures. Moreover, as the localization is reinforced (from Sr to Ba), the transport term disappears more rapidly, favoring a steeper increase of S in the case of Ba1.5Ru6.1Cr1.9O16.
Concluding remarks
The introduction of Cr in a metallic Ru hollandite leads to drastic modifications of the transport and magnetic properties. A Pauli susceptibility and metallic behavior are reported in BaRu6O1226 and in KRu4O8,27 but with Cr/Ru mixed occupation at the M site, the susceptibility and resistivity data are strongly modified due to the presence of localized carriers, inducing a cluster-glass behavior and variable range hopping resistivity. As discussed in hollandites,22 the complex magnetic exchange pathways stemming from the crystallographic structure lead to a glassy behavior for the magnetization with relaxation effects. The comparison between Sr1.5Ru6.1Cr1.9O16 and Ba1.5Ru6.1Cr1.9O16 structures shows that the modification within the channel plane of the a and b parameters (by +0.2 Å from Sr1.5Ru6.1Cr1.9O16 to Ba1.5Ru6.1Cr1.9O16) has a drastic influence on the magnetic and consequently transport properties, as the associated inter-ribbon distance increases by +0.15 Å in Ba1.5Ru6.1Cr1.9O16. The disorder in the [MO6]2 double ribbons created by the mixed occupation is believed to be responsible for the negative magnetoresistance properties observed in the cluster glass regime.The thermopower values are very close to those usually observed in ruthenates at high temperature suggesting the dominance of the Ru spin degrees of freedom even in the presence of 25% Cr. The values are rather small for compounds characterized by localized carriers, showing that this transport coefficient is dominated by the contribution of Ru orbitals at the Fermi level. Compared to the previously reported metallic KRu4O8, the Seebeck coefficient values are different at low temperature but similar at high temperature. This comparison of both Ru/Cr hollandites with KRu4O8 shows that localization tends to suppress the dip, as |Sdip| of the former hollandites is much smaller than |Sdip| of the metallic KRu4O8, and that the high temperature value is more rapidly reached in the case of the more localized Ba1.5Ru6.1Cr1.9O16 hollandite, due to the reduction of the transport term.
Conflicts of interest
There are no conflicts to declare.Acknowledgements
The authors thank Dr Wataru Kobayashi (Tsukuba University) for the thermopower data of KRu4O8 (data from ref. 27). The authors are grateful to X. Larose and Dr S. Gascoin for the technical support with TEM and X-ray diffraction analysis respectively and F. Veillon for the assistance with susceptibility and transport measurements.References
- L. D. Noailles, C. S. Johnson, J. T. Vaughey and M. M. Thackeray, J. Power Sources, 1999, 81–82, 259 CrossRef CAS.
- N. Kumagai, T. Sasaki, S. Oshitari and S. Komaba, J. New Mater. Electrochem. Syst., 2006, 9, 175 CAS.
- M. L. Carter, A. L. Gillen, K. Olufson and E. R. Vance, J. Am. Ceram. Soc., 2009, 92(5), 1112 CrossRef CAS.
- Y. Wen, Y. Xu, K. S. Brinkman and L. Shuller-Nickles, Sci. Rep., 2018, 8, 5003 CrossRef PubMed.
- T. Mori, J. Suzuki, K. Fujimoto and M. Watanabe, J. Mater. Synth. Process., 1998, 6(5), 329 CrossRef CAS.
- S. R. Krishna, P. Shrujana, S. Palla, K. Sreenu, R. Velchuri and M. Vithal, Mater. Res. Express, 2015, 2, 035008 CrossRef.
- S. Liu, A. R. Akbashev, X. Yang, X. Liu, W. Li, L. Zhao, X. Li, A. Couzis, M.-G. Han, Y. Zhu, L. Krusin-Elbaum, J. Li, L. Huang, S. J. L. Billinge, J. E. Spanier and S. O’Brien, Sci. Rep., 2015, 4, 6203 CrossRef PubMed.
- K. Hasegawa, M. Isobe, T. Yamauchi, H. Ueda, J.-I. Yamaura, H. Gotou, T. Yagi, H. Sato and Y. Ueda, Phys. Rev. Lett., 2009, 103, 146403 CrossRef PubMed.
- T. Toriyama, A. Nakao, Y. Yamaki, H. Nakao, Y. Murakami, K. Hasegawa, M. Isobe, Y. Ueda, A. V. Ushakov, D. I. Khomskii, S. V. Streltsov, T. Konishi and Y. Ohta, Phys. Rev. Lett., 2012, 107, 266402 CrossRef PubMed.
- A. Nakao, Y. Yamaki, H. Nakao, Y. Murakami, K. Hasegawa, M. Isobe and Y. Ueda, J. Phys. Soc. Jpn., 2012, 81, 054710 CrossRef.
- L. A. Bursill and J. Smith, J. Solid State Chem., 1987, 69, 343 CrossRef CAS.
- P. Tumurogoti, S. K. Sundaram and S. T. Misture, J. Solid State Chem., 2018, 258, 72 CrossRef.
- R. Murata, T. Sato, T. Okuda, Y. Horibe, H. Tsukasaki, S. Mori, N. Yamaguchi, K. Sugimoto, S. Kawaguchi, M. Takata and T. Katsufuji, Phys. Rev. B: Condens. Matter Mater. Phys., 2015, 92, 220408 CrossRef.
- T. Waki, Physica B, 2003, 329, 938 CrossRef.
- J. R. Plaisier, A. A. C. van Vliet and D. J. W. Ijdo, J. Alloys Compd., 2001, 314, 56 CrossRef CAS.
- T. Ozawa, I. Suzuki. and H. Sato, J. Phys. Soc. Jpn., 2006, 75, 014802 CrossRef.
- L. C. Nistor, G. van Tendeloo and S. Amelinckx, J. Solid State Chem., 1994, 109, 152 CrossRef CAS.
- C. C. Torardi, Mater. Res. Bull., 1985, 20, 705 CrossRef CAS.
- M. Isobe, S. Koishi, N. Kouno, J.-I. Yamaura, T. Yamauchi, H. Ueda, H. Gotou, T. Yagi and Y. Ueda, J. Phys. Soc. Jpn., 2006, 75, 073801 CrossRef.
- O. I. Lebedev, S. Hébert, V. Roddatis, C. Martin, S. Turner, A. V. Krasheninnikov, Y. Grin and A. Maignan, Chem. Mater., 2017, 29, 5558 CrossRef CAS.
- A. M. Larson, P. Moetakef, K. Gaskell, C. M. Brown, G. King and E. E. Rodriguez, Chem. Mater., 2015, 27, 515 CrossRef CAS.
- Y. Crespo, A. Andreanov and N. Seriani, Phys. Rev. B: Condens. Matter Mater. Phys., 2013, 88, 014202 CrossRef.
- T. Barudžija, V. Kusigerski, N. Cvjetićanin, S. Šorgić, M. Perović and M. Mitrić, J. Alloys Compd., 2016, 665, 261–270 CrossRef.
- P. Mahadevan, A. Kumar, D. Choudhury and D. D. Sarma, Phys. Rev. Lett., 2010, 104, 256401 CrossRef PubMed.
- P. A. Bhobe, A. Kumar, M. Taguchi, R. Eguchi, M. Matsunami, Y. Takata, A. K. Nandy, P. Mahadevan, D. D. Sarma, A. Neroni, E. Şaşıoğlu, M. Ležaić, M. Oura, Y. Senba, H. Ohashi, K. Ishizaka, M. Okawa, S. Shin, K. Tamasaku, Y. Kohmura, M. Yabashi, T. Ishikawa, K. Hasegawa, M. Isobe, Y. Ueda and A. Chainani, Phys. Rev. X, 2015, 5, 041004 Search PubMed.
- Z. Q. Mao, T. He, M. M. Rosario, K. D. Nelson, D. Okuno, B. Ueland, I. G. Deac, P. Schieffer, Y. Liu and R. J. Cava, Phys. Rev. Lett., 2003, 90, 186601 CrossRef CAS PubMed.
- W. Kobayashi, Phys. Rev. B: Condens. Matter Mater. Phys., 2009, 79, 155116 CrossRef.
- A. Pautrat and W. Kobayashi, Phys. Rev. B: Condens. Matter Mater. Phys., 2010, 82, 115113 CrossRef.
- T. Toriyama, M. Watanabe, T. Konishi and Y. Ohta, Phys. Rev. B: Condens. Matter Mater. Phys., 2011, 83, 195111 CrossRef.
- Y. Klein, S. Hébert, A. Maignan, S. Kolesnik, T. Maxwell and B. Dabrowski, Phys. Rev. B: Condens. Matter Mater. Phys., 2006, 73, 052412 CrossRef.
- S. Hébert, R. Daou and A. Maignan, Phys. Rev. B: Condens. Matter Mater. Phys., 2015, 91, 045106 CrossRef.
- M. C. Cadee and A. Prodan, Mater. Res. Bull., 1979, 14, 613 CrossRef CAS.
- T. Roisnel and J. Rodriguez-Carvajal, Mater. Sci. Forum, 2001, 378, 118 Search PubMed.
- P. A. Stadelmann, Ultramicroscopy, 1987, 21, 131 CrossRef CAS.
- H. W. Zandbergen, P. L. A. Everstijin, F. C. Mijlhoff, G. H. Renes and D. J. W. Ijdo, Mater. Res. Bull., 1987, 22, 431 CrossRef CAS.
- M. Carter and R. Withers, J. Solid State Chem., 2005, 178, 1903–1914 CrossRef CAS.
- O. Tamada, N. Yamamoto, T. Mori and T. Endo, J. Solid State Chem., 1996, 126(1) DOI:10.1006/jssc.1996.0301.
- J. A. Mydosh, Spin Glasses – An Experimental Introduction, Taylor & Francis, 1993 Search PubMed.
- N. A. Chernova, J. K. Ngala, P. Y. Zavalij and M. S. Whittingham, Phys. Rev. B: Condens. Matter Mater. Phys., 2007, 75, 014402 CrossRef.
- A. Pautrat and W. Kobayashi, Europhys. Lett., 2012, 97, 67003 CrossRef.
- J. Mravlje and A. Georges, Phys. Rev. Lett., 2016, 117, 036401 CrossRef PubMed.
- M. Zemljic and P. Prelovsek, Phys. Rev. B: Condens. Matter Mater. Phys., 2005, 71, 085110 CrossRef.
| This journal is © The Royal Society of Chemistry 2019 |

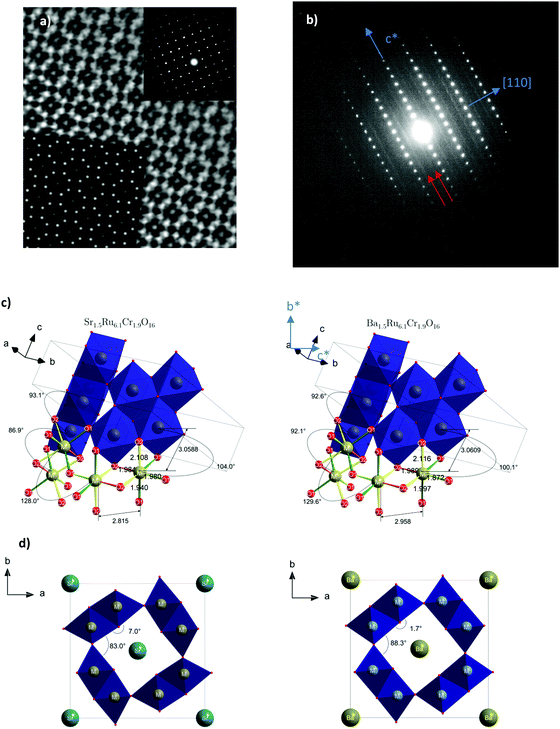
![[1 with combining macron]](https://www.rsc.org/images/entities/char_0031_0304.gif) 0] oriented ED pattern. Diffuse lines are indicated with red arrows. Both pictures have been recorded for Sr1.5Cr1.9Ru6.1O16. (c) Characteristic distances and angles of both compounds. (d) Angular distortion of the channel of Sr1.5Ru6.1Cr1.9O16 (left) and Ba1.5Ru6.1 Cr1.9O16 (right).
0] oriented ED pattern. Diffuse lines are indicated with red arrows. Both pictures have been recorded for Sr1.5Cr1.9Ru6.1O16. (c) Characteristic distances and angles of both compounds. (d) Angular distortion of the channel of Sr1.5Ru6.1Cr1.9O16 (left) and Ba1.5Ru6.1 Cr1.9O16 (right).