
 Open Access Article
 This Open Access Article is licensed under a Creative Commons Attribution-Non Commercial 3.0 Unported Licence
Glutathione from recovered glucose as ingredient in antioxidant nanocapsules for triggered flavor delivery†
Claudia
Tallian
 a,
Vanessa
Rumpler
a,
Lukas
Skopek
b,
Hannes
Russmayer
c,
Matthias G.
Steiger
bc,
Robert
Vielnascher
ab,
Simone
Weinberger
a,
Alessandro
Pellis
d,
Sara
Vecchiato
*b and
Georg M.
Guebitz
ab
a,
Vanessa
Rumpler
a,
Lukas
Skopek
b,
Hannes
Russmayer
c,
Matthias G.
Steiger
bc,
Robert
Vielnascher
ab,
Simone
Weinberger
a,
Alessandro
Pellis
d,
Sara
Vecchiato
*b and
Georg M.
Guebitz
ab
aUniversity of Natural Resources and Life Sciences, Vienna (BOKU), Institute for Environmental Biotechnology, Department for Agrobiotechnology (IFA-Tulln), Konrad-Lorenz-Strasse 20, 3430 Tulln an der Donau, Austria
bAustrian Centre of Industrial Biotechnology, Konrad-Lorenz-Strasse 20, 3430 Tulln an der Donau, Austria. E-mail: sara.vecchiato@acib.at
cUniversity of Natural Resources and Life Sciences, Department of Biotechnology, Muthgasse 18, 1190 Vienna, Austria
dUniversity of York, Department of Chemistry, Green Chemistry Centre of Excellence, Heslington, York Y010 5DD, UK
First published on 5th June 2019
Abstract
Side streams from modern lignocellulose biorefineries have found value-added applications in various industries ranging from food to medical. Here, bioproduction of glutathione from glucose recovered from man-made cellulose fiber production was investigated. Rayon fibers were enzymatically hydrolyzed and the resulting glucose and Zn in the hydrolysate were successfully used for glutathione (15.5 mg L−1) production by an engineered strain of Saccharomyces cerevisiae. Next, out of reduced glutathione (GSH) in combination with human serum albumin (HSA) and silk fibroin (SF), nanocapsules were developed. Production of HSA/SF/GSH nanocapsules was further optimized by experimental design and the resulting nanocapsules were characterized by particle size, zeta potential, chemical properties (secondary structure ratios, crosslinking, and release kinetics) and thermal stability. An average hydrodynamic radius of 462.72 ± 73.36 nm and average zeta potential of −13.67 ± 0.01 mV were obtained by optimization using an experimental design approach. Increasing secondary structure ratios for HSA/SF/GSH nanocapsules indicated the successful integration of GSH into the nanocapsule shell by ultrasound induced self-assembly. Regarding possible future application as a cosmeceutical, flavor substances were encapsulated, and the release kinetics of flavor substances were studied, resulting in pH- and viscosity-dependent maximum release rates of 40.45 ± 0.35% for menthol and 38.60 ± 2.07% for raspberry ketone. Additionally, the radical scavenging properties of the system were evaluated, showing increased scavenging for produced HSA/SF/GSH nanocapsules compared to controls. Therefore, HSA/SF/GSH nanocapsules are seen as a promising new system in cosmeceutical approaches.
Introduction
Side streams from modern lignocellulose biorefineries have found applications in various areas, ranging from food to medical. For example, the hemicellulose (i.e. xylan) fraction resulting from rayon manufacturing is converted to xylitol (e.g. DuPont/Lenzing AG (Austria)).1 Xylitol is then used in the food and cosmetic sectors, e.g. as artificial bulk sweetener in chewing gums or toothpastes inhibiting salivary bacterial growth (caries-inhibitor).2,3 In a similar approach, monolithic tetracycline-containing cellulose acetate fibers based on recovered cellulose, possibly in future originating from rayon, have already been used for controlled delivery in periodontal therapy.4,5In the last decade, estimated total world-wide fiber consumption was 102 million metric tons.6 Of these, man-made cellulosic (MMC) fibers account for more than 10 million metric tons, with an average annual growth of more than 2%. In fact, rayon is considered a future substitute for cotton materials, due to the arable land and water demand problems related to cotton production. Therefore, rayon production is expected to grow by 9.1% until 2020.6–9 However, pre- and post-consumer waste MMC fibers are usually landfilled10 or chemically degraded using highly concentrated chemicals such as sulfuric acid.
Recently, complete recovery of glucose from rayon fibers using cellulase enzymes was demonstrated.11 In turn, glucose could serve as a carbon source in bioproduction of value-added biomolecules with possible applications in the food or medical sector, which is the focus of this study.12,13
Glutathione (γ-L-glutamyl-L-cysteinylglycine, GSH) is a natural tripeptide which is generally commercially produced by fermentation of the yeast Saccharomyces cerevisiae. GHS is increasingly used in medicine, the food and cosmetic industries due to its antioxidative properties, i.e. radical scavenging. Consequently, world-wide annual production exceeded 200 tons,14 making both efficient production systems and cheap growth substrates important for economical processes. In fact, the commercial sector of cosmetics and cosmeceuticals is currently rapidly growing. Cosmeceuticals are defined as cosmetic products based on biologically active substances.15 In general, modern systems are based on stimuli-responsive delivery of active ingredients,16,17 where various parameters, such as temperature, ionic strength or pH, can be used as triggers.18 Human serum albumin (HSA) and silk fibroin (SF), naturally derived from the cocoons of Bombyx mori, have been reported to show required properties for targeted delivery, such as water solubility, thermal stability (for HSA)19 and natural pH response.20 Tallian et al.21 successfully combined these properties with the development of HSA/SF nanocapsules for targeted delivery at lysosomal pH of 4.5 for the treatment of inflammations.
In the present study, GSH produced from glucose recovered from MMC rayon fibers (Rf) was combined with HSA and SF for production of nanocapsules with antioxidative properties. These properties suggest a possible new approach for gingivitis and periodontitis treatment support, as a significantly lowered pH (down to 5)22 can be targeted as stimulus for release of flavour substances such as menthol or raspberry ketone. Encapsulation properties of flavour substances and their effect on the pH-responsive release behaviour in different artificial salivas were also investigated to simulate possible application for gingivitis and periodontitis treatment.
Results and discussion
Enzymatic hydrolysis of rayon fibers and glutathione production
Various components contained in side-streams of lignocellulose processing have found value-added applications. One example is xylitol produced from vegetable waste, rice straw or corncob using Candida sp.23 and then used in chewing gums as a softener24 and for salivary bacterial inhibition.25 Similarly, residues from rayon production can provide a source of glucose after enzymatic hydrolysis and additionally contain the Zn required in glutathione production.In this study, the enzyme cocktail Cellic CTec3 was used to hydrolyse rayon fibers. With an enzyme loading of 5 kFPU per g, 30 g of rayon fibers were completely hydrolysed, yielding a concentration of 90 g L−1 of glucose. The recovered glucose solution contained some Zn (15.5 mg L−1) from rayon fiber production. It is well known that zinc is essential in small concentrations as a redox cofactor and structural component of proteins. In fact, zinc is estimated to be necessary for the functions of nearly 3% of the S. cerevisiae proteome. Although zinc is not redox active under physiological conditions, excess zinc can be toxic to cells.26,27
Hence, in this study, a control of commercial glucose and 15.5 mg L−1 ZnSO4 supplement was analysed to observe possible beneficial or toxic effects of the zinc in glutathione production. No significant difference in growth of S. cerevisiae based on OD600 was found when recovered glucose was used as carbon source compared to the two controls containing pure glucose and pure glucose plus Zn. After 24 h of incubation, the OD600 was slightly higher for the control without the zinc, which changed, however, after 48 h of fermentation when an OD600 between 25 and 28 was reached (Fig. 1A). These data showed no toxic effect of Zn; rather, a slight biomass concentration (OD600) was found after 48 h, probably due to the role of Zn as redox cofactor.
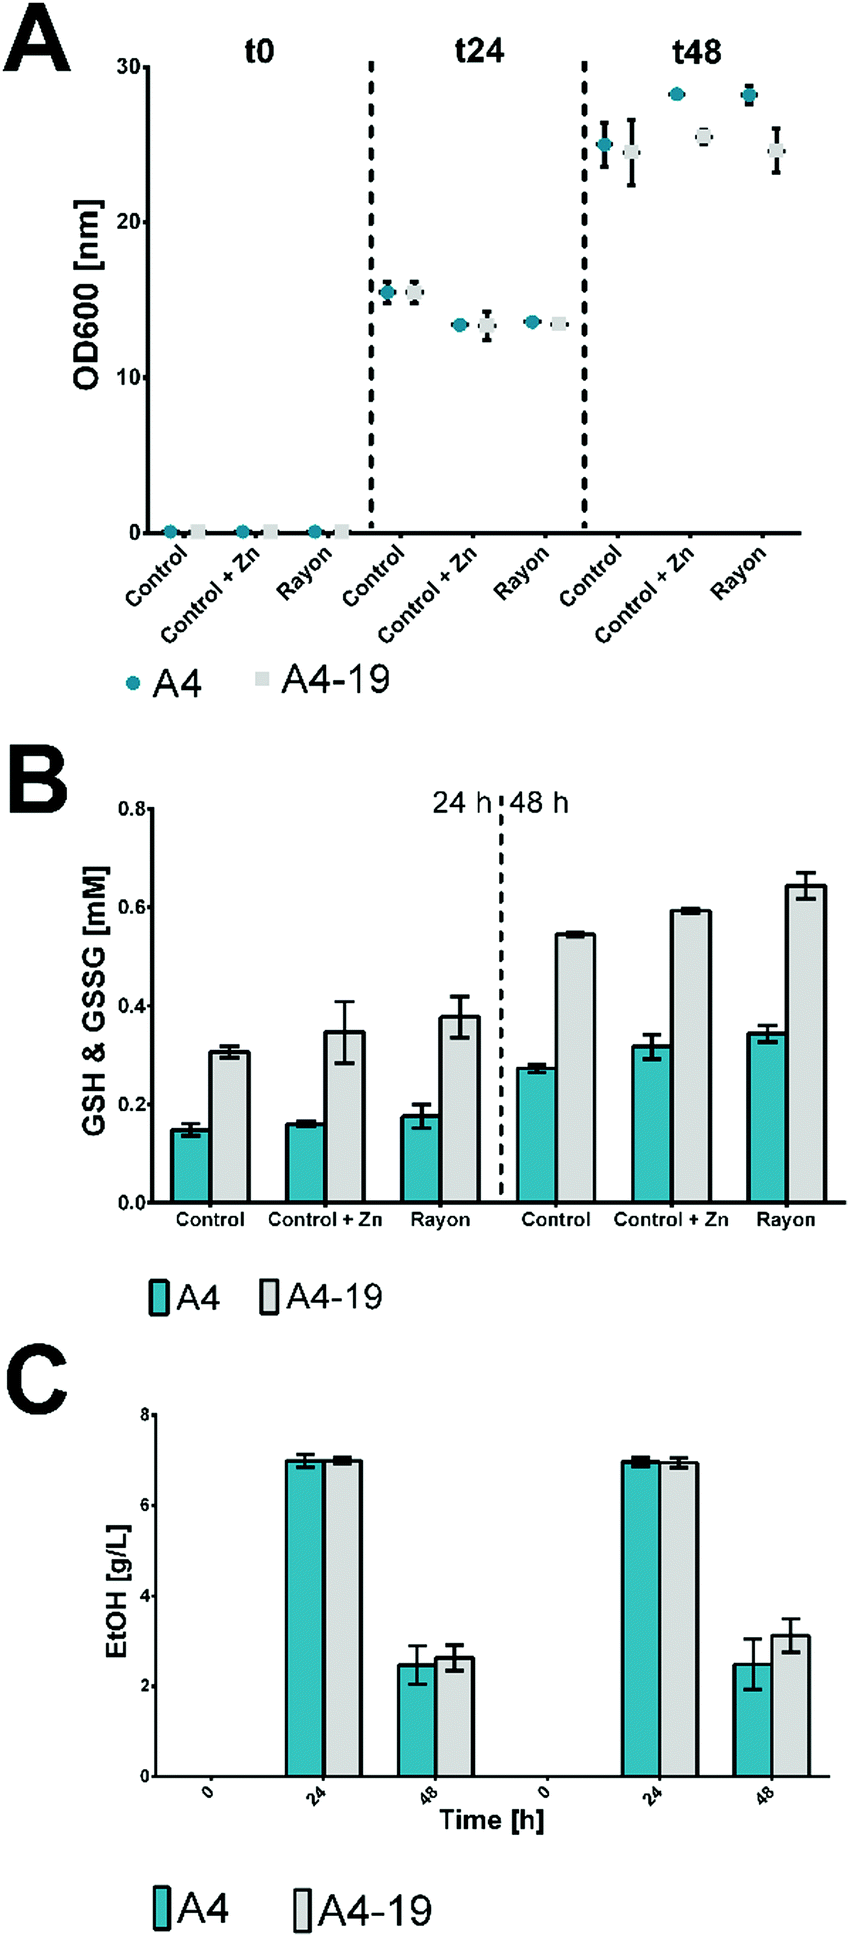 | ||
| Fig. 1 (A) Growth of S. cerevisiae (A4 and A4–19 strains) using glucose enzymatically recovered from rayon fibers (rayon), commercial glucose (control) and commercial glucose supplemented with ZnSO4 (control + Zn) as carbon sources. All experiments were performed in duplicate. (B) Glutathione production in the reduced (GSH) and oxidized (GSSG) form by S. cerevisiae (A4 and A4–19 strains) when grown on glucose enzymatically recovered from rayon fibers (rayon), on commercial glucose (control) and commercial glucose supplemented with ZnSO4 (control + Zn) as carbon sources. All experiments were performed in duplicate. (C) Ethanol production by S. cerevisiae when grown on glucose enzymatically recovered from rayon fibers (rayon), on commercial glucose (control) and commercial glucose with ZnSO4 supplement (control + Zn) as carbon sources. All experiments were performed in duplicate. | ||
Glucose consumption was similar regardless whether pure or recovered glucose was used as the substrate. From a starting concentration of 20 g L−1 (t0), the glucose was almost completely consumed after 24 h in all the performed experiments. The levels of reduced (GSH) and oxidized (GSSG) glutathione were measured for the two strains of S. cerevisiae used. Regarding the sum of the reduced and oxidized forms, for both strains, a slightly higher level of glutathione was detected in the samples with the zinc supplement. In this case, the zinc level is not high enough to show a toxic effect but rather supports the S. cerevisiae metabolism for glutathione production.27 A 0.34 mM concentration for strain A4 and a 0.64 mM concentration for strain A4–19 were reached after 48 h (Fig. 1B).
As previously reported,11S. cerevisiae can be applied for production of 2nd generation biofuels as substitutes for conventional petroleum and natural gases. The ethanol production was investigated and a level of 7 g L−1 was detected for both strains after 24 h of fermentation (Fig. 1C). The ethanol level was drastically reduced after 48 h due to evaporation from the fermentation flasks through evaporation or fermentation by S. cerevisiae.
Optimization of HSA/SF/GSH nanocapsules production by DoE
Next, incorporation of GSH into nanocapsules was investigated. Ultrasound assisted production of HSA/SF/GSH nanocapsules was optimized based on a production method published by Tallian et al.21 for stimuli responsive HSA/SF nanocapsules. A randomized full factorial design with 3 centre points was evaluated regarding particle size and zeta potential (ESI,† Fig. S1) to determine the influence of the tested factors on these responses. Herein, response values of zeta potential analysis ranged between −11.08 and −13.78 mV and hydrodynamic nanocapsule radii ranged from 419.20 to 664.01 nm. Both models showed a strong positive linear correlation (ESI,† Fig. S1A), with R2 = 0.99 for zeta potential (ZP) and R2 = 0.93 for hydrodynamic nanocapsule radius (radius), and a good prediction fulfilling the condition ΔR2 − Q2 < 0.2–0.3 (0.07 for ZP; 0.26 for radius). To describe the relationships of the investigated variables, obtained measurement data (Table S4, ESI†) were further fitted by multiple linear regression analysis and the fit of the model was evaluated by ANOVA tests (ESI,† Table S6). For both responses, statistical significance of the models with a confidence level of 95% (p-value < 0.05) was achieved. Additionally, the model lack of fit evaluation, comparing the model error to replicate error with a significance level of 5% (p-value > 0.05) was evaluated, resulting in statistical significance for both models. F-tests were used in combination with p-values to evaluate the coefficient's significance (ESI,† Table S6). Scaled and centred coefficients are displayed in Fig. S1C (ESI†), showing that the predominant interaction in the developed model for zeta potential is that between PRO(Yes) × PUR (protein addition × number of purification steps). This interaction has a significant negative effect on the zeta potential as well as the hydrodynamic radius.Based on these results, a second DoE (DoE 2) was designed, where the protein addition of HSA and SF for capsule formation was kept constant at 4.2 mg as indicated above in materials and methods. This was hypothesized to lead to the desired size of HSA/SF/GSH nanocapsules with low zeta potential. For possible future applications in cosmeceutical approaches, such as a radical scavenging toothpaste additive, sizes below 500 nm (hydrodynamic radius) were attempted. Here, in contrast to i.v. applications where particle sizes are focused between 100 to 300 nm,28,29 radical properties corresponding with sufficient release behaviours are seen as the key properties of the designed system. As the number of purification steps (PUR) showed a significant positive effect on zeta potential and no significant effect on nanocapsule size, the factor range was narrowed from 1–10 to 1–5 purification steps.
In DoE 2, the relationship between the factors GLU (concentration GSH in mg mL−1) and PUR (number of purification steps) was evaluated by multiple regression analysis, from which quadratic models for both responses, zeta potential (ZP) and hydrodynamic nanocapsule radius (radius), based on the experimental data (Fig. 2 and ESI,† Table S5) were obtained (eqn (1) and (2)).
| ZP = −2.05435 + 0.00139869x1 − 0.0003910171x2 + 0.00279421x12 + 0.00156146x22 | (1) |
| ZP = 540.467 + 108.024x1 + 68.1175x2 + 53.315x1x2 + 3.17916x12 − 139.31822 | (2) |
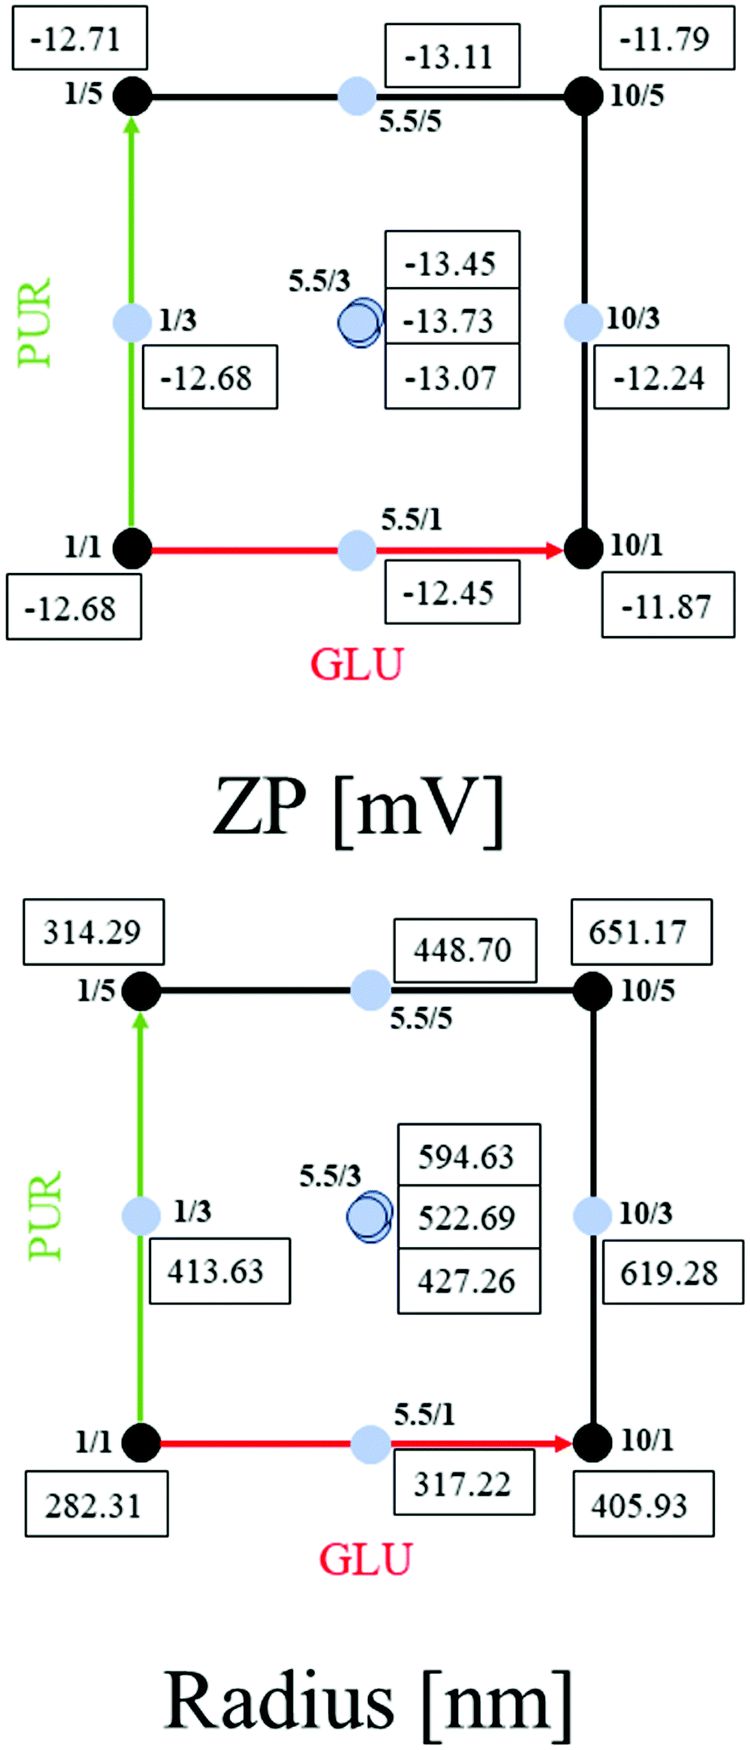 | ||
| Fig. 2 Optimization of HSA/SF/GSH nanocapsules regarding zeta potential and hydrodynamic radius. Two-dimensional representation of the results of the central composite face-centered design (CCF; DoE 2), where the numbers in the quadratic space represent the obtained zeta potential (ZP) values in mV or the obtained hydrodynamic radii (radius) in nm for different combinations of the factors GLU (concentration of GSH) and PUR (number of purification steps). | ||
As reported in Fig. 2, zeta potential values between −11.79 to −13.79 mV were obtained with hydrodynamic radii between 282.31 and 651.17 nm and similar strong linear correlations when compared to DoE 1, with R2 = 0.85 for ZP and R2 = 0.97 for Radius. ANOVA evaluations resulted in statistical significance for both models with p-values < 0.05 (confidence interval of 95%), as shown in Table S7 (ESI†). Q2 values and obtained model validity values for both responses indicate that the obtained models are well fitted and suitable for prediction (Fig. 3).
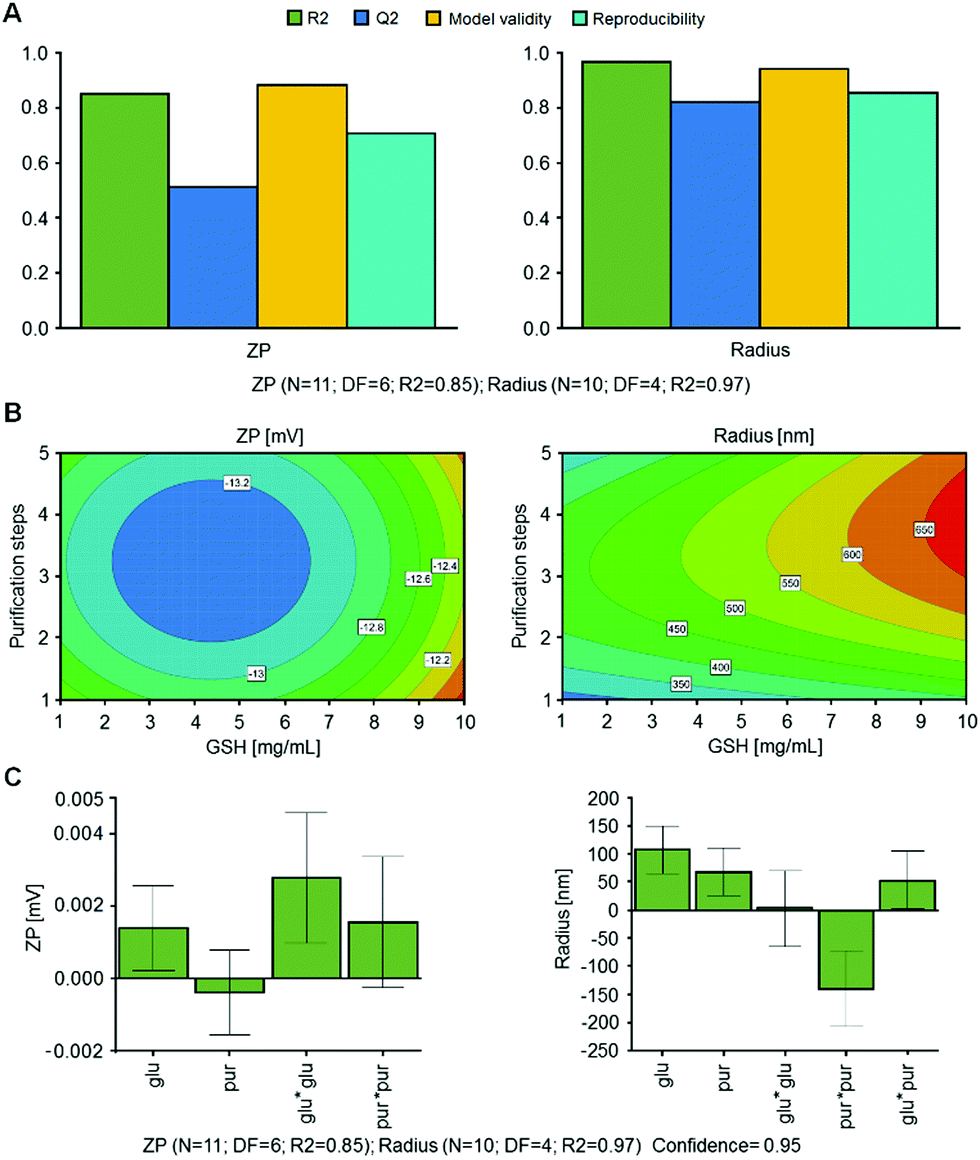 | ||
| Fig. 3 Optimization (RSM) of ultrasound assisted monodisperse HSA/SF/GSH nanocapsule production via design of experiments (CCF, quadratic model). (A) Summary of fit plots for zeta potential (ZP, left) in mV and hydrodynamic particle radius (radius, right) in nm, including R2 (goodness of fit), Q2 (goodness of prediction), the model validity and the reproducibility based on three center points, where N indicates the number of experiments and DF refers to degrees of freedom. Model was fitted with MLR. (B) Response contour plots for zeta potential (ZP, left) in mV and hydrodynamic particle radius (radius, right) in nm with constant protein addition (yes). (C) Extended coefficients plots of scaled and centered coefficients for zeta potential (ZP, left) in mV and hydrodynamic particle radius (radius, right) in nm, including significant 2 factor interactions, whereby R2 refers to goodness of fit, N indicates the number of experiments and DF refers to degrees of freedom. Coefficient plots were calculated using a confidence interval of 95%. | ||
Scaled and centered coefficients were plotted in Fig. 3C to visualize the effects of independent factors on the ZP and Radius responses. Here, the coefficients are half of the factor effects. In the ZP model, the interaction GLU × PUR was removed to improve R2 and Q2.
Regarding the quadratic interactions, GLU × GLU is significant; however, the non-significant interaction of PUR × PUR and the non-significant factor PUR were included in the model, as both coefficients were significant for the second model. In a further step, the most robust setpoint was evaluated using MODDE, where hydrodynamic radius and zeta potential were minimized. As result, 1.8 mg mL−1 of GSH and 4.6 purification steps were obtained. Therefore, optimized HSA/SF/GSH nanocapsule production was set accordingly using 5 purification steps; a zeta potential of −12.95 mV and hydrodynamic radius of 407.74 nm were predicted. These predictions correlate with the visually evaluated response contour plots shown in Fig. 3B.
Furthermore, the successful incorporation of GSH in the nanocapsule shells was tested during the complete optimization process using an indirect HPLC-ELSD based approach. GSH concentrations in the washing waters collected during particle production were determined. This was done to ensure that the changes in zeta potential and radius were solely based on the modifications made in the corresponding DoEs. For all samples tested, GSH concentration in the analysed washing waters was under the limit of detection, indicating that the complete amount of GSH was successfully incorporated in the HSA/SF/GSH nanocapsule shells.
Characterization of optimized HSA/SF/GSH nanocapsules
Based on the prediction results of DoE 2, optimized HSA/SF/GSH, as well as HSA and HSA/SF nanocapsules as controls, were produced, purified and characterized by their physical and chemical properties. Microscopic analyses were performed to investigate shape-related differences between the controls and the optimized HSA/SF/GSH nanocapsules (Fig. 4).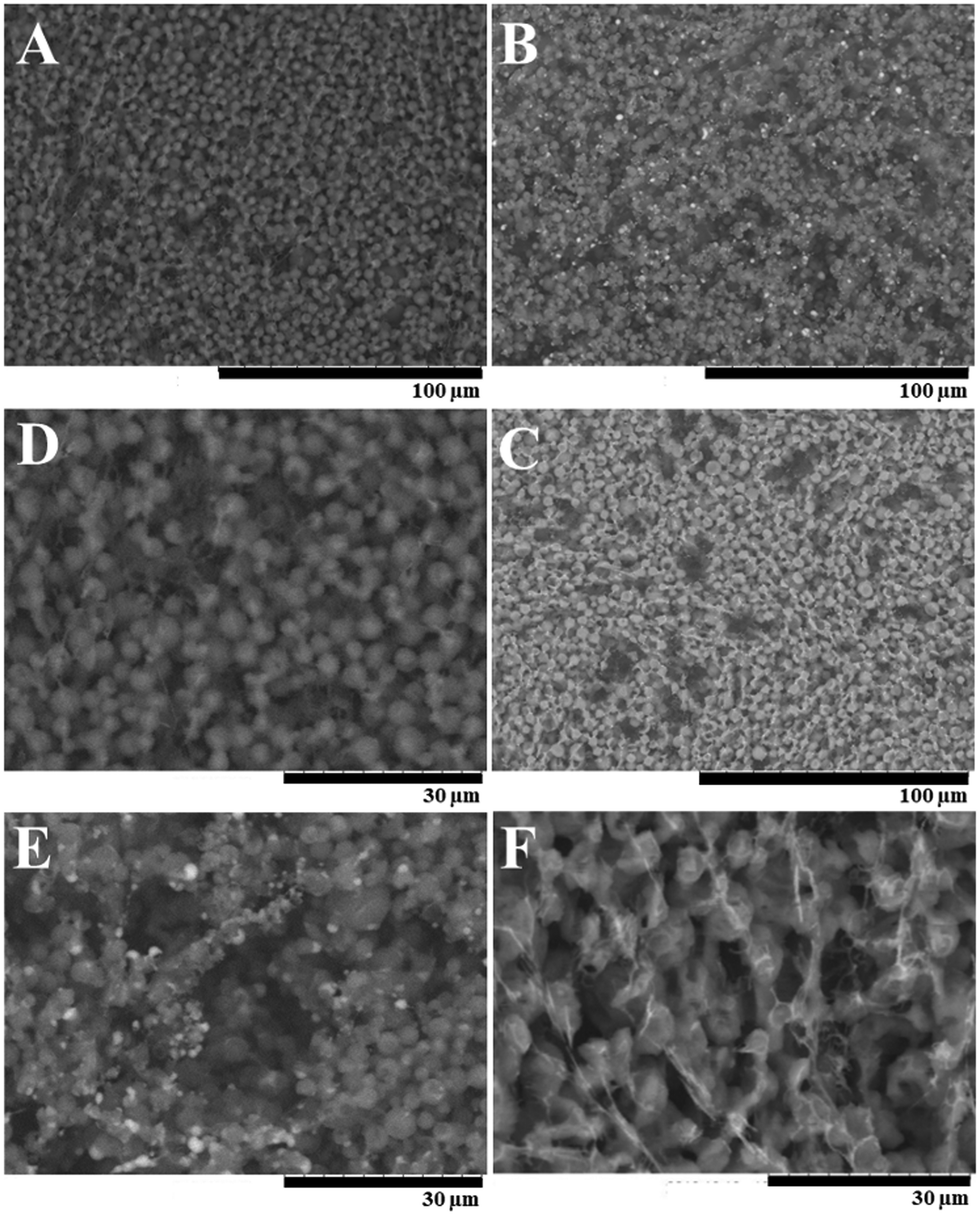 | ||
| Fig. 4 Scanning electron microscopy images of (A) HSA nanocapsules, (B) HSA/SF nanocapsules and (C) HSA/SF/GSH nanocapsules at 1000× magnification and (D) HSA nanocapsules, (E) HSA/SF nanocapsules and (F) HSA/SF/GSH nanocapsules at 2500× magnification obtained with a SEM equipped with a cryo chamber at −20 °C. | ||
As indicated in Fig. 4, HSA/SF/GSH nanocapsules showed a slightly bigger particle size compared to the controls; however, it was apparent that the high energy per sample surface area due to the magnification (2500×) was affecting sample stability during the analysis. This effect resulted in visible black holes caused by nanocapsule disruption due to the electron beam. For confirmation of the differences in particle size and verification of the optimum settings for HSA/SF/GSH nanocapsules, DLS analysis was performed to investigate the average hydrodynamic radius of the monodisperse phase of each sample (Fig. 5A). HSA/SF nanocpasules showed the smallest average hydrodynamic radius (339.20 ± 43.19 nm), followed by HSA (390.70 ± 34.42 nm) and HSA/SF/GSH nanocapsules (462.72 ± 73.36 nm). Hence, particle sizes of all three samples were not significantly different and the predicted particle size at optimum production settings (407.74 nm) of DoE 2 was confirmed. These results correlate with previously published data by Tallian et al.,21 where hydrodynamic particle radii of HSA/SF nanocpasules containing 50% SF ranged between 339 and 507 nm. Additionally, the obtained hydrodynamic radii for HSA/SF/GSH nanocpasules fullfiled the criteria set in regard to possible future applications in cosmeceuticals, with sizes below 500 nm in radius.
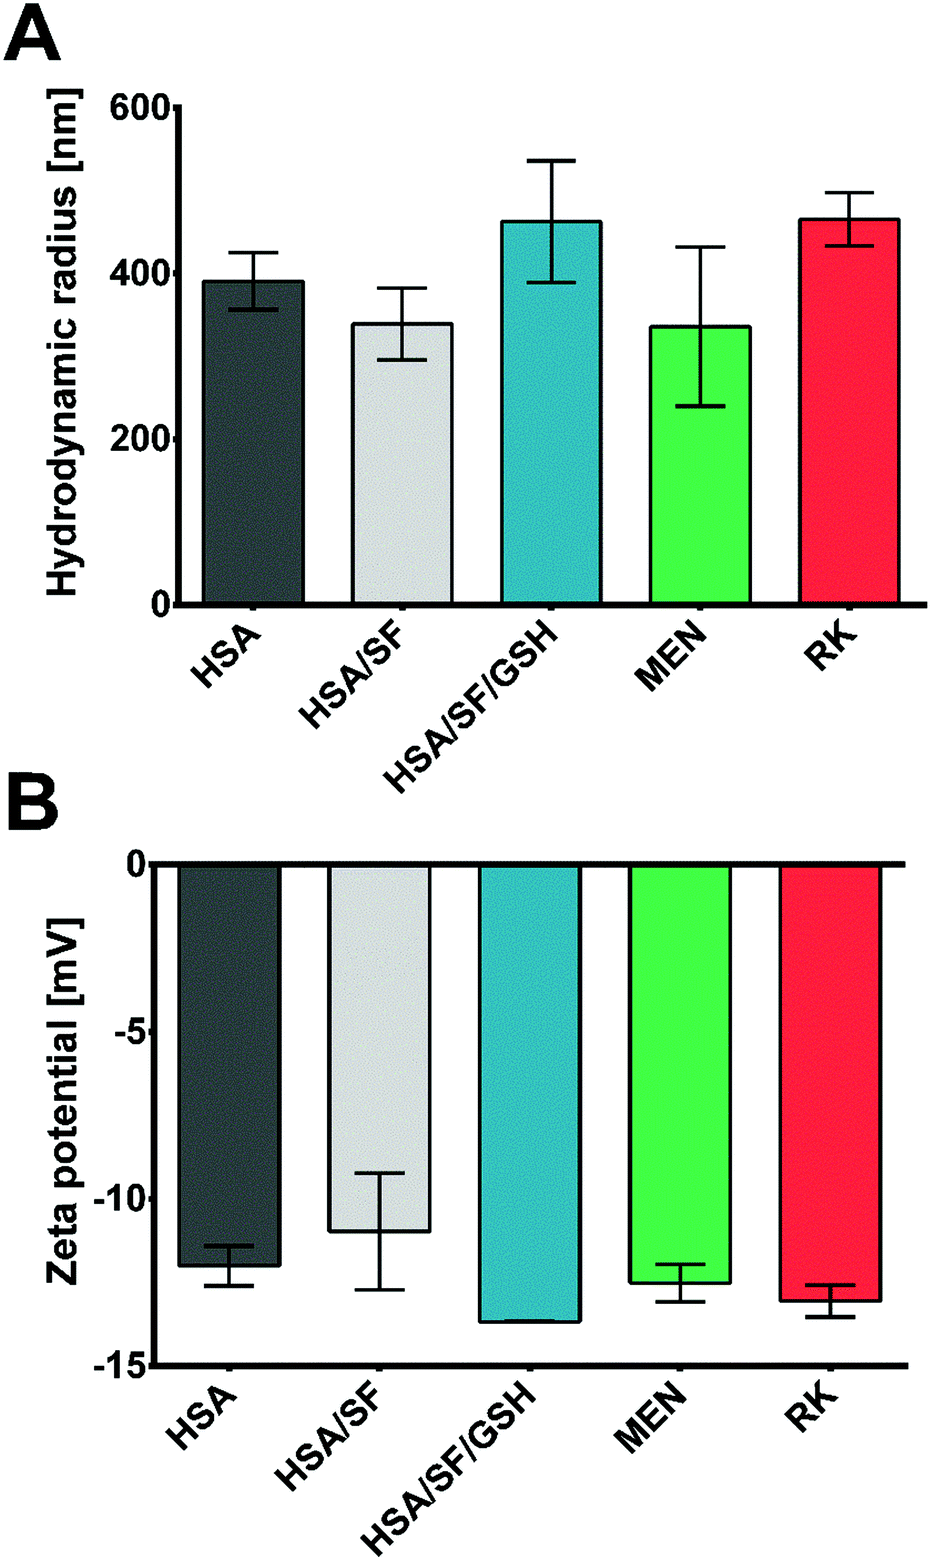 | ||
| Fig. 5 (A) DLS based hydrodynamic radii of the monodisperse fractions of HSA, HSA/SF and HSA/SF/GSH nanocapsules and menthol (MEN) and raspberry ketone (RK) loaded HSA/SF/GSH nanocapsules. (B) Zeta potential values in mV of HSA, HSA/SF and HSA/SF/GSH nanocapsules and MEN- and RK-loaded HSA/SF/GSH nanocapsules measured in sodium phosphate buffer pH 7.4. | ||
The zeta potentials of these formulations were investigated for similar reasons; in fact, HSA/SF/GSH nanocapsules showed a significantly lower zeta potential (−13.67 ± 0.01 mV) compared to HSA (−12.0 ± 0.6 mV) and HSA/SF (−10.97 ± 1.75 mV) nanocapsules. This enhanced negativity of the zeta potential is beneficial as it leads to low serum protein binding and therefore potentially increased stability for application as a cosmeceutical, in particular for people suffering from gingivitis and/or periodontitis.30 Release properties of nanosystems with enhanced protein binding ability can be significantly decreased, as previously published by Honary & Zahir.30 In this context, low zeta potential values were further described as beneficial for prolongation of the circulation time caused by reduced RES clearance.30 Furthermore, low zeta potential values give significant information on the colloidal stability of produced HSA/SF/GSH nanocapsules, where the previously reported low colloidal stability of SF nanoparticles by Wang et al. could be improved by the new approach of incorporating GSH into the nanocapsule shells.31 The resulting relatively stable32 HSA/SF/GSH nanocapsules showed no aggregation behaviour, as can be seen in the microscopic images in Fig. 4.
As HSA/SF/GSH nanocapsule production is based on the previously published sonochemical self-assembly approach by Tallian et al.,21 the protein secondary structure changes during nanocapsule formation were further investigated. In this context, the enhanced stability of the nanoformulations obtained by application of ultrasound has previously been linked to the formation of crystalline β-sheets.33,34 Here, the hydrophobic sequence motifs of SF (GAGAGS, 53% of entire protein sequence) play a crucial role during particle formation.21
The formation of disulfide bonds is known to be a key driver in β-sheet formation, which can be achieved between cystein residues.35 Therefore, the addition of the tripeptide GSH is hypothesized to lead to an increase in β-sheet formation during the ultrasound-induced self-assembly process. The secondary structure ratios (β/α ratios) of HSA, HSA/SF and HSA/SF/GSH nanocapsules were investigated by ATR-FTIR analyses of lyophilized samples (ESI,† Fig. S2). HSA/SF/GSH nanocapsules showed a significantly increased β/α ratio compared to the controls in the amide I bands (ESI,† Fig. S3), which indicates additional formation of β-sheets due to induction of covalent disulfide bonds between, for example, the cysteine residues of GSH and the free thiol groups in SF and HSA.36
Studies of the particle properties, the encapsulation efficiency and the release kinetics of loaded HSA/SF/GSH nanocapsules
Conventional oral administration of bioactive molecules lacks the possibility of rate-controlled substance release, which can be surmounted by the design of targeted release systems.37 Although in cosmetic approaches targeted and stimuli-responsive release of certain molecules is still not the gold standard, research findings applicable in targeted delivery of bioactive molecules can also be used to achieve these desired properties in cosmeceuticals. Therefore, analysis and maximization of encapsulation efficiencies is a necessity to reduce required substance amounts during the fabrication process and to prolong and secure the desired release rates.38 In the present study, two different flavour substances (menthol (MEN) and raspberry ketone (RK); see ESI,† Fig. S4 for chemical structures) were added before HSA/SF/GSH particle production. Encapsulation efficiencies were evaluated indirectly by GC-MS (MEN) and HPLC-DAD (RK), where efficiencies for MEN of 98.46 ± 0.83% and for RK of 85.16 ± 0.43% were achieved. Particle properties’ stability was evaluated using DLS and zeta potential analysis of MEN- and RK-loaded HSA/SF/GSH nanocapsules and compared to unloaded formulations (Fig. 5). No significant differences in average hydrodynamic radii and zeta potential could be found, which indicated that the encapsulation of the used flavour substances does not significantly affect the optimized particle production settings and properties based on the DoE. Further temperature dependent particle stability was investigated by observation of temperature-induced fluctuations in the hydrodynamic particle radius of loaded and unloaded HSA/SF/GSH nanocapsules (ESI,† Fig. S5). All tested formulations showed slight fluctuations at higher temperature ranges from 50 to 70 °C, but no disruption or degradation process could be observed. Hence, nanocapsule stability at release-study incubation temperatures, as well as at possible storage temperatures, for future applications could be proven. Next, release studies in 4 different artificial salivas and sodium phosphate buffer with MEN- and RK-loaded HSA/SF/GSH nanocapsules were performed and cumulative release was calculated over a time period of 168 h (Fig. 6). In the case of MEN-loaded HSA/SF/GSH nanocapsules, release was found to depend on the pH and viscosity of the artificial salivas tested. Maximum MEN release was obtained with saliva A39 (pH 4.6), with 40.45 ± 0.35%. As shown in Fig. 6A, the maximum release after 168 h significantly decreased with increasing pH and saliva viscosity (ESI,† Fig. S6), except in solvent C (sodium phosphate buffer pH 7.4). In the case of solvent C, the lack of media complexity combined with low viscosity visibly led to increased release compared to artificial salivas D–F. These three artificial salivas contain high concentrations of sodium carboxymethyl cellulose and, in the cases of salivas D40 and E,41 additional sorbitol, which are both substances significantly contributing to viscosity. In the release kinetics obtained for RK-loaded HSA/SF/GSH nanocapsules, the release mechanism showed dependencies on pH, viscosity, and the chemical structure of RK.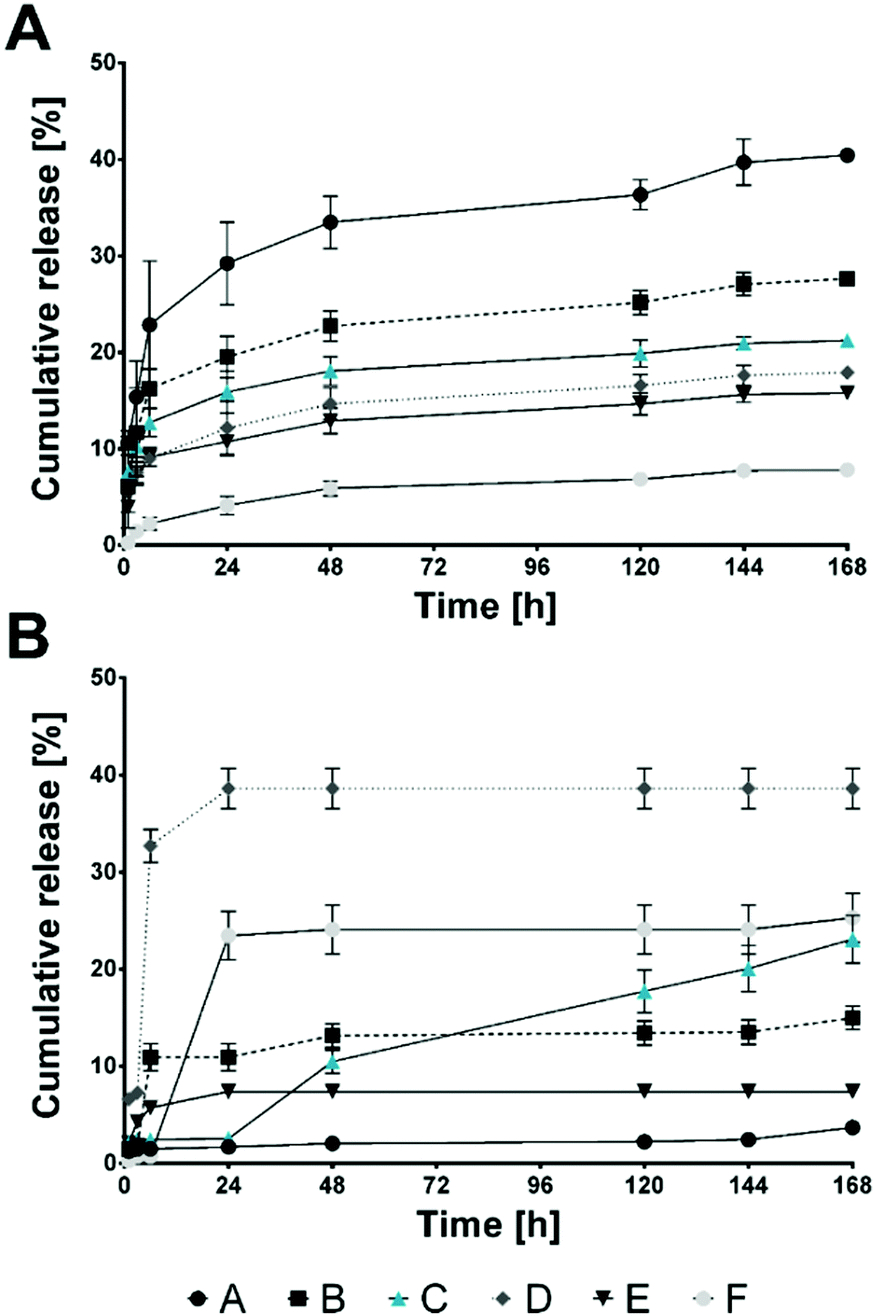 | ||
| Fig. 6 Cumulative release over 168 h of (A) menthol and (B) raspberry ketone from HSA/SF/GSH nanocapsules in various artificial salivas (A–F, where A,39 B,44 D,40 E41 and F are commercial certified and normed artificial salivas by Pickering laboratories and C is 100 mM sodium phosphate buffer pH 7.4). | ||
Regarding the structural effects of RK, the keto and/or OH groups are hypothesized to lead to covalent and hydrogen bonds induced during ultrasound-assisted nanocapsule production. In the case of ultrasound application, the propagation of the waves occurring in the solvent leads to turbulences and micro-circulations, known as acoustic streaming.42,43
These phenomena reportedly enhance physical effects influencing further chemical processing originally limited by mass transfer. Furthermore, free radicals are generated during sonication, caused by the dissociation of vapors trapped in existing cavitating bubbles; hence, chemical reactions can be intensified, which supports the stated hypothesis.42,43,45 The resulting bonds affect the release, resulting in a maximum release in artificial saliva D40 (pH 5.4) of 38.60 ± 2.07%. In comparison to previously published release data by Subia and Kundu,46 obtained maximum release rates for HSA/SF/GSH nanocapsules showed similar results. Regarding possible future application as radical scavenging and flavor delivery systems, the release rates within the observed time period of 168 h (7 days) are highly suitable. Previously published data for albumin/SF systems, however, showed release rates between 30 and 80% over a prolonged release period of 22 days.46 Therefore, faster release was achieved due to the addition of GSH.
In general, higher media viscosities combined with lower pH seemed to be beneficial for RK release; however, for both encapsulated flavor substances, a significantly lower pH led to maximum increase. For future application of flavor-loaded HSA/SF/GSH nanocapsules as cosmeceuticals, it can therefore be expected that high release rates at lowered oral pH can be achieved. This has potential for development of new products to fight gingivitis and periodontitis, wherein product viscosity must be adjusted to support the desired flavour release based on substance structure.
Radical scavenging properties
During the inflammation states present in gingivitis and periodontitis, oxygen uptake in neutrophils and macrophages leads to generation of superoxide anion radicals, hydrogen peroxide and hydroxyl radicals, as well as free radicals, which are capable of damaging cell membranes or associated biomolecules.47 To establish a beneficial healing environment as a future application, radical scavenging properties of unloaded and loaded HSA/SF/GSH nanocapsules, as well as of the pure substances, were tested in a nitric oxide inhibition assay. Expectedly, no nitric oxide inhibition, i.e. radical scavenging, was observed for the pure substances (HSA, SF, MEN and RK). HSA/SF/GSH nanocapsules showed significant radical scavenging properties up to an applied volume of 400 μL, but no significant difference between unloaded and loaded HSA/SF/GSH nanocapsules was observed (Fig. 7).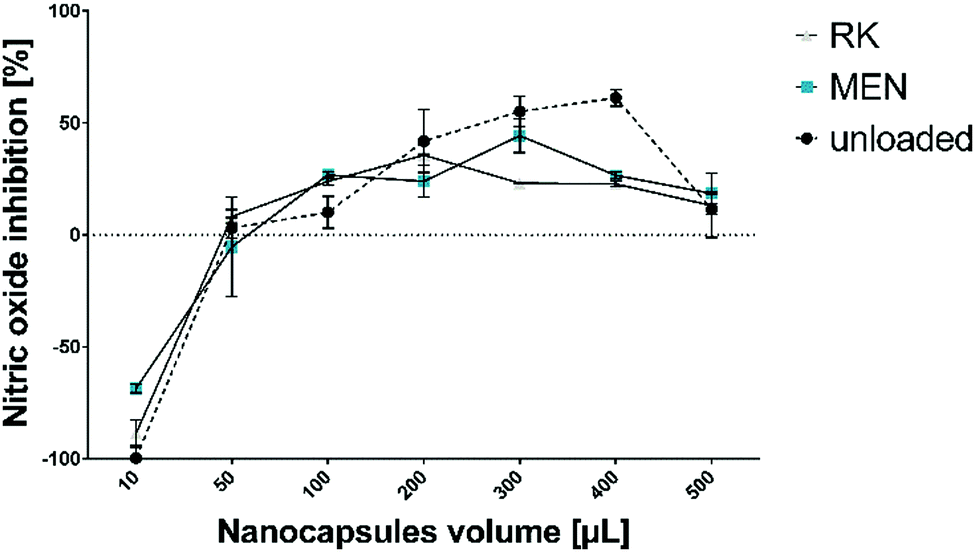 | ||
| Fig. 7 Radical scavenging properties of unloaded and MEN- or RK-loaded HSA/SF/GSH nanocapsules. Nitric oxide inhibition was measured using a scavenging assay published by Alam et al.48 and applied volumes of over 400 μL resulted in absorbance signal inhibition. | ||
This clearly indicates that the radical scavenging effect depends on addition of GSH in the formulation, which correlated with the antioxidative properties of GSH described in literature.14
Experimental
Materials and Methods
The enzyme preparation used, Cellic CTec3 from Novozymes (Bagsværd, Denmark), was Pointner-Rothschädl, (Salzburg, Austria). Bombyx mori silk cocoons were purchased from the Academy of Agricultural Sciences, Sericulture and Agriculture Experiment Station (Vratsa, Bulgaria). Human serum albumin (HSA), reduced form L-glutathione (GSH), menthol and raspberry ketone were purchased from Sigma Aldrich (Saint Louis, US) and used as received. All chemicals were of analytical grade. Artificial saliva for medical and dental research was purchased from Pickering Testing Solutions (Mountainview California, US).
Hydrolysis of the rayon fibers and sugars quantification. Rayon fibers (Rf) were cut and dried overnight in an oven at 100 °C to remove humidity; after, Rf were equilibrated in a desiccator. 30 g of rayon was hydrolyzed using Cellic CTec3 (5 kFPU g−1 of rayon) in 250 mL of 50 mM citric acid buffer at pH 4.8 and 50 °C (optimum temperature of the enzyme preparation).52 The incubation was carried out in a 500 mL flask in an orbital shaker at 150 rpm (IKA KS 4000 IC control, Staufen, Germany).
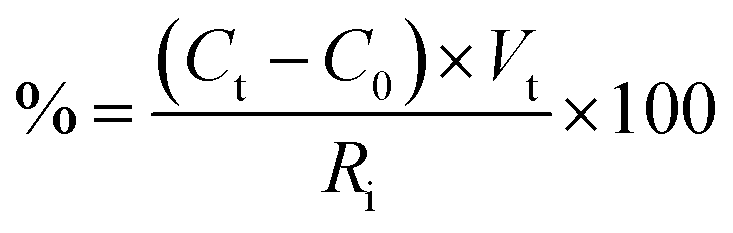
The hydrolyzed solution was centrifuged (Eppendorf Centrifuge 5810, Hamburg, Germany) at 25 °C for 10 min at 10![[thin space (1/6-em)]](https://www.rsc.org/images/entities/char_2009.gif) 000 rpm to recover the water-insoluble FRP. The supernatant was used to quantify the released sugars. The samples for sugars determination were prepared as reported in Vecchiato et al.11 The amount (%) of sugars was calculated using the following equation:
000 rpm to recover the water-insoluble FRP. The supernatant was used to quantify the released sugars. The samples for sugars determination were prepared as reported in Vecchiato et al.11 The amount (%) of sugars was calculated using the following equation:
 | (3) |
:100).
The cell dry weight was measured by collecting 2 mL of culture, harvesting the cells, and then washing them with 0.1 M HCl. The pellet was then transferred to a glass tube and dried at 100 °C for 72 h. Each reaction was performed in duplicate.
Experiments were designed and evaluated using MODDE (Umetrics, Umeå, Sweden) software with three factors and two responses in the first step. Three center points were added to the full factorial design, which resulted in a total of 11 randomized experiments. Based on the achieved results, a second design set up using two factors and two responses similar to the initial design (Table 1) was designed and performed.
| DoE 1 | ||||
|---|---|---|---|---|
| Quantitative | ||||
| Independent factor | Abbreviation | Levels | ||
| −1 | 0 | 1 | ||
| Concentration GSH | GLU | 1 | 5.5 | 10 |
| Purification steps | PUR | 1 | 5.5 | 10 |
| DoE 1 | |||
|---|---|---|---|
| Qualitative | |||
| Independent factor | Abbreviation | Settings | |
| Protein addition | PRO | Yes | No |
| DoE 2 | ||||
|---|---|---|---|---|
| Independent factor | Abbreviation | Levels | ||
| −1 | 0 | 1 | ||
| Concentration GSH | GLU | 1 | 5.5 | 10 |
| Purification steps | PUR | 1 | 3 | 5 |
 | (4) |
 | (5) |
| A39 | B44 | C | D40 | E41 | |
|---|---|---|---|---|---|
| Ingredients [g L−1] | |||||
| NaCl | 0.4 | 0.4 | 0.674 | 0.87 | |
| KCl | 0.4 | 0.4 | 0.960 | 0.62 | |
| MgCl2 6H2O | 0.0408 | 0.1275 | |||
| CaCl2 2H2O | 0.795 | 0.906 | 0.1168 | 0.225 | |
| NaH2PO4 2H2O | 0.69 | ||||
| NaH2PO4 H2O | 0.69 | 138.00 | |||
| Na2HPO4 2H2O | 177.99 | ||||
| Na2S 9 H2O | 0.005 | 0.005 | |||
| NaF | 0.0044 | ||||
| KSCN | 0.3 | ||||
| KH2PO4 | 0.242 | 0.3 | |||
| K2HPO4 | 0.8 | ||||
| Urea | 1 | 1 | |||
| Na-CMC | 8 | 10 | |||
| M p-HB | 1 | 1 | |||
| Sorbitol | 24 | 29.95 | |||
| pH value | |||||
| 4.8 | 5.3 | 7.4 | 5.4 | 6.86 | |
MEN and RK release experiments were performed with loaded HSA/SF/GSH nanocapsules in triplicate. Here, 100 μL of nanocapsule dispersions were incubated in 1 mL of artificial saliva/buffer at 37 °C (150 rpm) for 168 h to mimic the oral environment. Sampling was performed after 1, 3, 6, 24, 48, 120, 144 and 168 h. During the sampling procedure, the artificial saliva/buffer was separated from the nanocapsules and 1 mL of fresh artificial saliva/buffer was added to the nanocapsules, which were further incubated. The concentration of MEN was then quantified by GC-MS (see “Determination of the encapsulation efficiency of flavor substances”).
For RK concentration determination, HPLC-DAD was used (see “Determination of the encapsulation efficiency of flavor substances”). Based on the obtained data, cumulative release over 168 h was calculated for each formulation and artificial saliva/buffer; the data were tested and corrected for outliers afterward.
Conclusions
In this study, production of nanocapsules containing glutathione produced from glucose recovered from rayon fiber was investigated. Sustainable enzymatic hydrolysis of rayon fiber waste was used as a circular economy solution. The complete recovery of the cellulose part in the form of glucose allowed cultivation of Saccharomyces cerevisiae and therefore glutathione production. Growth, glucose consumption and glutathione formation by Saccharomyces cerevisiae were almost identical regardless of whether glucose recovered from rayon fiber or pure glucose was used as carbon source. Interestingly, zinc contained in the recovered glucose solution supported production of glutathione. Glutathione in its reduced state was successfully incorporated in nanocapsules combined with human serum albumin and silk fibroin in an ultrasound-assisted production method. Nanocapsule production was optimized by experimental design, leading to particle sizes of 462.72 ± 73.36 nm (hydrodynamic radius) and zeta potential values of 13.67 ± 0.01 mV. For possible future application as a cosmeceutical in the prevention of gingivitis and periodontitis, flavour substances were encapsulated and the release kinetics were studied in artificial saliva, revealing a pH- and viscosity-dependent release which can be adjusted for the desired flavour substance. Proven radical scavenging properties of HSA/SF/GSH nanocapsules are seen as promising formulation properties for use in cosmeceutical approaches. Therefore, an economic cycle was successfully designed and the optimized HSA/SF/GSH nanocapsule formulations can be used to offer beneficial healing environments in cases of gingivitis and periodontitis, based on the obtained properties.Conflicts of interest
The authors declare no competing financial interest.Acknowledgements
This work has been supported by the Federal Ministry of Science, Research and Economy (BMWFW), the Federal Ministry of Traffic, Innovation and Technology (bmvit), the Styrian Business Promotion Agency SFG, the Standortagentur Tirol and ZIT – Technology Agency of the City of Vienna through the COMET-Funding Program managed by the Austrian Research Promotion Agency FFG. Additionally, the work performed has received financial funding from the European Union H2020 Programme (H2020-NMP-PILOTS-2015) under the grant agreement FOLSMART [grant number 683356] and from the NÖ Forschungs- und Bildungsges.m.b.H. (NFB) and the provincial government of Lower Austria through the Science Calls (Project ID: SC16-024).References
- T. L. de Albuquerque, I. J. da Silva, G. R. de Macedo and M. V. P. Rocha, Process Biochem., 2014, 49, 1779–1789 CrossRef.
- H. O. Fisker and V. Nissen, Dev. Food Sci., 2006, 43, 429–432 CrossRef CAS.
- D. H. Abdelwahab, G. G. Allam and A. M. Abdel Aziz, Futur. Dent. J., 2018, 4, 216–220 CrossRef.
- J. M. Goodson, D. Holborow, R. L. Dunn, P. Hogan and S. Dunham, J. Periodontol., 1983, 54, 575–579 CrossRef CAS PubMed.
- N. Jain, G. K. Jain, S. Javed, Z. Iqbal, S. Talegaonkar, F. J. Ahmad and R. K. Khar, Drug Discovery Today, 2008, 13, 932–943 CrossRef CAS PubMed.
- D. Eichinger, A Vision of the World of Cellulosic Fibers in 2020, Lenziger Berichte, Lenzig, 2012, pp. 1–7 Search PubMed.
- G. B. Kauffman, J. Chem. Educ., 1993, 70, 887–893 CrossRef CAS.
- M. Eibinger, P. Bubner, T. Ganner, H. Plank and B. Nidetzky, FEBS J., 2014, 281, 275–290 CrossRef CAS PubMed.
- E. R. P. Keijsers, G. Yılmaz and J. E. G. van Dam, Carbohydr. Polym., 2013, 93, 9–21 CrossRef CAS.
- A. N. Netravali and S. Chabba, Mater. Today, 2003, 6, 22–29 CrossRef.
- S. Vecchiato, L. Skopek, S. Jankova, A. Pellis, W. Ipsmiller, A. Aldrian, B. Mueller, E. Herrero Acero and G. M. Guebitz, ACS Sustainable Chem. Eng., 2018, 6(2), 2386–2394 CrossRef CAS.
- Beta Renewables S.p.A., Brochure on Crescentino – ENGLISH, Tortona, 2016.
- J. H. Clark, J. Chem. Technol. Biotechnol., 2007, 82, 603–609 CrossRef CAS.
- A. Patzschke, M. G. Steiger, C. Holz, C. Lang, D. Mattanovich and M. Sauer, Biotechnol. J., 2015, 10, 1719–1726 CrossRef CAS PubMed.
- K. K. A. Sanjeewa, E.-A. Kim, K.-T. Son and Y.-J. Jeon, J. Photochem. Photobiol., B, 2016, 162, 100–105 CrossRef CAS PubMed.
- H. Koo, M. S. Huh, I.-C. Sun, S. H. Yuk, K. Choi, K. Kim and I. C. Kwon, Acc. Chem. Res., 2011, 44, 1018–1028 CrossRef CAS PubMed.
- A. V. Ambade, E. N. Savariar and S. Thayumanavan, Mol. Pharmaceutics, 2005, 2(4), 264–272 CrossRef CAS PubMed.
- W. Huang, A. Tarakanova, N. Dinjaski, Q. Wang, X. Xia, Y. Chen, J. Y. Wong, M. J. Buehler and D. L. Kaplan, Adv. Funct. Mater., 2016, 26, 4113–4123 CrossRef CAS PubMed.
- S. K. Podaralla, O. P. Perumal and R. S. Kaushik, in Drug Delivery Nanoparticles Formulation and Characterization, ed. Y. Pathak and D. Thassu, 2009, pp. 69–91 Search PubMed.
- X. Chen, Z. Shao, D. P. Knight and F. Vollrath, Proteins: Struct., Funct., Bioinf., 2007, 68, 223–231 CrossRef CAS PubMed.
- C. Tallian, A. Herrero-Rollett, K. Stadler, R. Vielnascher, K. Wieland, A. M. Weihs, A. Pellis, A. H. Teuschl, B. Lendl, H. Amenitsch and G. M. Guebitz, Eur. J. Pharm. Biopharm., 2018, 133, 176–187 CrossRef CAS PubMed.
- P. N. Galgut, J. Int. Acad. Periodontol., 2001, 3, 61–67 CAS.
- T. L. de Albuquerque, I. J. da Silva, G. R. de Macedo and M. V. P. Rocha, Process Biochem., 2014, 49, 1779–1789 CrossRef.
- H. O. Fisker and V. Nissen, Dev. Food Sci., 2006, 43, 429–432 CrossRef CAS.
- D. H. Abdelwahab, G. G. Allam and A. M. Abdel Aziz, Futur. Dent. J., 2018, 4, 216–220 CrossRef.
- D. J. Eide, J. Nutr., 2003, 133, 1532S–1535S CrossRef CAS PubMed.
- M. G. Steiger, A. Patzschke, C. Holz, C. Lang, T. Causon, S. Hann, D. Mattanovich and M. Sauer, FEMS Yeast Res., 2017, 17, 1–7 CrossRef CAS PubMed.
- E. Blanco, H. Shen and M. Ferrari, Nat. Biotechnol., 2015, 33, 941–951 CrossRef CAS PubMed.
- D. Peer, J. M. Karp, S. Hong, O. C. Farokhzad, R. Margalit and R. Langer, Nat. Nanotechnol., 2007, 2, 751–760 CrossRef CAS PubMed.
- S. Honary and F. Zahir, Trop. J. Pharm. Res., 2013, 12, 265–273 Search PubMed.
- S. Wang, T. Xu, Y. Yang and Z. Shao, ACS Appl. Mater. Interfaces, 2015, 7, 21254–21262 CrossRef CAS PubMed.
- S. Bhattacharjee, J. Controlled Release, 2016, 235, 337–351 CrossRef CAS PubMed.
- S. Hofmann, C. T. Wong Po Foo, F. Rossetti, M. Textor, G. Vunjak-Novakovic, D. L. Kaplan, H. P. Merkle and L. Meinel, J. Controlled Release, 2006, 111, 219–227 CrossRef CAS PubMed.
- X. Wang, E. Wenk, A. Matsumoto, L. Meinel, C. Li and D. L. Kaplan, J. Controlled Release, 2007, 117, 360–370 CrossRef CAS PubMed.
- M. Banach, B. Kalinowska, L. Konieczny, I. Roterman, M. Banach, B. Kalinowska, L. Konieczny and I. Roterman, Entropy, 2016, 18, 67 CrossRef.
- M. J. Torres, L. Turell, H. Botti, L. Antmann, S. Carballal, G. Ferrer-Sueta, R. Radi and B. Alvarez, Arch. Biochem. Biophys., 2012, 521, 102–110 CrossRef CAS PubMed.
- S. Freiberg and X. X. Zhu, Int. J. Pharm., 2004, 282, 1–18 CrossRef CAS PubMed.
- E. Wenk, H. P. Merkle and L. Meinel, J. Controlled Release, 2011, 150, 128–141 CrossRef CAS PubMed.
- H.-H. Huang, Y.-H. Chiu, T.-H. Lee, S.-C. Wu, H.-W. Yang, K.-H. Su and C.-C. Hsu, Biomaterials, 2003, 24, 3585–3592 CrossRef CAS PubMed.
- A. Preetha and R. Banerjee, Comparison of Artificial Saliva Substitutes, 2005, vol. 18 Search PubMed.
- G. M. O. de Queiroz, L. F. Silva, J. T. L. Ferreira, J. A. da C. P. Gomes and L. Sathler, Braz. Oral Res., 2007, 21, 209–215 CrossRef.
- P. R. Gogate, Chem. Eng. Process., 2008, 47, 515–527 CrossRef CAS.
- S. Asgharzadehahmadi, A. A. A. Raman, R. Parthasarathy and B. Sajjadi, Renewable Sustainable Energy Rev., 2016, 63, 302–314 CrossRef CAS.
- N. Schiff, F. Dalard, M. Lissac, L. Morgon and B. Grosgogeat, Eur. J. Orthod., 2005, 27, 541–549 CrossRef PubMed.
- P. R. Gogate and A. M. Kabadi, Biochem. Eng. J., 2009, 44, 60–72 CrossRef CAS.
- B. Subia and S. C. Kundu, Nanotechnology, 2013, 24, 035103 CrossRef CAS PubMed.
- M. Battino, P. Bullon, M. Wilson and H. Newman, Crit. Rev. Oral Biol. Med., 1999, 10, 458–476 CrossRef CAS.
- M. N. Alam, N. J. Bristi and M. Rafiquzzaman, Saudi Pharm. J., 2013, 21, 143–152 CrossRef PubMed.
- T. K. Ghose, Pure Appl. Chem., 1987, 59, 257–268 CAS.
- Y. H. P. Zhang, J. Hong and X. Ye, in Biofuels: Methods and Protocols, ed. J. R. Mielenz, Humana Press, 2009, pp. 213–231 Search PubMed.
- M. Dashtban, M. Maki, K. T. Leung, C. Mao and W. Qin, Crit. Rev. Biotechnol., 2010, 30, 302–309 CrossRef CAS PubMed.
- Novozymes, Cellulosic ethanol Novozymes Cellic® CTec3-Secure your plant's lowest total cost Application sheet.
- ÖNORM EN ISO 17294-2, 2004.
- D. N. Rockwood, R. C. Preda, T. Yucel, X. Wang, M. L. Lovett and D. L. Kaplan, Nat. Protoc., 2011, 6, 1612–1631 CrossRef CAS PubMed.
Footnote |
| † Electronic supplementary information (ESI) available: Details regarding the structure of the flame retardant pigment, detailed information on the used HPLC gradients, detailed information of the experimental designs DoE 1 and 2 including the corresponding results (ANOVA tables, response contour plots, coefficient plots), ATR-FTIR spectra and the correlated secondary structure ratios, chemical structures of the flavor substances, results of DLS based temperature stability analysis and information of artificial saliva viscosities. See DOI: 10.1039/c9tb00473d |
| This journal is © The Royal Society of Chemistry 2019 |