Influence of surface chemistry on the formation of a protein corona on nanodiamonds†
Alfonso E.
Garcia-Bennett
 *ab,
Arun
Everest-Dass
c,
Irene
Moroni
a,
Ishan Das
Rastogi
a,
Lindsay M.
Parker
ab,
Nicolle H.
Packer
abc and
Louise J.
Brown
b
aDepartment of Molecular Sciences, Macquarie University, Sydney, NSW 2109, Australia
bCentre for Nanoscale BioPhotonics, Macquarie University, Sydney, NSW 2109, Australia
cInstitute for Glycomics, Gold Coast Campus, Griffith University, QLD 4222, Australia. E-mail: alf.garcia@mq.edu.au
First published on 16th April 2019
Abstract
Nanodiamonds form a dynamic protein corona independent of the type of surface functional group. Proteomics data suggest that the top 30 proteins of nanodiamonds that are incubated in fetal bovine serum are similar in terms of abundance and function, despite differences in the nanodiamond surface properties. Surprisingly, the most abundant serum protein, albumin, is not one of the most abundant corona proteins, with low molecular weight proteins below 20 kDa being favoured. The pre-incubation of a protein corona on nanodiamonds significantly decreases the production of reactive oxygen species, increasing the cell viability of macrophages after incubation with the nanodiamonds for 48 hours. However, this effect was only observed for protein coronas on nanodiamonds with a negative surface charge and not when they were functionalised with positive surface charges, such as amine groups. This work highlights the role of the protein corona in colloidal stability and its effect on the biological behaviour of diamond nanoparticles.
Introduction
Nanodiamonds belong to a rapidly growing class of nanomaterials being developed for applications in diagnostics and bio-imaging due to their optimal optical properties in combination with their low toxicological profiles.1,2 There is now a rich library of nanodiamonds commercially available in terms of their particle size, structure, optical properties and surface functionalization, and they are prepared through a wide range of synthetic methods including high pressure high temperature (HPHT) and chemical vapour deposition (CVD) formation and detonation approaches. Nanodiamonds (NDs) derived from detonation and HPHT approaches, are still the standard as they are both relatively simple and economically viable fabrication methods.As NDs are composed of sp3-hybridized carbon, they are biocompatible and generate no reactive oxygen species (ROS) that may lead to cytotoxicity.3,4 NDs can act as free radical scavengers due to their unpaired electrons,5 and possess large surface areas over 100 m2 g−1, which can be used for bio-conjugation of pharmaceutical compounds of various sizes. For example, the drug doxorubicin has been successfully delivered to drug-resistant breast cancer (4T1) and liver cancer (LT2-M) animal models using NDs as carriers.6,7 Additionally, NDs coated with polyethylenimine 800 (PEI-800) were recently used to transfect nucleic acids, with a 70-fold enhancement of GFP plasmid efficacy.8 It is reasonable to assume that the chemical (surface charge or surface reactivity) and physical properties (size, surface area and optical activity) of NDs prepared by various methods should differ considerably from a biological perspective (their particle uptake, immunological and toxicity behavior).2 However, there have been limited systematic studies on the interaction of NDs with biological media and surprisingly no studies on the potential to elicit a different biological response from different types of functionalised NDs. The behavior of nanoparticles in living systems is, to a certain degree, mediated by their ability to interact with biological media through the formation of protein layers, termed the protein corona.9–12 Alterations to the expected behavior of nanoparticles with respect to their toxicology, cellular targeting ability and immunological properties have been reported,13 and assigned to a complex and dynamic process of protein adsorption which is still poorly understood today.14–18
The purpose of this work is to evaluate the formation and composition of protein coronas on commercial, purified and amine functionalized NDs prepared via HPHT methods.19 Our results highlight the need for detailed material characterization to be correlated with proteomics data over a variety of time points in order to understand the relationship between NDs’ purity, surface functionality, composition of the protein corona and important biological endpoints including cell viability. In this work, sequential window acquisition of all theoretical fragment ion spectra mass spectrometry (SWATH-MS) was used. SWATH-MS is a data independent method for mass spectrometry-based proteomics with a complete measurement of all fragment ions of the detectable peptide precursors present in the protein corona, and so offers high sensitivity and label-free quantification.
The cellular responses to the uptake of NDs with different protein coronas were evaluated by monitoring the formation of reactive oxygen species (ROS) and apoptosis in monocyte derived macrophage cells at difference incubation times. Zinc oxide particles were used as a negative control as they have been found to cause cytotoxic effects mediated by Zn2+ ions in solution, irrespective of the absence or presence of serum, and thus of a protein corona.20–22
Experimental
Nanodiamonds
Unprocessed HPHT-NDs were supplied by Microdiamant AG (Switzerland), specified as monocrystalline diamond powder 0–50 nm in size, and were used ‘as-received’ (As-NDs) and also after being purified (PUR-NDs) as described below. Amine functionalized HPHT nanodiamonds (NH2-NDs, average particle size 40 nm) were purchased from Adamas Nanotechnologies Inc. (Raleigh, North Carolina, United States). These particles were functionalized via reaction with organosilane (3-aminopropyl)triethoxysilane (APTES).Purification of nanodiamonds
Unprocessed HPHT NDs were refluxed at 70 °C for 3 days in an acid mixture of concentrated sulphuric acid (H2SO4) and nitric acid (HNO3). The resuspension was then centrifuged in order to form a pellet of the nanodiamond sample. The acid mixture was decanted before further rinsing the sample with deionized (DI) water. The solution was ultrasonicated for 1 h in an ice bath. The NDs were centrifuged once again and re-dispersed in a fresh acid mixture and refluxed at 70 °C for 3 days. This cycle of acid refluxing centrifugation and sonication was repeated three times. After the final reflux cycle, NDs were dispersed in 0.1 M sodium hydroxide (NaOH) in order to neutralize the solution. The resuspension was refluxed at 90 °C for 1 h after which NDs were allowed to sediment; NaOH was removed by copious rinsing with distilled water.Physicochemical characterization
![[thin space (1/6-em)]](https://www.rsc.org/images/entities/char_2009.gif) 000 and 50
000 and 50![[thin space (1/6-em)]](https://www.rsc.org/images/entities/char_2009.gif) 000.
000.
Transmission electron microscopy (TEM) images were recorded on a JEOL-3000F microscope operating at 300 kV and between ×4000 and 10![[thin space (1/6-em)]](https://www.rsc.org/images/entities/char_2009.gif) 000 magnification.
000 magnification.
Incubation with bovine serum and ND recovery
NDs and zinc oxide particles were incubated in Dulbecco's modified Eagle's medium (DMEM) supplemented with either 1% (v/v) or 10% (v/v) Fetal Bovine Serum (FBS) at a final concentration of 1 mg mL−1. The particles were sonicated in DMEM for 10 seconds prior to addition of FBS, after which they were vortexed for a further 10 seconds in order to adequately disperse the FBS in the medium. Subsequently, the particles (1 mg mL−1) were incubated for 1, 10 or 30 minutes. Purification of the particles was conducted in order to remove the soft loosely bound protein corona and to retain only tightly bound proteins (the so called hard corona). This was achieved by centrifugation of the incubated solution at 10![[thin space (1/6-em)]](https://www.rsc.org/images/entities/char_2009.gif) 000 rpm for 5 minutes before the supernatant was discarded and the particles were washed with 1 mL of MilliQ water. These particles were then gently vortexed for 10 seconds before the centrifugation and washing steps were repeated. In total, three washing cycles were performed. The final particles possessing a protein corona were finally kept in water (1 mL) before proceeding with proteomic analysis. Protein corona samples are denoted by the nanodiamond type (As, PUR or NH2) followed by the incubation time and serum concentration (e.g. AsT10S10, PURT1S10, etc.).
000 rpm for 5 minutes before the supernatant was discarded and the particles were washed with 1 mL of MilliQ water. These particles were then gently vortexed for 10 seconds before the centrifugation and washing steps were repeated. In total, three washing cycles were performed. The final particles possessing a protein corona were finally kept in water (1 mL) before proceeding with proteomic analysis. Protein corona samples are denoted by the nanodiamond type (As, PUR or NH2) followed by the incubation time and serum concentration (e.g. AsT10S10, PURT1S10, etc.).
Proteomic and SWATH analysis
![[thin space (1/6-em)]](https://www.rsc.org/images/entities/char_2009.gif) 000g. The supernatants were transferred into new microcentrifuge tubes, then dried. The samples were reconstituted in 40 μL loading buffer (0.1% formic acid) then centrifuged again prior to analysis by mass spectrometry. Information dependent acquisition (IDA) data and SWATH-MS data were acquired using a 5600 TripleTOF+ mass spectrometer (SCIEX, Framingham, MA) coupled with an Eksigent Ultra-nanoLC-1D system (Eksigent, Dublin, CA) as previously described.24 All samples were analysed as experimental duplicates.
000g. The supernatants were transferred into new microcentrifuge tubes, then dried. The samples were reconstituted in 40 μL loading buffer (0.1% formic acid) then centrifuged again prior to analysis by mass spectrometry. Information dependent acquisition (IDA) data and SWATH-MS data were acquired using a 5600 TripleTOF+ mass spectrometer (SCIEX, Framingham, MA) coupled with an Eksigent Ultra-nanoLC-1D system (Eksigent, Dublin, CA) as previously described.24 All samples were analysed as experimental duplicates.
Ten microliter tryptic peptide samples were injected onto a peptide trap (Bruker peptide Captrap) for pre-concentration and desalted over 5 min at 10 μL min−1 with 0.1% formic acid and 2% acetonitrile. The peptide trap was then switched in-line with an in-house packed analytical column (75 μm × 10 cm of solid core Halo C18, 160 Å, 2.7 μm media (Bruker, Manning Park, Billerica, MA)) and a fused silica PicoTip emitter (New Objective, Woburn, MA). After desalting, the sample was subjected to a 120 min increasing acetonitrile gradient (5% to 40%; 99.9% acetonitrile and 0.1% formic acid) at a flow rate 600 nL min−1 for analytical separation and MS data acquisition. IDA data were acquired for pure bovine serum samples and pooled protein corona samples. In IDA mode, a TOFMS survey scan was acquired at m/z 350–1500 with 0.25 s accumulation time, with the ten most intense precursor ions (2+ to 5+; counts > 150) in the survey scan consecutively isolated for product ion scans. Dynamic exclusion was used for 20 s. Product ion spectra were accumulated for 200 milliseconds in the mass range m/z 100–1500 with rolling collision energy (0.0625 × m/z − 3 for z = 2, 0.0625 × m/z − 4 for z = 3, and 0.0625 × m/z − 5 for z = 4 and z = 5). SWATH data were acquired in duplicates for each of the hard corona sample conditions. In SWATH mode, TOFMS survey scans were acquired (m/z 350–1500, 50 milliseconds) followed by 60 product ion scans with predefined consecutive variable Q1 windows from m/z 400 to m/z 1250, which were determined based on precursor m/z frequencies in the IDA data. Product ion spectra were accumulated for 60 milliseconds in the mass range m/z 350–1500 with rolling collision energy for the lowest m/z in the Q1 window (assuming z = 2) + 10%.
ProteinPilot version 4.2 (AB Sciex, Foster City, CA, USA) was used to generate a spectral library from the IDA. The database used for the search was SwissProt (released 2016) taxonomy: Bos taurus with 5991 entries. 135 proteins were identified with better than 95% confidence. A maximum of 2 missed cleavages and carbamidomethylation of cysteines were set as fixed modifications, and asparagine and glutamine deamidation, oxidation of methionine and hydroxylation of lysine and proline were set as variable modifications. The ProteinPilot IDA search result group file was imported into PeakView (v2.1) (AB Sciex) as a SWATH library. SWATH data were extracted using PeakView (v2.1) with the following parameters: top 6 most intense fragments of each peptide were extracted from the SWATH data sets (75 ppm mass tolerance, 10 min retention time window). Shared and modified peptides were excluded. After data processing, peptides (max 100 peptides per protein) with a confidence of 99% and an FDR of 1% (based on chromatographic features after fragment extraction) were used for quantitation.
The extracted SWATH peak areas were exported as an excel file and subjected to statistical analysis. The mass spectrometry data, library and relevant descriptions have been deposited in the ProteomeXchange Consortium via the PRIDE partner repository,25 with the dataset identifier PXD013437. See the ESI† for access details.
Biological assays
All biological assays were performed using J774 monocyte macrophage cells from BALB/C mice. The cells were grown in 6-well plates for 4 days before incubation with 1 mg mL−1 NDs or zinc oxide particles for 48 h. After incubation, the cells were detached by manual scraping and subsequently analysed with a Muse® Cell Analyzer (Merck Millipore). Particles were incubated with proteins before their addition to the cells as described above, with DMEM supplemented with 10% FBS (see Incubation with bovine serum and ND recovery). The incubation times with proteins with nanoparticles were 0, 10 and 30 minutes.Results and discussion
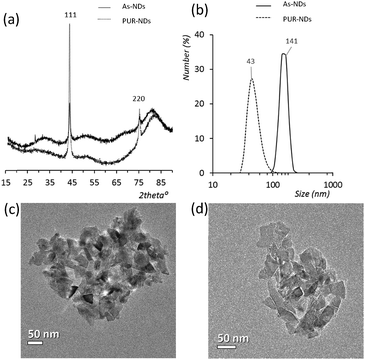
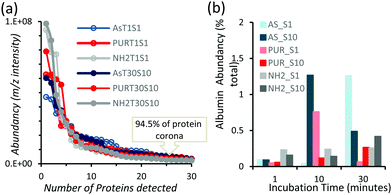
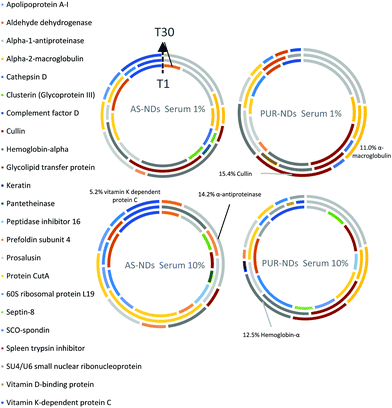
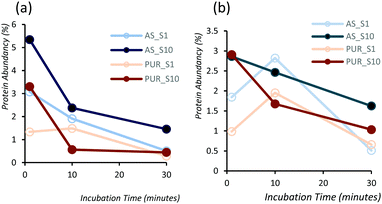
Powder XRD diffractograms (Fig. 1a) of HPHT NDs before and after the purification step (As-NDs and PUR-NDs, respectively) showed no significant variations in their structural properties, with both nanomaterials showing diffraction peaks that are assigned to the cubic diamond lattice. Visible between 25 and 35° 2θ is a broad peak assigned to graphite impurities. This peak is more prominent for As-ND samples. Material properties for the NH2-NDs and zinc oxide particles are included in the ESI† (Fig. S1 and S2). Dynamic light scattering curves (Fig. 1b) show maxima below 50 nm for PUR-NDs, whilst agglomeration is prevalent in the As-ND samples with a peak centred at 140 nm. Zeta potential measurements show that both types of NDs are highly negatively charged, with values of −44.1 and −40.5 mV for As-NDs and PUR-NDs, respectively (Fig. S2a, ESI†). Fourier transform infrared spectroscopy (Fig. S2b and c, ESI†) shows a sharper and more intense –COOH bending peak (1600 cm−1), indicating a more homogenous surface chemistry after the purification step. This is further evidenced by a sharper C–H (sp3) stretching peak at 2925 cm−1 for the PUR-ND sample. The Raman spectra of ND powdered samples shown in Fig. S2d (ESI†) further confirm the removal of disordered sp3 carbon from the core diamond centre after purification, as evidenced by a significantly sharper diamond peak centred at 1320 cm−1 in the spectra of PUR-NDs versus As-NDs. This is also accompanied by an increase in the diamond to graphitised sp2 (1500–1700 cm−1, G-band) carbon intensity ratio: 2.1 vs. 1.14 for PUR-NDs and As-NDs respectively.27 The primary particle size as observed from TEM images (Fig. 1c and d) is in the range of 30–60 nm for both samples, with particle morphologies showing irregular surfaces.In order to identify any differences in the adsorption of serum proteins, the NDs were incubated following a protocol previously reported for silica particles.28 Samples of NDs were incubated in DMEM buffer containing either 1% or 10% FBS at a final concentration of 1 mg mL−1. The incubation process was stopped by centrifugation and unbound proteins were removed (see the Experimental section). A total of 118 proteins were detected for all samples following SWATH-MS analysis. The top 30 most abundant proteins contribute to almost 95% of all detected proteins, as shown in Fig. 2a and Fig. S3a (ESI†). A heat map of the full protein data set for all ND corona samples is shown in Fig. S3b (ESI†). The heat map shows little correlation or hierarchical clustering of the proteins detected with respect to the ND type. A large variability of proteins found in the overall corona is observed. Serum albumin, the most abundant protein in FBS at approximately 60%, is not present in the top ten most abundant proteins for any of the time points studied, with the exception of the zinc oxide particles (Table S4, ESI†). Serum albumin is a major zinc transporter in plasma but it represents only a small fraction of the coronas of NDs (Fig. 2b). A comparison of the most abundant top 30 proteins for As-NDs and PUR-NDs reveals few similarities in the relative abundance and protein composition of the top 30 proteins. In fact, only 6.7% of the total compositions of the protein coronas of the six samples of PUR-NDs and As-NDs is unique, when considering the top 30 proteins. Fig. 3 shows pie chart representations of the top 10 most abundant proteins detected for As-NDs and PUR-NDs as functions of incubation time and serum concentration (a full list is included in Table S4, ESI†). The protein corona compositions of the top 10 proteins are similar in identity, with only two unique proteins (complement factor D and glycolipid transfer protein) found in samples AsT10S1 and PURT10S1 respectively. Bovine serum proteins α-1-antiproteinase, α-2-macroglobulin, cullin, haemoglobin-α, prosalusin and protein CutA dominate the protein corona accounting for between 33% (AsT1S1) and 62% (PURT30S1) of all proteins in the hard corona. Both α-1-antiproteinase and haemoglobin-α consistently increase within the incubation time periods studied for both As- and PUR-NDs, whilst aldehyde dehydrogenase was only detected in the corona of As-NDs. The 60S ribosomal protein L19 remains in high abundance on As-NDs with longer incubation times (4.16% AsT30S10), whilst it decreases for PUR-NDs with incubation time at both serum concentrations (e.g. 4.26% PURT1S10 to 1.26% PURT30S10). Complement factor D and the peptidase inhibitor decrease in relative abundance on both types of NDs, suggesting a time dependent exchange from the protein corona in the time period studied (Fig. 4), as observed for serum albumin (Fig. 2b).
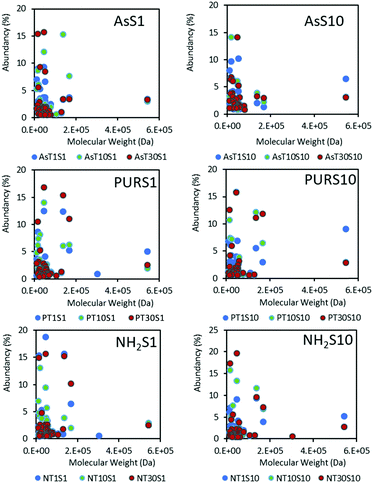
Low molecular weight proteins dominate the hard coronas of NDs (Fig. 5) at the time points studied, with SCO-spondin (54 kDa) and cullin (30 kDa) proteins being the exception. A favourable adsorption of lower molecular weight proteins below 20 kDa may indicate a diffusion coefficient dependent protein adsorption process, or a strong influence of the nanoparticle surface on the spatial arrangement of proteins adsorbed. Results for zinc oxide particles (Fig. S5, ESI†) show a similar preference for low molecular weight proteins, and this has also been observed for a range of silica and polymeric NPs.17
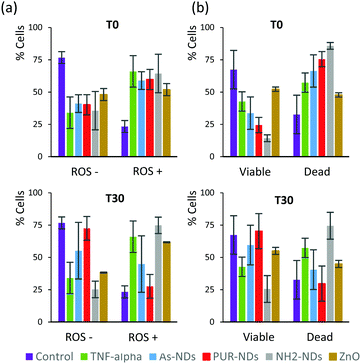
In order to elucidate a preliminary influence of the protein corona of NDs on their biological behaviour, including cell viability and generation of reactive oxygen species (ROS), assays were conducted using a J774 cell line from mouse BALB/C monocyte macrophages. Assays were performed after 48 hours of incubation, with naked NDs and particles pre-incubated in 10% serum for 30 minutes. The signalling protein tumor necrosis factor (TNF-α), which is associated with an acute inflammatory response, was used as a positive control. All particles incubated with macrophage cells, in the absence of a pre-formed protein corona, caused a significant amount of ROS positive cells as well as a decrease in cell viability after 48 hours (Fig. 6a and b) in comparison to controls. The amounts of ROS positive cells for naked ND and ZnO particles (T0) were similar to that observed for cells treated with TNF-α (20 ng mL−1). The decrease in the number of viable cells was greater for NH2-NDs. Positively charged particles may induce disruption of cell membrane integrity,29 which may explain this result. The amount of ROS positive cells correlates well with cell viability data for all samples. The pre-incubation of particles in FBS to establish a protein corona significantly decreased the production of ROS and increased cell viability for As-NDs and PUR-NDs, but not for NH2-NDs. In the context of this work, pre-incubation in FBS has no effect on the ability of ZnO particles to cause cell death. This has also been previously reported by others.22
An overproduction of ROS in cells is assigned to increases in the concentration of radical by-products (e.g. hydroxyl radicals, or superoxide anion radicals) of the cellular oxidative metabolism. This excess of ROS induces oxidative stress and causes and interferes with the cell's redox regulated functions.30 The cytotoxicity effects observed for NH2-NDs in comparison to the negatively charged As-NDs and PUR-NDs could suggest that their protein coronas are significantly different, but the SWATH analysis presented here suggests only small differences in protein composition (Table S5, ESI†). Whilst there is evidence that negatively charged carbon particles (carboxyfullerenes) scavenge ROS,31 in this work ROS production appears to be surface charge independent in the absence of pre-incubation. Examination of the isoelectric point (pI) of the most abundant proteins in the protein coronas of the NDs studied here (Fig. S6, ESI†) does not reveal any clear protein–surface interaction differences even though some individual proteins like 60S ribosomal protein L19 (pI 11.48, 3.93%) are only present in the corona of As-NDs. However, the higher proportion of proteins with a pI < 7 may suggest that the protein coronas of As-NDs and PUR-NDs remain strongly bound to the ND surfaces for a prolonged period of time in contrast to the positively charged NH2-NDs. The formation of a protein corona prior to incubation with HeLa cells was recently reported to stabilise the colloidal properties of NDs and lead to significantly less particle aggregation in cell culture medium.32 Finally, the important role of protein glycosylation should be investigated with NDs as the removal of glycans from the protein corona of silica nanoparticles was recently found to play an important role in cell adhesion and cell uptake.33 The low abundance of serum albumin, which is largely non-glycosylated in FBS, from the coronas of NDs may hint at an important role of glycans in the biological behaviour of these important nanoparticles.
Conclusions
In conclusion, our results suggest that NDs show ROS mediated cytotoxicity after 48 h incubation in monocyte macrophage cell lines irrespective of surface charge. Nanodiamonds form a protein corona that is similar in protein composition despite the presence of different surface groups at the NDs’ surfaces. However, amine functionalised NDs resulted in the formation of ROS and a decrease in cell viability when incubated with a pre-formed corona. In contrast, negatively charged NDs showed a decrease in ROS production and better tolerance in macrophages when incubated with a pre-formed protein corona. We postulate that this could be due to the stronger aggregation of the protein coronas on the surfaces of negatively charged nanodiamonds, retaining their colloidal stability in the cell culture medium and after cellular uptake. Our future work will focus on elucidating this mechanism further.Conflicts of interest
The authors declare no conflict of interest.Acknowledgements
This work was financed through support from the ARC Centre of Excellence for Nanoscale BioPhotonics (CE140100003), an ARC Future Fellowship (AEGB, FT150100342), an ARC DECRA Fellowship (LMP, DE180100206) and a Macquarie University Infrastructure grant (MQRIBG-9201501951). This research was facilitated by access to the Australian Proteome Analysis Facility (APAF), which is funded by an initiative of the Australian Government as part of the National Collaborative Research Infrastructure Strategy.References
- A. Schrand, S. A. C. Hens and O. Shenderova, Crit. Rev. Solid State Mater. Sci., 2009, 34, 18–74 CrossRef CAS.
- V. N. Mochalin, O. Shenderova, D. Ho and Y. Gogotsi, Nat. Nanotechnol., 2011, 7, 11–23 CrossRef PubMed.
- A. M. Schrand, H. J. Huang, C. Carlson, J. J. Schlager, E. Osawa, S. M. Hussain and L. M. Dai, J. Phys. Chem. B, 2007, 111, 2–7 CrossRef CAS PubMed.
- W. S. Yeap, Y. Y. Tan and K. P. Loh, Anal. Chem., 2008, 80, 4659–4665 CrossRef CAS PubMed.
- K. Santacruz-Gomez, A. Sarabia-Sainz, M. Acosta-Elias, M. Sarabia-Sainz, W. Janetanakit, N. Khosla, R. Melendrez, M. P. Montero and R. Lal, Nanotechnology, 2018, 29, 125707 CrossRef PubMed.
- E. K. Chow, X. Q. Zhang, M. Chen, R. Lam, E. Robinson, H. Huang, D. Schaffer, E. Osawa, A. Goga and D. Ho, Sci. Transl. Med., 2011, 3, 73ra21 Search PubMed.
- J. Grant, M. Naeim, Y. Lee, D. Miya, T. Kee and D. Ho, in Nanotheranostics for Cancer Applications, ed. P. Rai and S. A. Morris, Springer International Publishing, Cham, 2019, pp. 319–344, DOI:10.1007/978-3-030-01775-0_14.
- X. Q. Zhang, M. Chen, R. Lam, X. Y. Xu, E. Osawa and D. Ho, ACS Nano, 2009, 3, 2609–2616 CrossRef CAS PubMed.
- M. P. Monopoli, C. Aberg, A. Salvati and K. A. Dawson, Nat. Nanotechnol., 2012, 7, 779–786 CrossRef CAS PubMed.
- M. P. Monopoli, D. Walczyk, A. Campbell, G. Elia, I. Lynch, F. B. Bombelli and K. A. Dawson, J. Am. Chem. Soc., 2011, 133, 2525–2534 CrossRef CAS PubMed.
- A. E. Nel, L. Madler, D. Velegol, T. Xia, E. M. Hoek, P. Somasundaran, F. Klaessig, V. Castranova and M. Thompson, Nat. Mater., 2009, 8, 543–557 CrossRef CAS PubMed.
- S. Ritz, S. Schottler, N. Kotman, G. Baier, A. Musyanovych, J. Kuharev, K. Landfester, H. Schild, O. Jahn, S. Tenzer and V. Mailander, Biomacromolecules, 2015, 16, 1311–1321 CrossRef CAS PubMed.
- A. Salvati, A. S. Pitek, M. P. Monopoli, K. Prapainop, F. B. Bombelli, D. R. Hristov, P. M. Kelly, C. Aberg, E. Mahon and K. A. Dawson, Nat. Nanotechnol., 2013, 8, 137–143 CrossRef CAS PubMed.
- A. J. Paula, R. T. Araujo Junior, D. S. Martinez, E. J. Paredes-Gamero, H. B. Nader, N. Duran, G. Z. Justo and O. L. Alves, ACS Appl. Mater. Interfaces, 2013, 5, 8387–8393 CrossRef CAS PubMed.
- F. Wang, L. Yu, M. P. Monopoli, P. Sandin, E. Mahon, A. Salvati and K. A. Dawson, Nanomedicine, 2013, 9, 1159–1168 CrossRef CAS.
- E. Witasp, N. Kupferschmidt, L. Bengtsson, K. Hultenby, C. Smedman, S. Paulie, A. E. Garcia-Bennett and B. Fadeel, Toxicol. Appl. Pharmacol., 2009, 239, 306–319 CrossRef CAS.
- S. Tenzer, D. Docter, J. Kuharev, A. Musyanovych, V. Fetz, R. Hecht, F. Schlenk, D. Fischer, K. Kiouptsi, C. Reinhardt, K. Landfester, H. Schild, M. Maskos, S. K. Knauer and R. H. Stauber, Nat. Nanotechnol., 2013, 8, 772–781 CrossRef CAS PubMed.
- D. Docter, D. Westmeier, M. Markiewicz, S. Stolte, S. K. Knauer and R. H. Stauber, Chem. Soc. Rev., 2015, 44, 6094–6121 RSC.
- J. P. Boudou, P. A. Curmi, F. Jelezko, J. Wrachtrup, P. Aubert, M. Sennour, G. Balasubramanian, R. Reuter, A. Thorel and E. Gaffet, Nanotechnology, 2009, 20, 235602 CrossRef PubMed.
- X. Deng, Q. Luan, W. Chen, Y. Wang, M. Wu, H. Zhang and Z. Jiao, Nanotechnology, 2009, 20, 115101 CrossRef PubMed.
- K. T. Yong, I. Roy, R. Hu, H. Ding, H. Cai, J. Zhu, X. Zhang, E. J. Bergey and P. N. Prasad, Integr. Biol., 2010, 2, 121–129 CrossRef CAS PubMed.
- J. Shi, H. L. Karlsson, K. Johansson, V. Gogvadze, L. Xiao, J. Li, T. Burks, A. Garcia-Bennett, A. Uheida, M. Muhammed, S. Mathur, R. Morgenstern, V. E. Kagan and B. Fadeel, ACS Nano, 2012, 6, 1925–1938 CrossRef CAS PubMed.
- R. Jenkin and R. L. Snyder, Introduction to X-ray Powder Diffractometry, John Wiley & Sons, Inc., 1996, vol. 138 Search PubMed.
- J. X. Wu, X. Song, D. Pascovici, T. Zaw, N. Care, C. Krisp and M. P. Molloy, Mol. Cell. Proteomics, 2016, 15, 2501–2514 CrossRef CAS PubMed.
- J. A. Vizcaíno, A. Csordas, N. del-Toro, J. A. Dianes, J. Griss, I. Lavidas, G. Mayer, Y. Perez-Riverol, F. Reisinger, T. Ternent, Q.-W. Xu, R. Wang and H. Hermjakob, Nucleic Acids Res., 2016, 44, D447–D456 CrossRef PubMed.
- G. Koopman, C. Reutelingsperger, G. Kuijten, R. Keehnen, S. Pals and M. Van Oers, Blood, 1994, 84, 1415–1420 CAS.
- V. I. Korepanov, H.-o. Hamaguchi, E. Osawa, V. Ermolenkov, I. K. Lednev, B. J. M. Etzold, O. Levinson, B. Zousman, C. P. Epperla and H.-C. Chang, Carbon, 2017, 121, 322–329 CrossRef CAS.
- A. M. Clemments, C. Muniesa, C. C. Landry and P. Botella, RSC Adv., 2014, 4, 29134 RSC.
- E. Fröhlich, Int. J. Nanomed., 2012, 7, 5577–5591 CrossRef PubMed.
- H. Meng, T. Xia, S. George and A. E. Nel, ACS Nano, 2009, 3, 1620–1627 CrossRef CAS PubMed.
- J.-J. Yin, F. Lao, P. P. Fu, W. G. Wamer, Y. Zhao, P. C. Wang, Y. Qiu, B. Sun, G. Xing, J. Dong, X.-J. Liang and C. Chen, Biomaterials, 2009, 30, 611–621 CrossRef CAS PubMed.
- S. R. Hemelaar, A. Nagl, F. Bigot, M. M. Rodríguez-García, M. P. de Vries, M. Chipaux and R. Schirhagl, Mikrochim. Acta, 2017, 184, 1001–1009 CrossRef CAS PubMed.
- S. Wan, P. M. Kelly, E. Mahon, H. Stöckmann, P. M. Rudd, F. Caruso, K. A. Dawson, Y. Yan and M. P. Monopoli, ACS Nano, 2015, 9, 2157–2166 CrossRef CAS PubMed.
Footnote |
| † Electronic supplementary information (ESI) available: Characterisation of zinc oxide particles and NDs, surface characterisation and detailed analysis of proteomics data. See DOI: 10.1039/c9tb00445a |
| This journal is © The Royal Society of Chemistry 2019 |

